
Global Analysis of Mouse Polyomavirus Infection Reveals Dynamic Regulation of Viral and Host Gene Expression and Promiscuous Viral RNA Editing
Mouse polyomavirus (MPyV) is a small 5.3kb circular double-stranded DNA virus capable of causing tumors in a variety of tissues in immunocompromised mice. It has been a subject of study for over 60 years, yielding insights into a number of processes including tumorigenesis, cell cycle signaling, and transformation. This study serves to provide a global view of the MPyV infection by utilizing Illumina sequencing to observe changes in total RNA from both the virus and the host cell as well as applying new methods to more directly confirm the extent of A-to-I editing of viral RNA by host ADAR enzymes. This allows for a simultaneous observation of both host and viral transcriptional changes that occur as a result of early gene expression and the viral switch from early to late genes that occurs coincident with the initiation of DNA replication.
Published in the journal:
. PLoS Pathog 11(9): e32767. doi:10.1371/journal.ppat.1005166
Category:
Research Article
doi:
https://doi.org/10.1371/journal.ppat.1005166
Summary
Mouse polyomavirus (MPyV) is a small 5.3kb circular double-stranded DNA virus capable of causing tumors in a variety of tissues in immunocompromised mice. It has been a subject of study for over 60 years, yielding insights into a number of processes including tumorigenesis, cell cycle signaling, and transformation. This study serves to provide a global view of the MPyV infection by utilizing Illumina sequencing to observe changes in total RNA from both the virus and the host cell as well as applying new methods to more directly confirm the extent of A-to-I editing of viral RNA by host ADAR enzymes. This allows for a simultaneous observation of both host and viral transcriptional changes that occur as a result of early gene expression and the viral switch from early to late genes that occurs coincident with the initiation of DNA replication.
Introduction
MPyV is a small circular double-stranded DNA virus with a life cycle that is divided into distinct early and late phases of infection. During the early phase the virus expresses both early-strand and late-strand transcripts from its bidirectional noncoding control region (Fig 1A), but the early-strand transcripts preferentially accumulate and are spliced into mRNAs for Large, middle, and small tumor antigens [1–9]. These early gene products induce host cell S phase entry and the virus utilizes host factors for viral DNA replication [10]. Around 12–16 hours after infection, DNA replication begins, late-strand RNAs accumulate rapidly, and are alternatively spliced to generate mRNAs for the viral capsid proteins VP1, VP2, and VP3 [6,11,12].

MPyV Large T antigen is involved in a variety of roles during the course of infection, including altering host protein pathways to promote virus production [13], blocking the interferon antiviral response [14], recruiting host DNA replication factors to the viral origin [15,16,17], acting as a helicase for viral DNA replication [18], and modulating late gene transcription [19]. Expression of MPyV Large T antigen is sufficient to immortalize primary rat embryonic fibroblasts [20]. Large T affects host cell cycle progression by binding to proteins in the retinoblastoma family of tumor suppressors, pRB, p107, and p130 [21,22] as well as CREB binding protein (CBP) and p300, which regulate cell growth, transformation, and development [23,24]. All three T antigens share an N-terminal DnaJ domain, which can bind the heat shock protein Hsc70 and induce its ATPase function [25]. Large T antigen exhibits both J domain dependent and independent binding to pRB [26].
MPyV middle T antigen is a highly oncogenic protein that is necessary for viral transformation of cells in culture. Middle T has no catalytic domain but rather acts as a scaffold, which functions like a constitutively active receptor tyrosine kinase to activate signal transduction pathways such as Shc, PI3K, and PLCγ [27]. Middle T contains a hydrophobic C-terminal region that anchors it to the cell membrane, which is necessary for it to function [28]. Both middle T and small t contain a domain that binds the A and C subunits of PP2A by mimicking its B subunit [29,30]. Once middle T binds to PP2A it can then bind to protein tyrosine kinases of the Src family such as Src, Yes, and Fyn [31–33]. This causes middle T to be phosphorylated at tyrosine 250, 315, and 322 [34–37], which allows activation of the Shc, PI3K, and PLCγ signaling pathways, respectively [38–40].
MPyV small t antigen functions primarily by binding protein phosphatase 2A (PP2A). Like middle T, small t binds PP2A by mimicking the B subunit to bind to the A and C subunits. MPyV small t is able to bind to both the Aα and Aβ subunits at the B binding site, precluding PP2A regulation by the B subunit [29,41]. Small t has been shown to induce phosphorylation and degradation of the cyclin dependent kinase inhibitor p27 in a PP2A dependent manner, which supports S phase induction [42]. MPyV small t and a mutated form of middle T that does not localize to the cell membrane (and thus cannot interact with Src family kinases) both activate the MAP kinase cascade via PP2A [43]. While Large T antigen does not bind p53 directly in MPyV-infected cells, small and middle T antigens have been shown to resist apoptosis in p53-induced cells through PP2A and PI3K respectively [44].
Although the switch from early to late phase of infection has been thought by some to be regulated primarily at the level of transcription [19], this has been challenged by results consistent, rather, with a change in the processing of late-strand transcripts [1,45]. While the precise mechanism remains to be elucidated, it has been demonstrated that the early-late switch is DNA replication-dependent and results in a reduction of polyadenylation efficiency [3,46]. During the late phase of infection, giant multigenome-length pre-mRNAs from both strands of the viral genome can be detected [47,48]. These giant pre-mRNAs allow for 57 nucleotide late leader exons to splice to one another across genome-length introns. This splicing increases the stability of late transcripts [49] and generates late mRNAs with multiple tandem leader exons at their 5’-ends (Fig 1B) [2,11,50]. The presence of giant transcripts antisense to the early genes also results in sense-antisense RNA duplexes to form, followed by extensive editing by the enzyme Adenosine Deaminase that Acts on RNA (ADAR1), which binds to double stranded RNA and deaminates adenosines to inosines [51,52]. The loss of polyadenylation and transcription termination efficiency that leads to the formation of giant transcripts may be caused, at least in part, by dsRNA or RNA editing induced by the overlap of early-strand and late-strand primary transcripts owing to overlapping polyadenylation signals. Viral mutants that do not allow efficient transcript overlap are defective in their early-late switch [46].
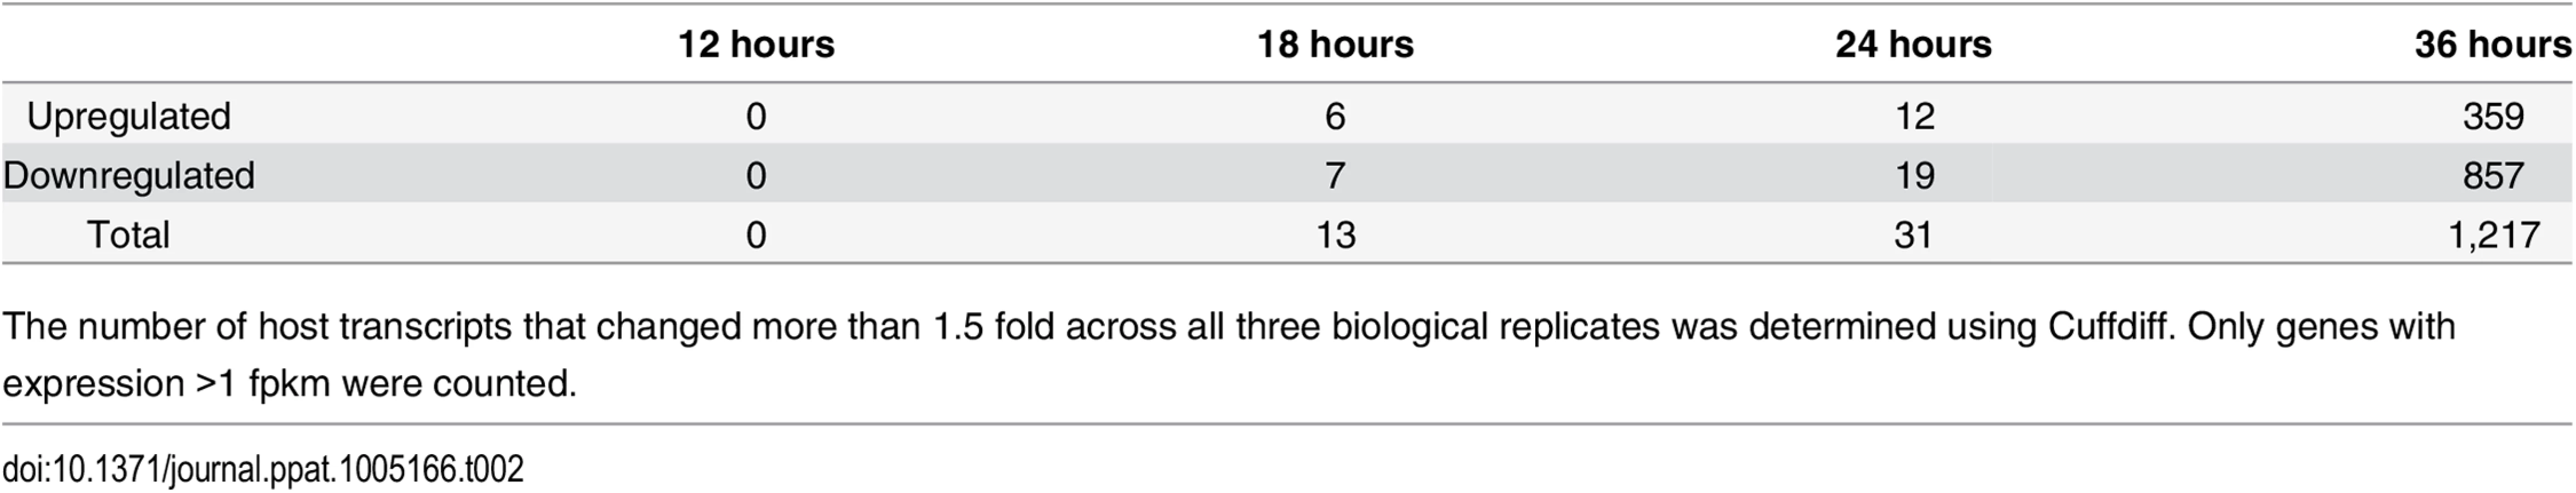
In order to further characterize MPyV infection we have used deep sequencing to compare changes in the transcriptome of both viral and host transcripts at different times of infection (Fig 1C). This allowed strand-specific quantification of the relative changes in transcription, splicing, and editing that occurs during MPyV infection. In addition, a number of new insights into viral gene regulation were obtained, including changes in apparent start sites of early transcripts and extensive RNA editing throughout the viral genome. By 36 hours after infection, 359 genes were shown to be significantly upregulated and 857 genes were shown to be significantly downregulated across three biological replicates when compared to mock infections. Gene ontology analysis showed the upregulated genes to be primarily involved in metabolism, DNA replication, RNA processing, and translation while the downregulated genes were primarily involved in transcription regulation, cell adhesion, extracellular matrix, and signal transduction. Analysis of common transcription factor binding sites showed regulation by transcription factors such as E2F, CREB, ATF, and NFkB in the upregulated genes and SP1, WT1, AP2, and TFIII in downregulated genes.
Results
RNA expression in NIH 3T6 cells infected with the Py59RA strain of mouse polyomavirus
Mouse NIH 3T6 cells were chosen for infection for their ability to facilitate lytic infection by wild type MPyV [53]. Cells were serum starved to partially synchronize their cell cycles and then infected without (mock infection) or with filtered Py59RA virus (MPyV) at a multiplicity of infection (MOI) of 50 plaque forming units per cell. The viral titer was determined by plaque assay and was generously provided by Dr. R. Garcea. An MOI of 50 resulted in maximal infection in our system, as measured by immunofluorescence for large T antigen (S1 Fig). Any increase in MOI beyond this point did not result in more infected cells. Total RNA was harvested at 12, 18, 24, and 36-hours post infection from three biological replicates for each condition and was used in the synthesis of stranded cDNA sequencing libraries using the Illumina TruSeq Stranded Total RNA Sample Preparation Kit. These timepoints were chosen because in previous work in our lab we found that the early-late switch occurred between 12 and 16 hours post infection [2,3]. Thus, we selected a timepoint before the onset of DNA replication, one at about the time of its onset and two later in the infection, to allow the accumulation of late viral RNAs and affected cellular transcripts. This resulted in libraries ~260 base pairs in length (S2 Fig). The libraries were sequenced using the Illumina HiSeq 2000 platform using paired-end reads of 100 bases in the forward and reverse directions. Sequencing data was aligned using TopHat and normalized transcript abundance was calculated in fragments per kilobase of exon per million fragments mapped (FPKM) using Cufflinks. Significant differences between the virus and mock infections at each time point were determined using Cuffdiff. Each condition had three biological replicates producing 10–50 million 100 base reads with close to 80% aligning to the host genome and over 1% aligning to the viral genome by 36 hours post infection (S1 Table).
The mouse polyomavirus transcriptome
In order to visualize changes in viral transcripts at different time points during infection, we used Bowtie and Top Hat to align sequencing reads to a Py59RA reference genome (S3 Fig). At 12 hours after infection, reads mapped to both early and late strands, but with most representing early-strand expression. While this is consistent with a model where the early promoter dominates before the onset of viral DNA replication [19], it could also be consistent with a model in which the early-late switch is dependent on relative transcript stability rather than on regulation of transcription initiation [1]. By 18 hours after infection viral replication has commenced and the infection is entering the late phase. At this point, there is an approximate 100-fold increase in reads aligning to the late strand and these transcripts are beginning to dominate over early-strand transcripts (Fig 2A). Also of note at this time is the appearance of a significant number of transcripts that extend beyond the late polyadenylation site, representing multi-genomic late-strand transcripts [46,47]. While most fully polyadenylated and spliced late RNAs are cytoplasmic [54,55], these giant RNAs are nuclear and serve as precursors to late mRNAs [55–57]. By 24 and 36 hours after infection the number of late strand alignments increases to around 1000 fold compared to early times. We note that at late times the majority of fully processed viral mRNAs have accumulated in the cytoplasm [2,5,7,9].

While the relative levels of early-strand and late-strands change dramatically during infection, we noted no significant changes in patterns of RNA splicing, but did observe several interesting and unexpected changes to early-strand RNA accumulation during infection. First, it is clear that, relative to the bulk of early-strand RNAs, there is an apparent elevated alignment to a roughly 200 base pair region just downstream of the early polyadenylation site (Fig 2B). This peak was not apparent when DNA replication and the early-late switch was blocked by aphidicolin (Fig 3). In this experiment, mouse NIH3T6 cells were infected with Py59RA virus in the same manner as the time course except they were treated with either the same media or media with 2 μg/ml of the DNA replication inhibitor aphidicolin to prevent the infection from entering the late phase [3]. The infected samples, both treated and untreated, were incubated for 40 and 48 hours before RNA was collected for stranded cDNA library synthesis using the same protocol as the time course. This allowed sufficient accumulation of early gene products without the untreated samples reaching the lysis phase of the viral life cycle. Results were only aligned to the viral genome since aphidicolin treatment would likely cause significant alterations to the host transcriptome.

The second unexpected change in early-strand RNA alignments during infection is in the early promoter/origin/noncoding control region. We originally noted changes in alignments to the edges of our reference genome. By aligning the reads to a linearized reference genome shifted by about 150 bp, we were better able to visualize the nature of these molecules, which span the replication origin. As infection proceeds, there is a clear increase in the alignment of early-strand reads to the origin of replication and enhancer region, strongly suggesting a potential upstream shift in early-strand transcription start sites during infection, and particularly after the onset of viral DNA replication (Fig 2B). We note that even at late times after infection in the aphidicolin treated samples, this shift was not observed (Fig 3B). Such a shift from a strict early transcription start site downstream of a canonical TATA box at early times (e.g., the 12 hour time point) to variable upstream transcription start sites at late times was suggested previously to explain confounding results obtained by S1 nuclease experiments [58,59]. Mapping of the hybridization of 5’ ends of cytoplasmic early-strand transcripts at late times to a region of the MPyV genome containing the noncoding control region and part of the early region showed an apparent increase in usage of upstream start sites [58,59]. In order to confirm a shift in early startsites after the onset of DNA replication we performed 5’-RACE analysis. Results (S4 Fig) clearly show that at 12 hrs post infection, most early 5’-ends map to the annotated startsite region, but by 36 hrs post infection, many early-strand transcripts initiate over a broad region between the replication origin and the late promoter startsite region. This replication-dependent switch is not unprecedented, as altered early-strand startsites at late times have been reported both for SV40 [60] and for JC virus [61]. Importantly, Fenton and Basilico reported a broad region of early strand startsites at late times in infection that mapped to sites completely consistent with our data [59].
Splicing analysis
Using TopHat to map the splice junction reads we were able to determine the relative expression levels of the 5 viral isoforms that contain splice junctions (Table 1). At 12 hours post infection the mRNA for Large T represents 75% of early-strand mRNAs, with mRNAs for middle T and small t accounting for 20% and 5%, respectively. We also note that a fourth early mRNA, for “tiny t antigen” encoding just the DnaJ domain [62] has been reported and this is seen in our data, although this message is of very low relative abundance. As infection proceeds, the ratios of Large, middle and small T antigen mRNAs change little, indicating that early strand splicing is likely not regulated strongly by viral or host proteins that change during infection. Like early mRNAs, late splicing patterns do not change dramatically during infection, although the absolute numbers of alignments increase up to 1000 fold, consistent with the strong upregulation of late gene expression. The ratio of spliced isoforms in the aphidicolin treated infections was essentially the same as in the time course experiment (large T 59%, middle T 24%, small t 16%, tiny t 1%).

Leader-to-leader splicing
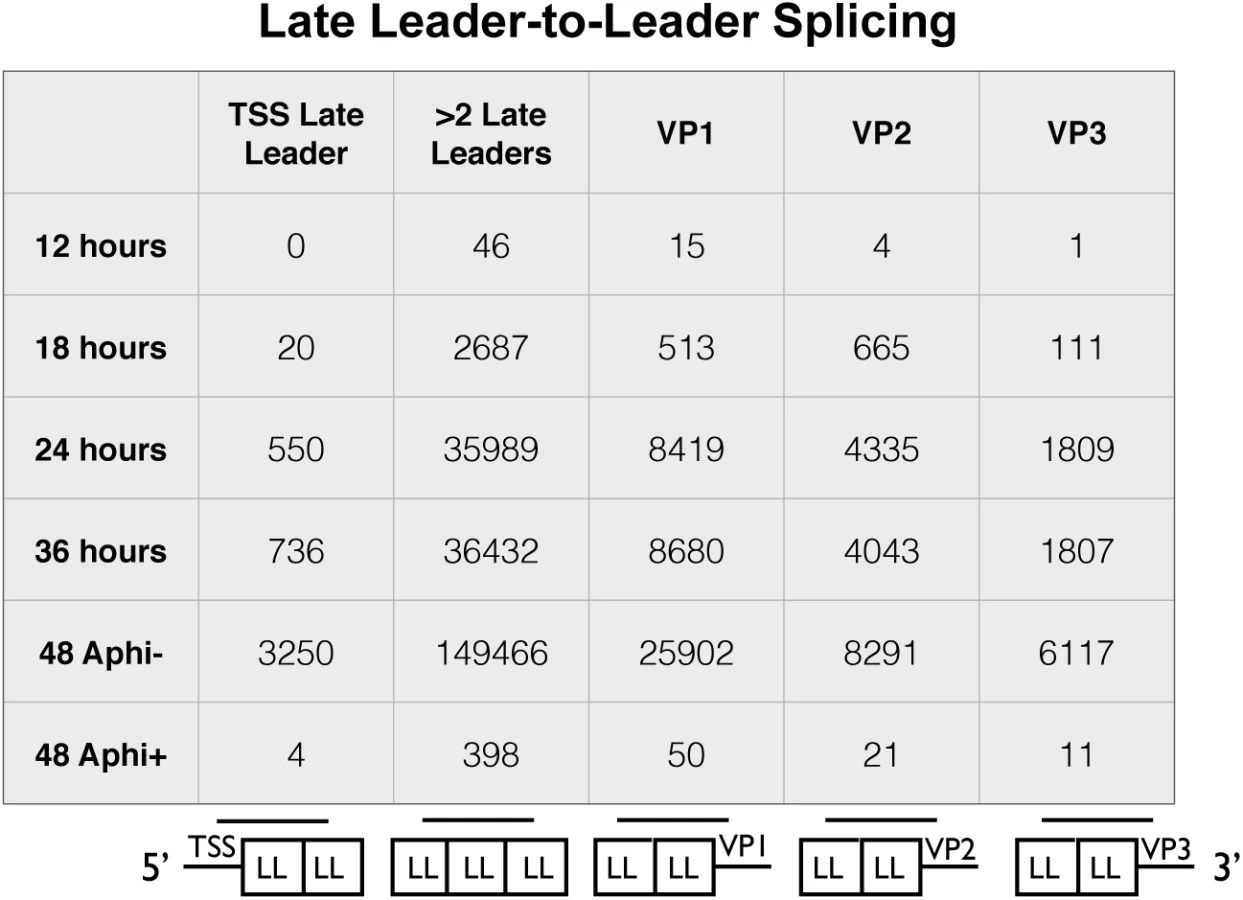
Owing to the presence of tandem repeats of late leaders in all three late mRNAs, alternative reference sequences were required to capture reads that span at least one leader-to-leader splice junction (Fig 4). The stranded cDNA libraries produce 2x100 base pair reads. The late leader exon is 57 bases long so we required a reference sequence that captured reads that extended at least 1 base past the first leader-to-leader splice junction both downstream and upstream of the late leader on VP1, VP2, and VP3 cDNA as well as the late transcription start sites. We used a reference sequence containing 42 bases upstream of the late leader exon near the transcription start region followed by a full late leader exon and the first 42 bases of the next late leader (Fig 4 bottom of first column). We also used a reference sequence of the last 42 bases of late leader, a full late leader, and the first 42 bases of late leader to capture ambiguous leader to leader reads from any mRNA crossing at least 2 leader to leader splice junctions (Fig 4 bottom of second column). Reference sequences containing the last 42 bases of a late leader followed by a full late leader and 42 bases of the 5’ UTR of VP1, VP2, or VP3 (Fig 4 bottom of third, fourth, and fifth columns). Leader-to-leader splices were only seen at significant levels in time points later than 18 hours and in cells untreated with aphidicolin, supporting the model that leader to leader splicing occurs after DNA replication. These results are consistent with RT-PCR analyses (S5 Fig).
A-to-I editing of viral RNAs
Due to the read-through of early and late transcripts at late times, as well as the genomic overlap of the early and late polyadenylation signals, there is the possibility that if complementary sequences accumulate near one another in the nucleus, they might form double stranded RNAs. As nuclear dsRNAs can be promiscuously edited by ADAR enzymes, which deaminate adenosines to inosines [52], viral dsRNAs should also exhibit this fate. We have reported previously that this is indeed the case [46,51], but the current study allowed us to examine viral RNA editing in more comprehensive detail, which was done in two ways. Since inosine base pairs in the same manner as guanosine, we first looked for individual A-G mismatches in the read alignments to search for potential sites for editing. We divided the 100 nucleotide reads into four 25-nucleotide fragments and allowed up to three base mismatches during the alignment step [63]. After filtering for any sequences that aligned to the mouse genome, we realigned the sequences to the viral genome to show regions of A-G mismatches (S6 Fig). Such alignment cannot be conclusive for RNA editing, as it could merely reflect sequencing or alignment errors. Indeed, this sort of analysis, when applied to other base transformations, generated similar, though less robust, data (S2 Table). We therefore examined viral regions where A-G mismatches greatly outnumbered mismatches caused by any other base changes. The most striking region associated with A-G changes was the overlapping polyadenylation region, which showed a much higher rate of A-G mismatch compared to other combinations (S2 Table). This was not surprising since the polyadenylation region has previously shown to be edited at late times during infection [46].
As long dsRNA is subject to hyper-editing, where up to 50% of the adenosines are converted to inosines [51], it is quite likely that the above analysis missed much or most of the editing that occurs during MPyV infection. In order to capture a greater fraction of hyper-edited reads that may have been omitted due to having too many A-G mismatches we used a method recently described by Porath et al [64]. These authors developed a pipeline that sorts unaligned reads based on whether they fail to align due to a specific type of mismatch and whether such mismatches occur in the types of clusters associated with hyper-editing. The first step in the pipeline is to align all the reads to the mouse genome to reduce the total number of reads and remove most non-viral sequences. Second, is to align the remaining reads to the viral genome and discard any that align perfectly or with few mismatches. Third, is to transform all As in both the reads and the reference genome to Gs and discard any transcripts that do not align. This allows us to only sort for reads that initially had A to G mismatches. Fourth, the mismatches are clustered based on predictions for known A-I editing including adjacent sequences and only reads that cluster in a manner consistent with A-I editing are kept. Finally the bases that are members of clusters are displayed on the UCSC genome browser (Fig 5). Results showed a time-dependent increase in the number of bases that were members of hyperedited clusters, with a large concentration of such clusters around the overlapping polyadenylation sites. No significant editing was detected in aphidicolin treated samples. Together, these data are consistent with our previously reported MPyV editing results [46,50]. Shortly after the early late switch at 18 hours we see the polyadenylation region (and a cryptic poly(A) site in the early region, just downstream of the stop codon for middle T antigen) showing editing clusters. As the infection progresses the number and size of the clusters increases on both strands. This is consistent with editing resulting from early and late strand hybridization since the over abundance of late sequence compared to early would only produce more clusters if the late strand formed hairpins and was edited in cis. Editing clusters can also be seen in the noncoding control region suggesting that multi-genome length giant transcripts are capable of annealing with one another. While editing has long been predicted due to the long antisense transcripts and poly(A) read-through, this is the first time we have had direct evidence of genomewide editing at late times. We note, however, that while editing is readily and abundantly observed, we cannot conclude from these data whether it is a cause or a consequence of viral gene regulation.

Effects of viral infection on host gene expression
Our deep sequencing data allowed us to not only examine viral gene expression during infection, but also changes in the host transcriptome that result from the infection. Using Cuffdiff to compare gene expression between MPyV and mock infected samples, we found 1,216 genes were differentially expressed at least 1.5 fold across all three replicates with 359 genes upregulated and 857 genes downregulated compared to the mock infections at the 36 hour time point (Tables 2, S3 and S4).
We used the database for annotation, visualization, and integrated discovery (DAVID) (http://david.abcc.ncifcrf.gov/) to determine the gene ontology of the differentially expressed genes that were significantly enriched based on common biological function (Table 3). We also selected genes of high abundance with a strong up or down regulation between mock and virus infected cells at 36 hours for validation by RT-qPCR (S7 and S8 Figs).

For the upregulated genes, the categories with the highest enrichment included transcripts coding for ribosomal proteins, chromatin binding proteins, DNA replication, RNA processing, and mitochondrial proteins. These are all consistent with the known increase in growth and metabolism induced by the combined action of the early genes. For example, the transcript for Hist1h1a that codes for the histone 1 linker involved in compacting DNA during replication [65] is upregulated more than 2 fold in infected cells by 36 hours (Fig 6A). The transcript for the mitochondrial inner membrane protein Timm8a1 that is involved in the insertion of cytoplasmic proteins into the mitochondrial inner membrane [66] is also upregulated. Another interesting observation is the transcript coding for the JunB component of AP-1 transcription factors is upregulated. This is of interest because JunB was originally understood to function as an antagonist of the AP-1 protein c-Jun, which is involved in cell cycle progression [67,68]. Later observations found this interaction to be more complex and sensitive to cell type and context [69].

Downregulated genes were enriched in categories such as GTPase regulation, cell adhesion, actin cytoskeleton, extracellular matrix, and transcription regulation. One of the more strongly downregulated transcripts included Col1a2 (Fig 6B) which codes for one of the polypeptide components of type 1 that makes up the extracellular matrix [70]. Another strongly downregulated transcript encodes the steroyl-CoA desaturase 2 (Scd2) enzyme that catalyzes the synthesis of monounsaturated fatty acids, increasing membrane fluidity [71]. Unlike in MPyV infection, Scd2 has been shown to be upregulated in other cancer cells and may be responsible for inducing hepatocellular carcinomas [72]. It is unclear how the virus would benefit from a reduction in monounsaturated fatty acid synthesis. The transcript for the protein myristolylated alanine-rich C-kinase substrate (Marcks) that is involved in altering the actin cytoskeleton [73], cell motility [74], and functions as a tumor suppressor [75] was originally shown to be downregulated in mouse 3T3 fibroblast cells expressing v-Src [76]. Our data also show significant down regulation of this transcript.
In addition to coding RNAs, we observed significant changes in the expression of noncoding RNAs (S7 and S8 Figs and S4 Table). The noncoding small nucleolar RNA Snhg1 was highly expressed and significantly upregulated (Fig 7A). Snhg1, also known as the host gene for U22, is expressed from an intron and is required for processing of 18S ribosomal RNA [77]. This is consistent with the increase in the expression of genes involved in ribosome biogenesis and translation in MPyV infected cells. Another noncoding RNA, Metastasis Associated Lung Adenocarcinma Transcript 1 (MALAT1), was significantly downregulated in infected cells (Fig 7B). Though the precise function of MALAT1 is still unclear, it has been shown to be involved in a variety of metastatic cancers [78]. Its downregulation is consistent with the downregulation of other genes involved in cell motility in MPyV-infected cells.

Taken together, these observations illustrate a change in priority of infected cells from cell-to-cell interaction, movement, and signal transduction to growth, metabolism, and DNA synthesis.
Do differentially expressed genes share common patterns of regulation that may help to explain their response to viral infection? In order to determine common transcription factor binding sites upstream of differentially expressed genes we used the Transfind tool (http://transfind.sys-bio.net/) to determine common transcription factor binding sites among the differentially expressed genes [79]. Using a threshold of binding motifs common to the upstream regions of <1000 genes (out of 33,837 genes in the mouse database) and a false discovery rate <0.02, we found a number of common transcription factor binding sites (Table 4). As expected the promoters of upregulated genes were the most enriched for binding sites of the transcription factor E2F, which is a major cell cycle regulator that is released and activated by the binding of Large T antigen to pRB [80]. Binding sites for members of the CREB-ATF family of transcription factors were also enriched in the upregulated gene set. This is consistent with CREB Binding Protein (CBP) and EP300 being targets for Large T antigen, resulting in CRE containing promoters being activated [24]. The nuclear factor kappa B (NFkB), which has been previously shown to be involved in inflammation, transformation, proliferation, angiogenesis, and metastasis shows binding sites upstream of the upregulated genes [81]. Interestingly, STAT1, which is involved in signal transduction of the interferon pathway, appears to have a common binding site among a number of the upregulated genes. While the interferon pathway does not appear to be active (pathway genes were not noted to be strongly up or down regulated during infection), the fact that many upregulated genes share the potential to be affected by it is of interest.

Discussion
We have presented here a global view of MPyV infection with respect to both the virus and the host transcriptomes. The data and analyses have allowed us to generate a detailed picture of how viral gene expression changes throughout the life cycle as well as to learn how infection impacts host cell gene expression. We analyzed RNA from a number of individual time points, from relatively early in infection (12 hours post infection) to late times (36 hours post infection) but before extensive cytopathic effects were noted. Although there were several surprises, the observed expression and processing of viral transcripts was generally consistent with previous literature. At early times in infection, early-strand transcripts dominated over late-strand transcripts. This early pattern is even more dramatic when DNA replication is blocked with aphidicolin and the infection allowed to proceed for 48 hours. At early times, most of these transcripts appear to initiate at a defined site and terminate just downstream of the annotated early polyadenylation signal. These are spliced to produce mRNAs for the three viral early proteins, Large, middle and small T antigens. However, by 18 hours, after Large T antigen has promoted the onset of viral DNA replication, the pattern of expression reveals a striking shift toward the late phase, where late-strand RNAs greatly dominate over early-strand RNAs. This early-to-late switch is characterized by several distinct and important changes in the pattern of alignments in our data. First, as late messages accumulate rapidly and genomes replicate, we noted an unexpected shift in the position of the 5’-ends of early-strand transcripts. At late times, early-strand RNAs appear to initiate over a broad region upstream of the early TATA box, and throughout the origin of replication and enhancer region. We do not yet know why this is the case or how it is regulated, but these findings are consistent with an earlier reports in which heterogeneous 5’-ends at late times were mapped using nuclease S1 protection [58,59] as well as with studies on both SV40 and JC virus [60,61]. Interestingly, this shift depends on viral DNA replication, since after blocking it with aphidicolin, these upstream 5’-ends were not seen, even after 48 hours. One possible explanation for this observation is the fact that the A enhancer on the late side of the origin also functions as a bidirectional promoter site for the late transcripts [82]. Since this shift in early transcription is only seen in the late phase, it is possible this region is transcribing bidirectionally. We note that since large T antigen is expressed during aphidicolin treatment, this shift also depends on replication and not just on viral early proteins. Further studies are needed to determine the molecular mechanism for this phenomenon.
Another clear change in early-strand expression, and also dependent on DNA replication, was the appearance and accumulation of reads mapping to a region several hundred nucleotides downstream of the major early polyadenylation site. These reads appear to result from poly(A) site read-through and are antisense to VP1. While we do not yet know why or how they accumulate, we considered one possible explanation to be that they represent precursors for viral-encoded microRNA(s). MPyV and SV40 have previously shown viral expression of microRNAs antisense to Large T antigen, which were hypothesized to help avoid a cytotoxic T cell response [83,84]. Upon analysis of the sequence in the region, we found no predictors of stem loop structures on either strand that would be consistent with a viral premiRNA. Alternatively, the increase in sequences from this region could result from uneven processing/degradation of early-strand transcripts that have read through the early polyadenylation site. However, the absence of clearly defined ends of these mapped reads is hard to justify with specific processed products. Importantly, we cannot rule out the possibility that sequences aligning to this region result from an artifact of a bias in the synthesis or processing of the sequencing libraries. Consistent with such a hypothesis, we note that these reads consistently represented about 3% of the level of reads mapping to the complementary late strand in this region of the genome. Also, the early strand in this region contains 15% A’s and 40% T’s. Stranded libraries are made using dUTP incorporation. If complementary transcription of the late transcripts from this region (we are generating about 200 nt cDNAs) inefficiently incorporates dUTP for any reason, then the strandedness would be compromised. In our protocols, this type of artifact may be happening at numerous places, but at much lower levels than in the region in question. For example there is a smaller peak between the early poly(A) site and the peak in question that appears to accumulate in exactly the same way.
Late-strand transcription and processing also changes during infection. While accumulating to only low levels before viral replication, or in its absence, these RNAs accumulate rapidly afterwards, and by late times represent the great majority of viral RNAs in the cell. Their processing may also change with time, although we did not note any discernible change in transcription start sites. As we and others have reported before, late transcription can proceed many times around the circular viral genome, leading to a heterogeneous collection of giant transcripts that can serve as precursors to mature late mRNAs [46–50]. Processing involves not only alternative splicing to generate messages for VP1, VP2 and VP3, but also the splicing of noncoding late leader exons at their 5’-ends. The number of tandem leader units appearing on late mRNAs reflects the number of transits around the genome made by RNA polymerase II before transcription termination and polyadenylation. We noted a striking accumulation of leader-leader splicing events at late times in infection. These were only seen at late times, and after DNA replication.
Late leader splicing requires inefficient late-strand transcription termination and polyadenylation. We have reported previously that this is the result of particular viral genomic features in the early/late polyadenylation region [46]. These sites overlap on the genome and this affords viral transcripts the opportunity to anneal with one another, leading to dsRNA in the nucleus. dsRNA formation could alter normal 3’-end processing by interfering with the polyadenylation machinery. Also, dsRNA formation could lead to promiscuous editing by ADAR1, leading to RNAs that cannot be recognized by the processing machinery. We have previously found that viruses that cannot generate early-strand and late-strand transcripts with regions of overlap are incapable of the early-late switch [46]. The consequences of such dsRNA formation are of profound importance for the virus. Inefficient late-strand termination leads to the multigenomic transcripts that serve as precursors to late mRNAs [47–50]. Early-strand termination is also likely to become less efficient, but in this case the multigenomic transcripts are not used for mRNA production, but are rather likely degraded in the nucleus owing to unproductive splicing. Our data support these concepts. While our transcriptomic data reveal mostly the accumulated mature mRNAs at late times, close inspection reveals roughly equal levels of poly(A) site readthrough transcripts from each strand. These would be expected to be capable of dsRNA formation, leading to ADAR editing. Indeed, A-to-G mismatches consistent with A-to-I editing were observed to only occur at late times (but not in cells untreated with replication inhibitor), with robust editing observed in the overlapping polyadenylation site region. The hyperediting pipeline we employed allowed us for the first time to capture MPyV reads that would otherwise be too heavily altered to be identified. The increase in edited clusters aligning along the entire length of the reference genome was predicted but, to our knowledge, has never been directly observed until now. Taken together, these observations confirm previous models of the early-late switch that describe a loss of polyadenylation efficiency concomitant with an increase in editing of the polyadenylation sites and resulting in giant multigenomic RNAs, which can be spliced to generate multiple late leader exons on late mRNAs.
Alignment of reads from the time course infection to the host genome showed the greatest change between mock and infected samples by 36 hours, allowing us to observe the accumulated effects of the virus on the host transcriptome. We suspect that examination of even later time points might yield more genes changing more than 2 fold up or down, but at time points closer to 72 hours cells would be entering the lysis phase of the viral life cycle and any observed changes would likely be difficult to separate from those associated with host cell death. At 36 hours post infection, we found 359 genes significantly upregulated and 857 genes significantly downregulated. Many of the genes upregulated were involved in predicted processes such as metabolism, ribosome synthesis, mitochondrial proteins, and cell cycle progression. This is consistent with the action of viral T antigens in stimulating the proliferation of host cells. Many downregulated genes were also largely unsurprising, with those involved in cell motility, extracellular matrix, and cell signaling processes prominent on the list. We note that our results are somewhat consistent with those published by the Wintersberger group, where small t and Large T were individually induced in NIH3T3 cells, followed by microarray analysis [85]. Those studies showed that overexpression of each of these proteins for 28 hours (middle T was not studied) led to numerous up or down changes, most in the 2-fold range. Our system is different in that it follows a natural infection (and in different cells, which may already be partially transformed) which expresses not individual viral proteins, but all of them at the same time.
Finally, we noted the upregulation or downregulation of several abundant long noncoding RNAs. There are several lncRNAs of particular interest. One is Malat1 (downregulated), which has been associated with metastasis and which may play a role in RNA processing [76]. Another is Terc (upregulated), which is involved in telomere maintenance and cellular lifespan [86]. Finally, several lncRNAs associated with RNAse P enzymes are also strongly upregulated. We do not yet know the significance of this, but such molecules have been implicated in tRNA and ribosomal biogenesis, which is consistent with the observed increase in host translation in infected samples [87].
Here we have presented for the first time a global analysis of both viral and host transcriptional changes from a mouse polyomavirus infection. The viral transcriptome analysis revealed insights into changes in RNA expression, especially with respect to the early strand at late times and confirmed a number of previous observations of the MPyV lifecycle. This is the most direct evidence of widespread hyper-editing of viral RNA predicted from a model of extensive early and late strand transcription. The observations of changes in host transcription also confirm a number of predictions including the increase in genes involved in cell growth, metabolism, and translation. Future investigation into more precise aspects of the lifecycle including later time points, nuclear and cytoplasmic fractionation, and poly(A) plus and minus samples may yield further insight into the viral-host interactions.
Materials and Methods
Cell culture and virus infection
NIH 3T6 mouse fibroblast cells were cultured on 10 cm plates at a density of 600Kcells/plate in Gibco Dulbecco’s Modified Eagle Medium (11995–065) supplemented with 100 units of penicillin/streptomycin, 2mM L-Glutamine, and 5% calf serum. Cells were serum starved in 2% calf serum 1 day before infection to synchronize cell cycles. Mouse polyomavirus strain Py59RA was generously provided by Dr. Robert Garcea in 2% Medium at 180 million plaque forming units per ml. In our hands, higher apparent multiplicities were required to ensure maximal infection of our cells in culture. Virus was diluted to 15 million PFU/ml to infect cells at an MOI of 50 using 2 ml of virus per plate. Cells were infected by removing media and adding 2 ml of virus for 2 hours before being supplemented with 8ml of 2% media at time point 0. Mock infections were carried out using 2% medium without filtered virus particles. Total RNA was harvested at 12, 18, 24, and 36 hours after infection by removing media, washing with PBS, and adding 4M guanidinium isothiocyanate. For the aphidicolin treated samples, cells were plated at the same density, treated with the same media, and infected at the same MOI for 40 and 48 hours. Aphidicolin positive cells were treated with media containing 2μg/ml aphidicolin.
Preparation of TruSeq stranded library
RNA was isolated by cesium centrifugation through 2 ml of 5.7M cesium chloride at 39000 rpm at 20°C for 18 hours and DNAse treated with DNAse 1 from the Ambion DNAse I Kit. 1 μg of RNA was used from each sample for library preparation with the TrueSeq Stranded Total RNA kit from Illumina. Ribosomal RNA was depleted using rRNA binding beads and the RNA was fragmented and primed with random hexamers. First strand synthesis was done using a mixture containing Superscript II and Actinomycin D to synthesize RNA dependent DNA and inhibit DNA dependent RNA respectively. Second strand synthesis was done using dUTP instead of dTTP to create stranded cDNA. Libraries were then adenylated at the 3’ end and adaptors containing identifier sequences and flow-cell binding sequences were ligated to both ends. Finally the cDNA fragments were amplified for 12 cycles instead of 15. The Agilent Technologies 2200 Tapestation was used to verify library size at ~260bp. Sequencing was done on a HiSeq 2000 by Perkin Elmer.
Analysis
All alignments were made using Tophat v 2.0.9, Bowtie 2.1.0, and Samtools 1.19. Alignments to MPyV were done using the reference genome for the Py59RA strain of mouse polyomavirus for both time course and aphidicolin experiments. Time course experiments consisted of four conditions, for mock infection and four conditions for MPyV infection representing 12, 18, 24, and 36 hour time points with three biological replicates per condition. Aphidicolin experiments consisted of two conditions Aphi+ and Aphi - with two biological replicates.
Alignment of time course reads to the host genome was done using the reference genome from Illumina’s IGENOMES collection, which in turn was taken from USCS March 5, 2013. Custom scripts were used to postprocess Tophat output to produce strand-specific bedGraph files suitable for use on the UCSC genome browser.
Alignment of reads to the viral origin was done using a custom script that rotated the genome zero position counterclockwise by 149nt to avoid splitting annotated transcripts. The reads were aligned to the “rotated” reference genome using Tophat with a new Bowtie index and transcriptome index. A custom script was then used to convert the new alignments to the original coordinates and the new alignments were added to the original alignments and displayed on the UCSC genome browser.
Alignment of reads containing tandem repeats of the late leader exon from late gene mRNAs that would not align to the viral genome directly was accomplished by doing a direct Bowtie1 end-to-end alignment to predefined reference sequences allowing for up to 2 mismatches. Three references contained 42 bases of the 5’ UTR of VP1, VP2, or VP3 followed by the 57 base late leader exon and the first 42 bases of the next late leader. One reference contained the last 42 bases of the late leader followed by a full 57 base late leader followed by the first 42 bases of the transcription start region upstream of the late leader exon. The last reference sequence contained a full 57 base late leader flanked by 42 bases of each late leader on either side. This allowed 100-base reads spanning at least one leader-to-leader splice junction that would not align more than once to the same reference sequence to align.
A to G mismatches were identified using custom scripts that split the fastq reads into smaller 25nt fragments and filtered out any that could align to the mouse genome. The remaining fragments were aligned to the Py59RA genome using Bowtie1, allowing for up to 3 mismatches. Another custom postprocessing script was used to interpret Bowtie alignment output format and scan mismatch fields for canonical editing substitutions.
The hyperediting scripts from Porath et al. [64] were downloaded and run in the context of our cluster pipeline. Custom scripts were used to extract information from output files, summarize, and plot as tracks on the UCSC genome browser.
The relative expression of host genes between time course Mock and PyV infected samples was determined using Cuffdiff v 2.1.1. Dispersion method pooled and dispersion method per condition were used to compare individual replicates and all replicates of a given condition. Custom scripts were used to post process/filter Cuffdiff output to produce time-series instances of significant log Fold change. Cluster 3.0 was used to produce a k-means clustering of time course gene expression. Genes with a log2 fold change of +/-0.75 representing a 1.5 fold change with an fpkm greater than or equal to 1 were used for gene ontology and transcription factor prediction.
Gene ontology analysis was done using the browser-based application DAVID (Database for Annotation, Visualization, and Integrated Discovery) (http://david.abcc.ncifcrf.gov/home.jsp). Gene lists of upregulated and down regulated genes were each run against a Mus musculus background and gene categories with a false discovery rate below 1E-03 were used with redundant categories removed.
Transcription factor binding prediction was done using the browser-based application Transfind (http://transfind.sys-bio.net/). The same gene lists of up and down regulated mouse genes were used with “800 upstream … 200 downstream of TSS (1000nt, long putative promoters)” for the promoter set category and with “1000” genes under the “highest predicted factor affinities to take” category. The TRANSFAC (highest info content for each factor) setting was used to represent the factors. The data for this paper have been deposited at GEO (GSE69314). http://www.ncbi.nlm.nih.gov/geo/query/acc.cgi?acc=GSE69314
Supporting Information
Zdroje
1. Hyde-DeRuyscher R, Carmichael GG. Polyomavirus early-late switch is not regulated at the level of transcription initiation and is associated with changes in RNA processing. Proc Natl Acad Sci USA. 1988;85 : 8993–7 2848251
2. Hyde-DeRuyscher R, Carmichael GG. Polyomavirus late pre-mRNA processing: DNA replication-associated changes in leader exon multiplicity suggest a role for leader-to-leader splicing in the early-late switch. J Virol. 1990;64(12):5823–32 2173769
3. Liu Z, Carmichael GG. Polyoma virus early-late switch: Regulation of late RNA accumulation by DNA replication. Proc Natl Acad Sci USA. 1993;90 : 8494–8 8397407
4. Liu Z., Batt D., Carmichael G.G. Targeted nuclear antisense RNA mimics natural antisense-induced degradation of polyoma virus early RNA. Proc Natl Acad Sci USA. 1994;91 : 4258–62 8183899
5. Beard P, Acheson NH, Maxwell IH. Strand-Specific Transcription of Polyoma Virus DNA Early in Productive Infection and in Transformed Cells. J Virol. 1976;17 : 20–6
6. Piper PW. Polyoma Virus Transcription Early During Productive Infection of Mouse 3T6 Cells. J Mol Biol. 1979;131 : 399–407 226720
7. Kamen R, Lindstrom DM, Shure H, Old RW. Virus-specific RNA in cells productively infected or transformed by polyoma virus. Cold Spring Harbor Symp Quant Biol. 1975;39 : 187–98 169059
8. Hunter T, Hutchinson M, Eckhart W. Translation of polyoma virus T antigens in vitro. Proc Natl Acad Sci USA. 1978;75 : 5917–21 216001
9. Tooze J. editor. Molecular Biology of Tumor Viruses: DNA Tumor Viruses. 2nd ed. Cold Spring Harbor, New York: Cold Spring Harbor Laboratory; 1981
10. Benjamin TL. Polyoma Virus: Old Findings and New Challenges. Virology. 2001; 289 : 167–173 11689038
11. Treisman R, Kamen R. Structure of Polyoma Virus Late Nuclear RNA. J Mol Biol. 1981;148 : 273–301 6271970
12. Weil R, Kara J. Polyoma “tumor antigen”: an activator of chromosome replication? Proc Natl Acad Sci USA. 1970;67 : 1011–7 4331714
13. Doherty J, Freund R. Polyomavirus large T antigen overcomes p53 dependent growth arrest. Oncogene. 1997;14 : 1923–31 9150359
14. Weihua X, Ramanujam S, Lindner DJ, Kudaravalli RD, Freund R, Kalvakolanu DV. The polyoma virus T antigen interferes with interferon-inducible gene expression. Proc Natl Acad Sci USA. 1998;95 : 1085–90 9448289
15. Kautz AR, Weisshart K, Schneider A, Grosse F, Nasheuer H. Amino Acids 257 to 288 of Mouse p48 Control the Cooperation of Polyomavirus Large T Antigen, Replication Protein A, and DNA Polymerase alpha Primase To Synthesize DNA In Vitro. J Virol. 2001;75 : 8569–78 11507202
16. Xie A, Bermudez VP, Folk WR. Stimulation of DNA Replication from the Polyomavirus Origin by PCAF and GCN5 Acetyltransferases: Acetylation of Large T Antigen. Mol Cell Biol. 2002;22 : 7907–18 12391158
17. Yaniv M. Small DNA tumour viruses and their contributions to our understanding of transcription control. Virology. 2009;384 : 369–374 doi: 10.1016/j.virol.2008.11.002 19068262
18. Wang EH, Prives CP. DNA Helicase and Duplex DNA Fragment Unwinding Activities of Polyoma and Simian Virus 40 Large T Antigen Display Similarities and Differences. J Biol Chem. 1991;266 : 12668–75 1648101
19. Kern FG, Pellegrini S, Cowie A, Basilico C. Regulation of Polyomavirus Late Promoter Activity by Viral Early Proteins. J Virol. 1986;60 : 275–85 3018290
20. Rassoulzadegan M, Naghashfar Z, Cowie A, Carr A, Grisoni M, Kamen R, Cuzin F. Expression of the large T protein of polyoma virus promotes the establishment in culture of “normal” rodent fibroblast cell lines. Proc Natl Acad Sci USA. 1983;80 : 4354–8 6308618
21. Desjardins P, Pilon AA, Hassell JA, Mes-Masson A. Polyomavirus large T-antigen binds the ‘pRb related’ protein p130 through sequences in conserved region 2. Virus Res. 1997;47 : 85–90 9037740
22. Pilon AA, Desjardins P, Hassell JA, Mes-Masson A. Functional Implications of Mutations within Polyomavirus Large T Antigen Rb-Binding Domain: Effects on pRb and p107 Binding In Vitro and Immortalization Activity in Vivo. J Virol. 1996;70 : 4457–65 8676470
23. Cho S, Tian Y, Benjamin TL. Binding of p300/CBP Co-activators by Polyoma Large T Antigen. J Biol Chem. 2001;276 : 33533–9 11438528
24. Goodman RH, Smolik S. CBP/p300 in cell growth, transformation, and development. Genes Dev. 2000 : 14 : 1553–77 10887150
25. Brodsky JL, Pipas JM. Polyomavirus T Antigens: Molecular Chaperones for Multiprotein Complexes. J Virol. 1998;72 : 5329–34 9620985
26. Sheng Q, Love TM, Schaffhausen B. J Domain-Independent Regulation of the Rb Family by Polyomavirus Large T Antigen. J Virol. 2000;74 : 5280–90 10799605
27. Schaffhausen BS, Roberts TM. Lessons from polyoma middle T antigen on signaling and transformation: A DNA tumor virus contribution to the war on cancer. Virology. 2009;384 : 304–16 doi: 10.1016/j.virol.2008.09.042 19022468
28. Carmichael GG, Schaffhausen BS, Dorsky DI, Oliver DB, Benjamin TL. Carboxy terminus of polyoma middle-sized tumor antigen is required for attachment to membranes, associated protein kinase activities, and cell transformation. Proc Natl Acad Sci USA. 1982;79 : 3579–83 6179082
29. Pallas DC, Shahrik LK, Martin BL, Jaspers S, Miller TB, Brautigan DL, Roberts TM. Polyoma Small and Middle T Antigens and SV40 Small t Antigen Form Stable Complexes with Protein Phosphatase 2A. Cell. 1990;60 : 167–176 2153055
30. Walter G, Ruediger R, Slaughter C, Mumby M. Association of protein phosphatase 2A with polyoma virus medium tumor antigen. Proc Natl Acad Sci USA. 1990;87 : 2521–25 2157202
31. Courtneidge SA, Smith AE. Polyoma virus transforming protein associates with the product of the c-src cellular gene. Nature. 1983;303 : 435–39 6304524
32. Kornbluth S, Cheng SH, Markland W, Fukui Y, Hanafusa H. Association of p62c-yes with Polyomavirus Middle T-Antigen Mutants Correlates with Transforming Ability. J Virol. 1990;64 : 1584–9 1690822
33. Horak ID, Kawakami T, Gregory F, Robbins KC, Bolen JB. Association of p60fyn with Middle Tumor Antigen in Murine Polyomavirus-Transformed Rat Cells. J Virol. 1989;63 : 2343–7 2539523
34. Carmichael G, Schaffhausen BS, Mandel G, Liang TJ, Benjamin TL. Transformation by polyoma virus is drastically reduced by substitution of phenylalanine for tyrosine at residue 315 of middle-sized tumor antigen. Proc Natl Acad Sci USA. 1984;81 : 679–83 6322163
35. Harvey R, Oostra BA, Belsham GJ, Gillet P, Smith AE. An Antibody to a Synthetic Peptide Recognizes Polyomavirus Middle-T Antigen and Reveals Multiple In Vitro Tyrosine Phosphorylation Sites. Mol Cell Biol. 1984;4(7):1334–42 6095063
36. Hunter T, Hutchinson M, Eckhart W. Polyoma middle-sized T antigen can be phosphorylated on tyrosine at multiple sites in vitro. EMBO J. 1984;3 : 73–9 6200324
37. Schaffhausen B, Benjamin TL. Comparison of Phosphorylation of Two Polyoma Virus Middle T Antigens In Vivo and In Vitro. J Virol. 1981;40 : 184–96 6169848
38. Campbell KS, Ogris E, Burke B, Su W, Auger KR, Druker BJ, Schaffhausen BS, Roberts TM, Pallas DC. Polyoma middle tumor antigen interacts with SHC protein via the NPTY (Asn-Pro-Thr-Tyr) motif in middle tumor antigen. Proc Natl Acad Sci USA. 1994;91 : 6344–8 8022784
39. Su W, Liu W, Schaffhausen BS, Roberts TM. Association of Polyomavirus Middle Tumor Antigen with Phospholipase C-gamma1. J Biol Chem. 1995;270 : 12331–4 7759472
40. Talmage DA, Freund R, Young AT, Dahl J, Dawe CJ, Benjamin TL. Phosphorylation of Middle T by pp60c-src: A Switch for Binding of Phosphatidylinositol 3-Kinase and Optimal Tumorigenesis. Cell. 1989;59 : 55–65 2551507
41. Andrabi S, Hwang JH, Choe JK, Roberts TM, Schaffhausen BS. Comparisons between Murine Polyomavirus and Simian Virus 40 Show Significant Differences in Small T Antigen Function. J Virol. 2011;85 : 10649–58 doi: 10.1128/JVI.05034-11 21835797
42. Schuchner S, Wintersberger E. Binding of Polyomavirus Small T Antigen to Protein Phosphatase 2A Is Required for Elimination of p27 and Support of S-Phase Induction in Concert with Large T Antigen. J Virol, 1999;73 : 9266–73 10516035
43. Rodriguez-Viciana P, Collins C, Fried M. Polyoma and SV40 proteins differentially regulate PP2A to activate distinct cellular signaling pathways involved in growth control. Proc Natl Acad Sci USA. 2006;103 : 19290–5 17158797
44. Qian W, Wiman KG. Polyoma Virus Middle T and Small t Antigens Cooperate to Antagonize p53-induced Cell Cycle Arrest and Apoptosis. Cell Growth Differ. 2000;11 : 31–9 10672901
45. Cahill KB, Roome AJ, Carmichael GG. Replication-Dependent Transactivation of the Polyomavirus Late Promoter. J Virol. 1990;6 : 992–1001
46. Gu R, Zhang Z, DeCerbo JN, Carmichael GG. Gene regulation by sense-antisense overlap of polyadenylation signals. RNA. 2009;15 : 1154–63 doi: 10.1261/rna.1608909 19390116
47. Acheson NH, Buetti E, Scherrer K, Weil R. Transcription of the Polyoma Virus Genome: Synthesis and Cleavage of Giant Late Polyoma-Specific RNA. Proc Natl Acad Sci USA. 1971;68 : 2231–5 4332250
48. Aloni Y, Locker H. Symmetrical in Vivo Transcription of Polyoma DNA and the Separation of Self-Complementary Viral and Cell RNA. Virology. 1973;54 : 495–505 4353523
49. Adami GR, Marlor CW, Barrett NL, Carmichael GG. Leader-to-Leader Splicing Is Required for Efficient Production and Accumulation of Polyomavirus Late mRNAs. J Virol. 1989;63 : 85–93 2535755
50. Heiser WC, Eckhart W. Polyoma Virus Early and Late mRNAs in Productively Infected Mouse 3T6 Cells. J Virol. 1982;44 : 175–188 6292484
51. Kumar M, Carmichael GG. Nuclear antisense RNA induces extensive adenosine modifications and nuclear retention of target transcripts. Proc Natl Acad Sci USA. 1997;94 : 3542–7 9108012
52. Bass BL. RNA Editing by Adenosine Deaminases that Act on RNA. Annu Rev Biochem. 2002;71 : 817–46 12045112
53. Turler H, Salomon C. Small and Middle T Antigens Contribute to Lytic and Abortive Polyomavirus Infection. J Virol. 1985;53 : 579–86 2578576
54. Kamen R, Shure H. Topography of Polyoma Virus Messenger RNA Molecules. Cell. 1976;7 : 361–71 181143
55. Acheson NH, Mieville F. Extent of Transcription of the E Strand of Polyoma Virus DNA During the Early Phase of Productive Infection. J Virol. 1978;28 : 885–94 215784
56. Turler H, Salomon C, Allet B, Weil R. Mapping of the three species of polyoma mRNA. Proc Natl Acad Sci USA, 1976;73 : 1480–84 179087
57. Flavell AJ, Kamen R. Strand-Specific Transcription of Polyoma Virus DNA Late During Productive Infection. J Mol Biol. 1977;115 : 237–42 201760
58. Kamen R, Jat P, Treisman R, Favaloro J. 5’ Termini of Polyoma Virus Early Region Transcripts Synthesized in vivo by Wild-type Virus and Viable Deletion Mutants. J Mol Biol. 1982;159 : 189–224 6292432
59. Fenton RG, Basilico C. Changes in the topography of early region transcription during polyoma virus lytic infection. Proc Natl Acad Sci. 1982;79 : 7142–6 6296819
60. Ghosh PK, Lebowitz P. SImian Virus 40 early mRNA’s contain multiple 5’ termini upstream and downstream from a Hogness-Goldberg sequence; a shift in 5’ termini during the lytic cycle is mediated by large T antigen. J. Virol. 1981;40 : 224–40 6270376
61. Khalili K, Feigenbaum L, Khoury G. Evidence for a shift in 5’-termini of early viral RNA during the lytic cycle of JC Virus. Virology 1987;158 : 469–72 3035794
62. Riley MI, Yoo W, Mda N, Folk WR. Tiny T Antigen: an Autonomous Polyomavirus T Antigen Amino-Terminal Domain. J Virol, 1997;71 : 6068–74 9223500
63. Zhu S, Xiang J, Chen T, Chen L, Yang L. Prediction of constitutive A-to-I editing sites from human transcriptomes in the absence of genomic sequences. BMC Genomics, 2013;14 : 206 doi: 10.1186/1471-2164-14-206 23537002
64. Porath HT, Carmi S, Levanon EY. A genome-wide map of hyper-edited RNA reveals numerous new sites. Nat Commun. 2014;5 : 4726 doi: 10.1038/ncomms5726 25158696
65. van Holde K. E. (1988) Chromatin. Springer-Verlag, New York
66. Paschen SA, Rothbauer U, Kaldi K, Bauer MF, Neupert W, Brunner M. The role of the TIM8-13 complex in the import of Tim23 into mitochondria. EMBO J. 2000;19 : 6392–400 11101512
67. Chiu R, Angel P, Karin M. Jun-B Differs in Its Biological Properties from, and Is a Negative Regulator of, c-Jun. Cell. 1989;59 : 979–86 2513128
68. Schutte J, Viallet J, Nau M, Segal S, Fedorko J, Minna J. jun-B Inhibits and c-fos Stimulates the Transforming and Trans-Activating Activities of c-jun. Cell. 1989;59 : 987–97 2513129
69. Shaulian E, Karin M. AP-1 as a regulator of cell life and death. Nat Cell Biol. 2002;4:E131–6 11988758
70. Vuorio E, Crombrugghe B. The Family of Collagen Genes. Annu Rev Biochem. 1990 : 59 : 837–72 2197991
71. Ntambi M. Regulation of steroyl-CoA desaturase by polyunsaturated fatty acids and cholesterol. J Lipid Res. 1999;40 : 1549–58 10484602
72. Muir K, Hazim A, He Y, Peyressatre M, Kim DY, Song X, Beretta L. Proteomic and lipidomic signatures of lipid metabolism in NASH-associated hepatocellular carcinoma. Cancer Res. 2013;73 : 4722–31 doi: 10.1158/0008-5472.CAN-12-3797 23749645
73. Laux T, Fukami K, Thelen M, Golub T, Frey D, Caroni P. GAP43, MARCKS, and CAP23 modulate PI(4,5)P(2) at plasmalemmel rafts, and regulate cell cortex actin dynamics through a common mechanism. J Cell Biol. 2000;149 : 1455–72 10871285
74. Brooks G, Brooks SF, Goss MW. MARCKS functions as a novel growth suppressor in cells of melanocyte origin. Carcinogenesis. 1996;17 : 683–9 8625478
75. Bickerboller M, Tagscherer KE, Kloor M, Jansen L, Chang-Claude J, Brenner H, et al. Functional characterization of the tumor-suppressor MARCKS in colorectal cancer and its association with survival. Oncogene. 2015;34 : 1150–9 doi: 10.1038/onc.2014.40 24662837
76. Joseph CK, Qureshi SA, Wallace DJ, Foster DA. MARCKS protein is transcriptionally down-regulated in v-Src-transformed BALB/c 3T3 cells. J Biol Chem. 1992;267 : 1327–30 1370466
77. Tycowski KT, Shu MD, Steitz JA. Requirement for intron-encoded U22 small nucleolar RNA in 18S ribosomal RNA maturation. Science. 1994;266 : 1558–61 7985025
78. Ji P, Diedrichs S, Wang W, Boing S, Metzger R, Schneider PM, et al. MALAT-1, a novel noncoding RNA, and thymosin beta4 predict metastasis and survival in early-stage non-small cell lung cancer. Oncogene. 2003;22 : 8031–41 12970751
79. Kielbasa SM, Klein H, Roider HG, Vingron M, Bluthgen N. TransFind-predicting transcriptional regulators for gene sets. Nucleic Acids Res, 2010;38:W275–80 doi: 10.1093/nar/gkq438 20511592
80. Bracken AP, Ciro M, Cocito A, Helin K. E2F target genes: unraveling the biology. TRENDS Biochem Sci, 2004;29 : 409–417 15362224
81. Aggarwal B. Nuclear factor-kB: The enemy within. Cancer Cell. 2004;6 : 203–208 15380510
82. Yoo W, Martin ME, Folk WR. PEA1 and PEA3 Enhancer Elements Are Primary Components of the Polyomavirus Late Transcription Initiator Element. J Virol. 1991;65 : 5391–5400 1654447
83. Sullivan CS, Grundhoff AT, Tevethia S, Pipas JT, Ganem D. SV40-encoded microRNAs regulate viral gene expression and reduce susceptibility to cytotoxic T cells. Nature. 2005;435 : 682–6 15931223
84. Sullivan CS, Sung CK, Pack CD, Grundhoff A, Lukacher AE, Benjamin TL, Ganem D. Murine Polyomavirus encodes a microRNA that cleaves early RNA transcripts but is not essential for experimental infection. Virology. 2009;387 : 157–67 doi: 10.1016/j.virol.2009.02.017 19272626
85. Klucky B, Koch B, Radolf M,Steinlein P, Wintersberger E. Polyomavirus tumorantigens have a profound effect on gene expression in mouse fibroblasts. Oncogene 2004;23 : 4707–21 15122341
86. Artandi SE, DePinho R. Telomeres and telomerase in cancer. Carcinogenesis. 2010;31 : 9–18 doi: 10.1093/carcin/bgp268 19887512
87. Lai LB, Vioque A, Kirsebom LA, Gopalan V. Unexpected diversity of RNase P, an ancient tRNA processing enzyme: challenges and prospects. FEBS Lett. 2010;584 : 287–96 doi: 10.1016/j.febslet.2009.11.048 19931535
Štítky
Hygiena a epidemiologie Infekční lékařství LaboratořČlánek vyšel v časopise
PLOS Pathogens
2015 Číslo 9
- Parazitičtí červi v terapii Crohnovy choroby a dalších zánětlivých autoimunitních onemocnění
- Vakcíny proti klíšťové encefalitidě
- Kdy je nejlepší očkovat
- Možné vedlejší účinky očkování
- Imunogenita vakcín
Nejčtenější v tomto čísle
- Epicellular Apicomplexans: Parasites “On the Way In”
- Fiat Luc: Bioluminescence Imaging Reveals In Vivo Viral Replication Dynamics
- Knocking on Closed Doors: Host Interferons Dynamically Regulate Blood-Brain Barrier Function during Viral Infections of the Central Nervous System
- A KSHV microRNA Directly Targets G Protein-Coupled Receptor Kinase 2 to Promote the Migration and Invasion of Endothelial Cells by Inducing CXCR2 and Activating AKT Signaling
Zvyšte si kvalifikaci online z pohodlí domova
Mazová zátka a její řešení
nový kurzVšechny kurzy