
Sequence-Based Analysis Uncovers an Abundance of Non-Coding RNA in the Total Transcriptome of
RNA sequencing provides a new perspective on the genome of Mycobacterium tuberculosis by revealing an extensive presence of non-coding RNA, including long 5’ and 3’ untranslated regions, antisense transcripts, and intergenic small RNA (sRNA) molecules. More than a quarter of all sequence reads mapping outside of ribosomal RNA genes represent non-coding RNA, and the density of reads mapping to intergenic regions was more than two-fold higher than that mapping to annotated coding sequences. Selected sRNAs were found at increased abundance in stationary phase cultures and accumulated to remarkably high levels in the lungs of chronically infected mice, indicating a potential contribution to pathogenesis. The ability of tubercle bacilli to adapt to changing environments within the host is critical to their ability to cause disease and to persist during drug treatment; it is likely that novel post-transcriptional regulatory networks will play an important role in these adaptive responses.
Published in the journal:
. PLoS Pathog 7(11): e32767. doi:10.1371/journal.ppat.1002342
Category:
Research Article
doi:
https://doi.org/10.1371/journal.ppat.1002342
Summary
RNA sequencing provides a new perspective on the genome of Mycobacterium tuberculosis by revealing an extensive presence of non-coding RNA, including long 5’ and 3’ untranslated regions, antisense transcripts, and intergenic small RNA (sRNA) molecules. More than a quarter of all sequence reads mapping outside of ribosomal RNA genes represent non-coding RNA, and the density of reads mapping to intergenic regions was more than two-fold higher than that mapping to annotated coding sequences. Selected sRNAs were found at increased abundance in stationary phase cultures and accumulated to remarkably high levels in the lungs of chronically infected mice, indicating a potential contribution to pathogenesis. The ability of tubercle bacilli to adapt to changing environments within the host is critical to their ability to cause disease and to persist during drug treatment; it is likely that novel post-transcriptional regulatory networks will play an important role in these adaptive responses.
Introduction
Mycobacterium tuberculosis presents a major threat to global health, causing around 10 million new cases of tuberculosis and 2 million deaths every year [1]. The bacteria typically establish a prolonged asymptomatic infection that progresses to active disease in only a minority of individuals. During the course of infection, M. tuberculosis has to adapt to survival in a range of different microenvironments, combining persistence in a non-replicating state with periods of active cell division [2]. Transcriptional regulation in response to environmental change has been extensively analyzed in M. tuberculosis by RT-PCR and hybridization to microarrays representing the complete set of predicted coding sequences (CDSs) [3], and several regulons induced under physiologically relevant growth conditions have been characterized [4]–[9]. Thirteen sigma factors, eleven two-component regulators, eleven serine-threonine protein kinases and more than one hundred predicted transcription factors have been identified in the genome of M. tuberculosis [10].
Less attention has been given to the potential role in M. tuberculosis of regulatory processes that occur subsequent to the initiation of transcription. These are often mediated by RNA and involve alterations in the efficiency of transcription, translation and stability of messenger RNAs (reviewed in [11]–[13]). There are two broad categories of non-coding regulatory RNA [11]–[13]. The first is based on cis-acting regulatory elements that are present on the mRNA transcript, generally as a 5’ untranslated region (UTR). 5’ UTRs can regulate gene expression by forming secondary structural features that enhance or inhibit transcription or translation of their cognate mRNA. Their structural conformation is often determined by interaction with particular protein, tRNA or small molecule ligands. 5’ UTRs that respond to small molecules are referred to as riboswitches [14]. The second category of RNA regulators is small RNA molecules (sRNAs) that bind in trans to their mRNA target. These include antisense RNAs that are transcribed from the DNA strand opposite to a CDS, inhibiting translation and promoting degradation by base-pairing with the corresponding mRNA transcript [13]. A second class of sRNAs are transcribed from a separate location on the genome – typically an intergenic region (IGR), though attenuated 5’ UTR transcripts can also act as sRNAs [15] – and again influence translation and degradation of mRNAs by a more limited degree of base pairing. These “trans-encoded” sRNAs are functionally analogous to microRNAs in eukaryotic cells [16].
RNA regulators are frequently implicated in adaptive responses of bacteria to environmental change and may therefore be expected to play a role in the pathogenesis of M. tuberculosis. sRNAs have been shown to regulate expression of virulence determinants in a number of bacterial pathogens, located in some cases within defined pathogenicity islands and carried specifically by pathogenic strains [17]–[20] (reviewed in [21]). Initial studies have described the occurrence of sRNAs in M. tuberculosis though the extent of the regulatory RNA network in these bacteria, and its relevance to gene expression during infection, are unknown [22], [23].
Knowledge of regulatory networks controlled by non-coding RNA in bacteria has undergone a rapid expansion over the last decade, as a result of transcriptional profiling approaches based on high-density tiling arrays and deep sequencing of whole genome cDNAs (RNA-seq). Sequence-based transcriptomes have been described for a range of bacteria, including several human pathogens [17], [24]–[29]. The aim of the present study was to apply an analogous approach to characterize the transcriptome of M. tuberculosis, with a particular focus on identification of the nature and extent of non-coding RNA.
Results
The total transcriptome of M. tuberculosis
RNA extracted from three independent exponential phase cultures of M. tuberculosis was used to generate cDNA preparations that were then analyzed by Illumina-based sequencing. Two of the samples were analyzed as technical replicates in separate sequencing runs, generating a set of five total transcriptome profiles (Table 1). After removal of reads mapping to rRNA molecules an average of just over 3 million reads, corresponding to 8% of total, mapped to annotated protein CDSs in the sense orientation. A further 0.5 million reads mapped to CDSs in the antisense orientation, and 0.7 million reads mapped to IGRs. IGRs make up less than 10% of the genome, and thus the density of reads mapping outside of CDSs was more than two-fold higher than that seen for predicted coding transcripts. Calculation of pairwise correlation coefficients demonstrated a high degree of reproducibility between samples (r≥0.93 Table S1), and the total transcriptome data are recorded as an average of the five samples in Table S2 (sense and antisense reads for each CDS) and Table S3 (reads mapping to IGRs of at least 50 nucleotides). To facilitate comparison of expression levels of different genes, data for CDSs are also presented in the form of reads per kilobase per million reads (RPKM).

cDNA was also sequenced from two stationary phase cultures of M. tuberculosis. The correlation coefficient between the samples (r = 0.82) indicated a lower level of reproducibility than that seen in exponential phase. This was driven mainly by a lower amount of mRNA, with only 2% of stationary phase reads mapping to CDSs as compared to 8% in exponential phase as well as a dramatic increase in the level of intergenic reads (Table 2). However, the overall pattern of relative gene expression was very similar between the replicate samples, and data are expressed as average values in Tables S2 and S3.

The coding transcriptome
Exponential phase
To define the coding transcriptome, we selected CDSs with RPKM ≥5 in either sense or antisense direction. This included 3,136 CDSs during exponential culture (Table S2), representing 78.4% of the annotated genome. Table 3 shows the fifty CDSs with highest RPKM scores. To test for an association between expression level and gene function, we selected the 10% of CDSs with highest RPKM and compared the frequency with which different functional classes were represented in this selected set against the corresponding frequency in the total genome [10] (Figure 1A). Analysis by functional class shows a profile consistent with that expected for actively growing bacteria, with an over-representation of mRNA transcripts encoding proteins involved in the generation of energy and macromolecules (classes II.A, I.B, I.H, P−value<0.001 for all cases). Under-represented categories included class I.A (degradation of small molecules; P−value = 0.009), insertion sequences (IV.B; P−value<0.001) and conserved hypotheticals (V; P−value not significant). This pattern is also reflected in the list of highly abundant transcripts in Table 3, which also includes representatives of the ESX Type VII secretion systems [30]–[32], the extensive family of predicted proteins of unknown function sharing common N-terminal proline-glutamate (PE) and proline-proline-glutamate (PPE) motifs [10], and Type II toxin and antitoxin (TA) proteins [33].


Stationary phase
The stationary phase samples displayed a profile very different to that observed in exponential cultures, with only 421 CDSs (11% of the genome) expressed at a level of RPKM ≥5. The coding transcriptome was dominated by genes belonging to the DosR regulon that has been extensively characterized in the context of the adaptive response of M. tuberculosis to a hypoxic environment [5], [8] (reviewed in [34]), with 23 of the 50 most highly-expressed genes linked to DosR (Table 4). For all genes with RPKM ≥5 in either direction, 383 were shared between the two growth phases, 2,753 genes were specifically expressed in exponential phase and 38 were specific for stationary phase.

The non-coding transcriptome
Antisense transcripts
Antisense reads mapped widely across the genome. For the 3,136 genes with RPKM ≥5 in exponential culture, the median level of antisense transcription was 13% of that in the sense orientation, though a subset of 435 genes had an antisense to sense RPKM ratio ≥0.5, and 168 genes had a corresponding ratio ≥2 (Table S2). Amongst the genes with antisense:sense ≥0.5, the representation of functional classes was the inverse of the pattern observed for the coding transcriptome, with enrichment for conserved hypothetical and unknown proteins (classes V and VI, P−value = 0.0027 and 0) and members of the PE/PPE family (class IV.C, P−value not significant), and under-representation of genes involved in macromolecule biosynthesis and energy generation (classes II.A, I.B and II.B, P−value = 0.022, 0.022 and 0.002) (Figure 1B).
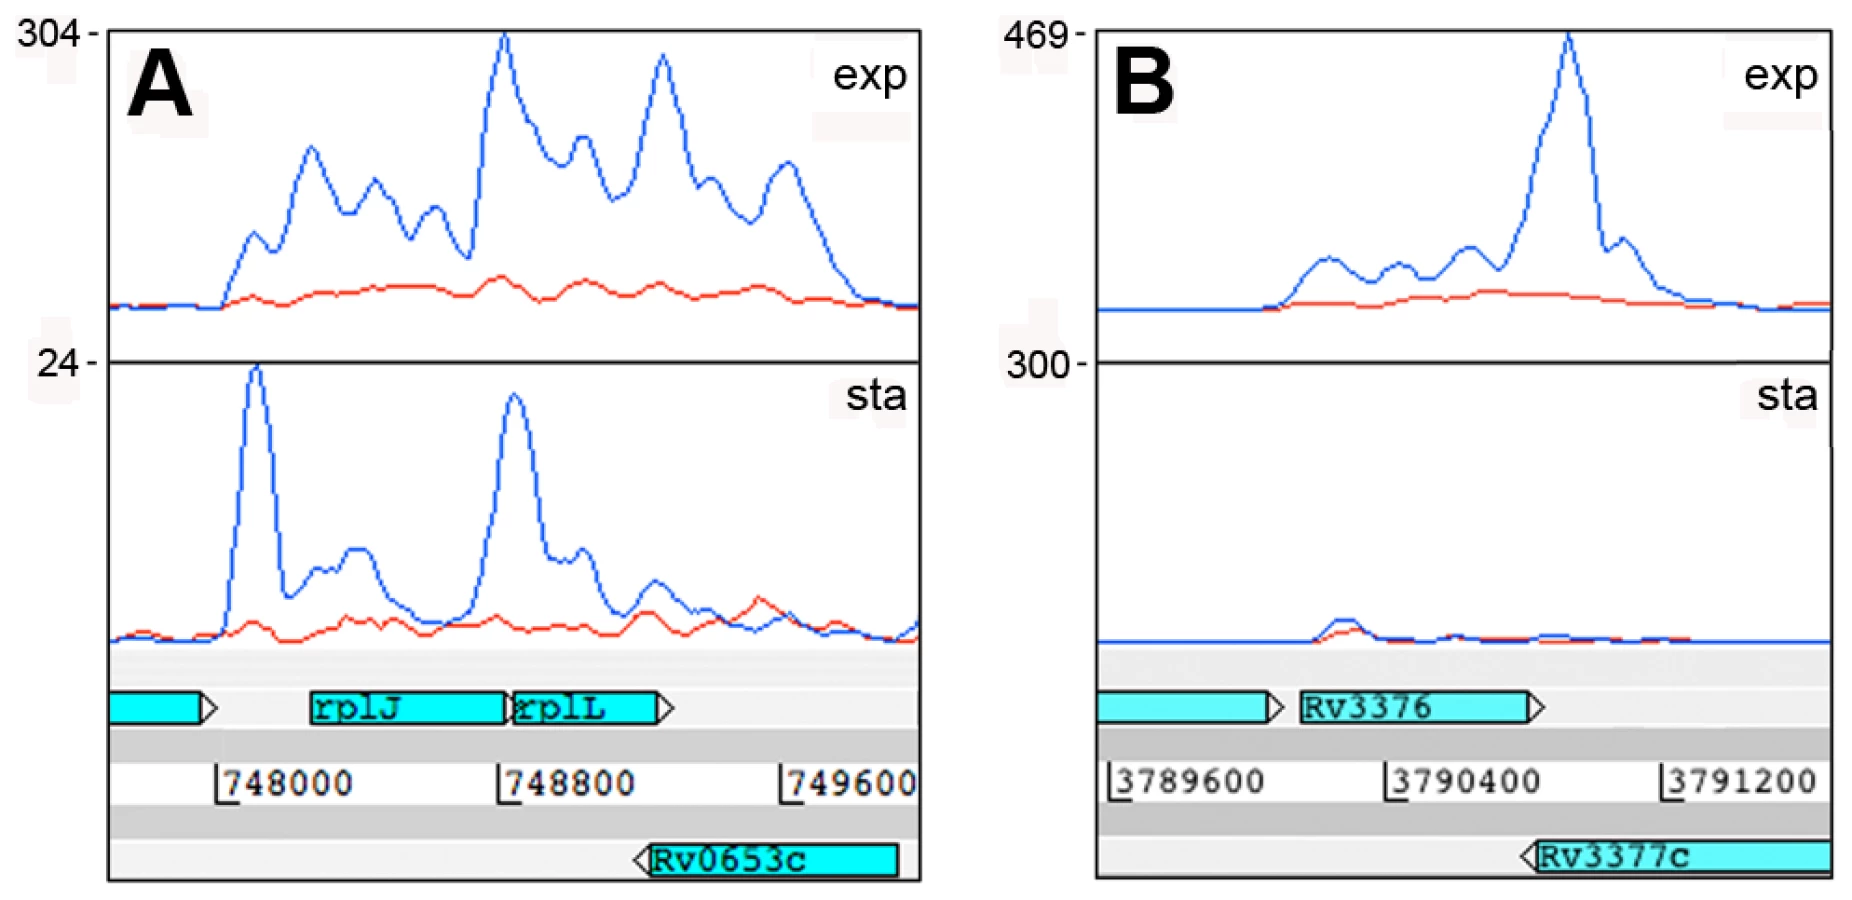
To determine the origin of the antisense transcripts, we examined 150 CDSs that were mapped by 500 or more antisense reads, accounting for 27% of the total antisense transcriptome. For 39 of the CDSs, the antisense signal was distributed throughout the length of a highly expressed gene and represented less than 20% of the sense signal. This profile suggests non-specific antisense background that may include spurious second strand synthesis during reverse transcription. For two thirds of the remaining genes with abundant antisense, visual inspection of transcriptional profiles using the Artemis genome browser [35] indicated that antisense transcripts were associated with the 3’ UTR of an oppositely oriented adjacent or overlapping gene (Figure 2). The most abundant 3’ UTR-derived antisense transcripts are listed in Table 5. The M. tuberculosis genome contains 502 convergent 3’-3’ gene pairs with intergenic separation of 100 nucleotides or less. The functional class representation amongst these genes showed no significant difference from the overall genome, though it includes a disproportionate number of toxin genes (42 from a total of 88). The 3’-3’ subset is significantly enriched in antisense transcripts – including 311 of the 435 genes with antisense:sense ratio ≥0.5 (P−value<0.01) – with a significant over-representation of cell envelope-associated class II.C amongst the genes covered by antisense (Fisher's exact one side test, P−value = 0.034)(Figure S1). While 3’ UTRs make a significant contribution to the antisense transcriptome, we found only one instance in which a 5’ UTR generated a visible antisense overlap. In this case the 5’ UTR of the infC gene (Rv1641) overlapped with the 5’ end of the divergently oriented lysX.
A second category of antisense transcripts arose within genes. These ranged in length from short sequences covering the middle or either end of a CDS to longer sequences covering one or more genes (Figure 3 and Table 6). For four of the genes in Table 6, transcription was detected almost exclusively in the antisense orientation. Some of these may represent mis-annotations; Rv2081c is annotated as encoding a hypothetical protein, for example, though the antisense transcript can be matched to a potential open reading frame on the opposite strand. The antisense transcript generated from the 3’ end of Rv2816c, encoding the CRISPR (Clustered Regularly Interspaced Short Palindromic Repeats)-associated protein (cas2) [36], [37], extends over more than a kilobase, covering most of the adjacent Rv2817c cas1 gene. Rv1374c is annotated as encoding a hypothetical protein, but Northern blot analysis of the antisense transcript (Figure 3F) and absence of an appropriately oriented open reading frame, suggests that this may represent an intergenic small RNA; this also applies to Rv1734c (see below). It is likely that the antisense transcript mapped to Rv1805c corresponds to an M-box riboswitch predicted in the 5’ UTR of Rv1806 [38] (discussed below).


Intergenic transcripts
To determine the origin of transcripts mapping to IGRs we examined the subset of IGRs longer than 100 nucleotides that were mapped by at least 500 reads. This included 141 IGRs, accounting for 56% of the total intergenic reads in exponential phase (after removal of reads mapping to rrn, ssr and rnpB). In stationary phase only 24 of the IGRs displayed 500 reads or more, and half of these were shared between exponential and stationary phase (Table S3). Visual inspection of Artemis traces identified 5’ UTRs and sRNA candidates as the dominant sources of intergenic reads, with 3’ UTRs, tRNAs and spill-over from antisense transcripts making smaller contributions (Table 7). Contiguous transcriptional activity was observed across the entire IGR in some cases, precluding a clear distinction between the potential contribution of 5’ and 3’ UTRs; we have systematically assigned these as 5’ UTRs in the present analysis.

The representation of functional groups amongst the 82 genes with a prominent 5’ UTR broadly parallels that seen for the overall coding transcriptome, with a marked enrichment of class II.A genes involved in macromolecule synthesis (Figure 1C). The most abundant intergenic 5’ UTRs longer than 150 nucleotides are ranked by RPKM in Table 8, and include a high proportion of genes involved in transcription and translation. Figure 4 illustrates the 5’ UTRs associated with genes encoding the heat shock chaperones GroES and GroEL2, showing a biphasic profile in which a subset of transcripts include the CIRCE elements implicated in transcriptional regulation by HrcA [39].


Long 5’ UTRs in bacteria are characteristically associated with regions of secondary structure that regulate mRNA stability and translation, often by interaction with RNA, proteins or small molecule ligands [13]. Alignment of the long, highly-expressed 5’ UTRs of infA and infC using the WAR webserver [40] revealed regions of extensive homology suggesting that these genes may share some post-transcriptional regulation in M. tuberculosis (Figure 5A+B). Similarly, alignment of 5’ UTRs of rpoA and rpsM, which are co-transcribed in E. coli [41], revealed extensive sequence homology, consistent with a role in coordinate regulation (Figure S2). The rpoB 5’ UTR remained prominent in the stationary phase transcriptome, in contrast to the much reduced signal from the coding gene (Figure 5D+E), suggesting a potential involvement in some form of transcriptional attenuation.

Several riboswitches have been identified in M. tuberculosis by sequence homology to other organisms, and a cobalamin riboswitch has been experimentally verified (Table S4) [38], [42], [43]. Riboswitches are RNA sequences that have the ability to adopt a ligand-dependent secondary structure that has the effect of attenuating transcription or translation of downstream sequences. Riboswitch-mediated attenuation generates truncated 5’ UTR transcripts; a pattern seen for several of the genes listed in Table 8. Rv1535 and Rv1536 are predicted to harbour riboswitches in their 5’ UTRs; a metal ion-dependent M-box in the case of Rv1535 [38] and a T-box responsive to uncharged tRNAs in the case of tRNA synthase-encoding Rv1536 [42]. Analysis of the Rv1535/6 locus shows accumulation of short upstream transcripts consistent with a riboswitch in the “off” position (Figure 6). High 5’ UTR:CDS ratios suggest further candidate riboswitches amongst the genes listed in Table 8.

IGR-associated 3’ UTRs were similar to the antisense 3’ UTRs discussed above, including “tail” and “peak” profiles (illustrated in Figure 3) and sometimes extending across the IGR into the next CDS. 3’ UTRs ranged in length from 117 to 676 nucleotides with a median of 320 nucleotides. Table 9 lists the most abundant intergenic 3’ UTRs ranked by RPKM. Intergenic sRNAs. The Illumina technology we used involved a size fractionation step, selecting 200–250 nucleotide cDNA fragments for sequencing. To include short transcripts we included an RNA ligation step before cDNA synthesis (see Materials and Methods for details). Transcription profiles for 15 of the abundantly expressed IGRs in exponential phase were consistent with their identification as intergenic sRNAs, with short transcripts unlinked to adjacent CDSs and lacking an obvious open reading frame. These are listed in Table 10, together with selected additional examples of lower abundance sRNAs identified in other screens. We have given each of these a designation of “MTS”, for M. tuberculosis sRNA, with a number corresponding to a previously described IGR annotation (see Table 10 legend). We have characterized three sRNAs in more detail. Northern blot confirmation of additional examples is shown in Figure S3.


Second only to the signals from rRNA, the sRNA candidate encoded in IGR 2823, between Rv3661 and Rv3662c, is the most abundant transcript in exponentially growing M. tuberculosis. MTS2823 increased a further ten-fold in stationary phase cultures, reaching a level of 50,000 RPKM, approaching that of 23S and 16S rRNA (150–200,000 RPKM). Northern blot analysis shows MTS2823 as a major 300-nucleotide transcript in exponential and stationary phase cultures, with an additional 250-nucleotide transcript appearing during stationary phase (Figure 7A+B). The 5’ end of MTS2823 was mapped to position 4,100,669 with a putative terminator 319 nucleotides further downstream consistent with the transcript size observed on the Northern blot. We were unable to match the region upstream of this 5’ end with known promoter consensus sequences. Closely related sRNAs are present in genome sequences of a subset of actinomycetes including a range of mycobacteria and rhodococci, Nocardia farcinica, Gordonia bronchialis and Tsukamurella paurometabola.

MTS0997 is encoded in the IGR between Rv1264 and Rv1265, in the reverse orientation to both of the flanking CDSs. It is prominent in the exponential transcriptome and further increased in the stationary phase (Figure 7C+D). Rv1265 is a hypothetical protein induced during macrophage infection [44], while Rv1264 encodes an adenylate cyclase. The 5’ end of the MTS0997 transcript was mapped by RACE, and putative −35 and −10 promoter elements were identified. Mutations in the predicted −10 hexamer eliminated expression of a β-galactosidase reporter in Mycobacterium smegmatis as well as in M. tuberculosis, seen as loss of blue colour on plates containing X-Gal (data not shown). A putative binding site for the cAMP receptor protein (CRP) was identified 107 base pairs (10 helical turns) upstream of the predicted transcription start site (Figure S4A). Expression of MTS0997 in a CRP knockout strain (provided by Roger Buxton [45]) was almost abolished in exponential phase while slightly reduced in stationary phase, suggesting some dependence on CRP regulation in both growth phases (Figure 7).
MTS1338 is transcribed in the opposite orientation to a partially overlapping open reading frame annotated as encoding Rv1734c, a conserved hypothetical protein included in the DosR regulon [5]. We were unable to detect any expression of the predicted Rv1734c CDS in either exponential or stationary phase. There was very little expression of MTS1338 in the exponential phase, but it is amongst the most abundant transcripts in the stationary phase transcriptome (Figure 7E+F). The major transcription start site was mapped to position 1,960,667, with a second minor start site further upstream at 1,960,601; three DosR binding sites are present between the main start of MTS1388 and the adjacent DosR-regulated Rv1733c [46] (Figure S4B). In a DosR knockout strain (provided by David Sherman [5]) stationary phase expression of MTS1338 was markedly reduced, though not completely eliminated (Figure 7F).
Functional characterization of MTS2823
To explore the functional role of the dominant stationary phase sRNA, MTS2823 we engineered its over-expression in exponential phase cultures of M. tuberculosis H37Rv under the control of a strong rRNA promoter. Over-expression of MTS2823 had a slight but clear effect on the growth rate (Figure 8A). However, microarray analysis revealed a striking overall down-regulation of multiple genes with 301 genes showing ≥2.5-fold change (P−value ≤0.05) (Figure S6, Table S5). Apart from MTS2823 itself (represented by microarray probe MtCDC1551-3762), only two genes were up-regulated; Rv2035 encoding a potential activator of HspG (up 3.2-fold) and Rv3229c, encoding a fatty acyl desaturase DesA3 (up 3.1-fold).

The down-regulated subset showed a significant over-representation of genes involved in energy metabolism (class I.B; P−value<0.01 after FDR correction) as well as a trend towards over-representation of genes involved in macromolecular synthesis (class II.A) and insertion elements (Figure S5). Rv1131 (prpC/gltA1) encoding methyl citrate synthase, showed the greatest change of expression, with a 15-fold down-regulation. Related genes involved in the citrate synthase cycle, encoding methyl citrate dehydratase (Rv1130, prpD; down 7-fold) and an associated transcriptional regulator (Rv1129c, lrpG; down 5.6-fold), were similarly repressed. Analysis of associated partners identified in the STRING database [47] revealed down-regulation of an extended methyl citrate network (Figure 8B). Down-regulation of prpC in exponential phase cultures has previously been observed as a consequence of deletion of several sigma factors [48], [49]. sigE, sigB, sigG and sigA transcripts were all down-regulated in the MTS2823 over-expressing strain (Table S5). Five of the ten vapC toxin homologues were down-regulated ≥2.5-fold while none of their antitoxin partners were affected (Table S5). Quantitative RT-PCR (qRT-PCR) analysis of selected genes confirmed the pattern seen by microarray, over a more extended dynamic range (Table 11).

Accumulation of sRNAs during infection
The abundance of selected sRNAs in stationary phase cultures encouraged us to explore their expression in non-replicating M. tuberculosis during infection. Following aerosol infection in mice, M. tuberculosis undergoes a period of active replication before engagement of the adaptive immune response. Infection then persists for months with little or no change in bacterial load before mice die from cumulative lung damage. There is uncertainty as to whether the chronic phase of infection is associated with persistence of non-replicating bacteria, or a balance between bacterial replication and killing [50]–[52]. To assess expression of non-coding RNAs during the chronic stage of infection, we prepared mycobacterial RNA from lungs of mice and used qRT-PCR to measure selected sRNA and mRNA transcripts. Results were normalized to 16S rRNA.Consistent with RNA-seq and Northern blotting, qRT-PCR analysis confirmed the abundance of MTS2823 in exponential cultures with further increase in stationary phase, and the stationary phase induction of MTS0997 and MTS1338 (Figure 9). All three of the sRNAs were present at very high levels in chronically infected lung tissue; each accumulating to a level relative to 16S rRNA that was increased over and above that observed in stationary phase (Figure 9). By comparison, groES, a highly abundant mRNA in exponential cultures was markedly reduced in stationary phase, with an intermediate level in infected tissues suggesting the presence of replicating as well as non-replicating populations in line with the model suggested by Chao and Rubin [53] (Figure 9).

Discussion
Application of deep sequencing technologies to study the transcriptome of M. tuberculosis has uncovered an abundance of non-coding RNAs including cis-encoded regulatory elements, antisense transcripts and intergenic sRNAs. After removal of signals from ribosomal RNAs, the percentage of reads mapping in antisense orientation and to IGRs represents 28% of the total transcriptome in exponential phase M. tuberculosis. This is broadly similar to the 25% reported for Salmonella typhi and the 27% reported for Helicobacter pylori [24], [25], and contributes to a growing appreciation of the prominence of non-coding RNA in bacteria. Non-coding RNAs can regulate gene expression at a post-transcriptional level, providing a level of control intermediate between conventional transcriptional control and post-translational protein turnover, that is particularly useful in the rapid response to stress stimuli and may play an important role in generation of population heterogeneity [54]. Characterisation of non-coding RNA is likely to be important in understanding the complex biology underlying tuberculosis infection [2].
Sequence-based transcriptional profiling has advantages over hybridization-based microarray analysis in displaying a greater dynamic range with single-nucleotide resolution. The number of reads mapping to individual sequences provides a realistic assessment of relative transcript abundance, although the potential for variability in the efficiency of reverse transcription precludes precise quantitation. M. tuberculosis has only a single ribosomal RNA operon, but rRNA represents more than 80% of total RNA content, and we compared strategies to reduce this signal by physical removal of rRNA prior to sequencing or by computational removal of rRNA prior to sequencing or computational removal of rRNA reads after sequencing. The latter approach has the advantage of limiting potential RNA degradation or otherwise skewing of the RNA composition during processing [55]. This method still provided an average level of coverage of approximately one read per nucleotide (outside rrn) in exponential phase samples, and was used to generate the datasets for the present analysis. To enhance representation of shorter transcripts, we included an RNA ligation step. In spite of this, RPKM values for 5S rRNA (115 nucleotides) were between 5 - and 10-fold lower than those for 16S and 23S rRNA (1,537 and 3,138 nucleotides, respectively), and only a low number of reads mapped to tRNAs (<100 nucleotides), Therefore it is likely that sRNAs are under-represented, quantitatively and perhaps qualitatively, in our final transcriptome. Our classification of RNA as “non-coding” is contingent on current genome annotations, and we cannot exclude the possibility that some of these newly identified transcripts encode short peptides.
The coding transcriptome of M. tuberculosis reveals a profile consistent with expectations for exponentially growing bacteria, with genes involved in energy production and macromolecule biosynthesis significantly over-represented in the transcriptome as compared to the overall genome. M. tuberculosis-specific features include abundant representation of transcripts encoding cargo proteins exported by Type VII secretion systems [30] with genes encoding ESX-1-exported proteins ESAT6, CFP10, EspC and EspD amongst the top fifty transcripts. Transcript abundance is a feature of many, though not all of the ESX export proteins and, while bearing in mind potential changes in transcriptional regulation during infection, this may contribute to their differential immunogenicity [56]. Transcripts encoding several TA pairs are also highly abundant. The genome of M. tuberculosis is remarkably rich in Type II TA systems believed to modulate gene expression through ribonuclease activity [33], but their role in mycobacterial physiology and pathogenesis remains unclear. The stationary phase transcriptome is dominated by an abundance of genes induced as part of the DosR regulon that has been extensively characterized in response to a hypoxic environment [5], [8]. We had not set out to induce hypoxic conditions and we were surprised by the strength of the DosR signal. Enhanced regular aeration of cultures resulted in increased bacterial growth in our culture system, however, and we assume that the stationary phase arrest seen in this study reflects some level of oxygen depletion.
The distribution of abundant transcripts across the antisense transcriptome is largely the inverse of the coding transcriptome, with energy metabolism and macromolecule synthesis under-represented at the expense of conserved hypotheticals and proteins of unknown function. Reflecting a pattern that is emerging from a range of sequence-based bacterial transcriptome studies [57] the antisense transcriptome of M. tuberculosis includes a diverse size-range of transcripts arising both within genes and as a result of 3’ UTR overlaps between convergent gene pairs.
The abundance of long 3’ UTRs observed in M. tuberculosis may be due to inefficient termination resulting from replacement of the characteristic bacterial L-shaped intrinsic transcriptional terminator consisting of a hairpin loop followed by a poly-U stretch [58] by an I-shaped terminator lacking a poly-U stretch [59], [60]. 3’ UTR antisense transcripts have the potential to provide a regulatory connection between neighbouring genes [57] and enrichment of cell envelope and toxin genes in 3’-3’ convergent pairs may reflect an organizational motif that has functional consequences for gene expression. Several antisense transcripts are associated with foreign genetic elements, including an abundant transcript that maps to CRISPR-association genes. The CRISPR locus is a non-coding RNA defence system that bacteria use to combat invasion by foreign genetic sequences [36], [37]. In E. coli the CRISPR-associated (cas) proteins involved in this process are silenced by the H-NS DNA-binding protein during exponential growth [61] and the antisense transcript extending across cas-encoding Rv2816c and Rv2817c may perform an analogous regulatory function in M. tuberculosis.
Although we had not specifically enriched our libraries for primary 5’ ends [25] we were able to estimate the minimum length of most 5’ UTRs by examining Artemis profiles, and identify multiple very long (≥150 nt) 5’ UTRs. By analogy with other bacteria, we anticipate that these will play a role in coordination of gene expression and in regulation by small molecule ligands. Many of the genes with long, highly expressed 5’ UTRs encode ribosomal proteins or other factors involved in translation. In Escherichia coli coordinated expression of ribosomal RNA, ribosomal proteins and ribosome-associated factors involves the interaction of ribosomal proteins with the 5’ UTR of mRNAs causing attenuation of expression [41]. Similarly, in B. subtilis 5’ UTR binding by ribosomal protein L20 controls the expression of the infC operon [62] In M. tuberculosis sequence alignments of 5’ UTRs of rpoA with rpsM and of infA with infC suggest that the upstream sequences may represent elements involved in coordinate regulation of core transcriptional and translation processes, analogous to the systems described in E. coli and B. subtilis [41], [62]. The 5’ UTRs of groE genes overlap the CIRCE elements that are recognized by the HrcA transcriptional repressor [39] but also play a role in post-transcriptional control of mRNA stability in B. subtilis [63] and in Rhodobacter capsulatus [64]. It is likely that the transcriptional control of the heat shock response in M. tuberculosis is complemented by an additional layer of post-transcriptional regulation via this element. A further subset of 5’ UTRs correspond to predicted riboswitches that regulate expression of their cognate gene in response to the presence or absence of small molecules. In the absence of activation signal, riboswitch-mediated attenuation generates truncated transcripts mapping to the 5’ end of genes; a profile that is associated with many of abundant 5’ UTRs identified in the non-coding transcriptome of M. tuberculosis. It has been suggested that 2% of B. subtilis genes may be regulated by riboswitches [13] and this form of regulation may have similar importance for M. tuberculosis. Small regulatory RNAs, generally encoded in IGRs, have provided a focus for recent interest with respect to their role in bacterial responses to environmental change and pathogenesis (reviewed in [12]). Trans-encoded sRNAs typically function by base-pairing with a panel of mRNA targets in a manner that prevents translation and accelerates their degradation. In the case of the best-characterised examples, the interaction of sRNA with mRNA is mediated by the Hfq chaperone. M. tuberculosis belongs to the subset of bacteria which lack an identified Hfq homologue, but RNA-seq analysis is consistent with previous descriptions of the presence of multiple intergenic sRNAs.
To explore the functional role of sRNAs in M. tuberculosis, we manipulated the expression of MTS2823. This sRNA is present in all growth phases, but is expressed at very high levels during stationary phase; we reasoned that we might be able to recapitulate its stationary phase function by over-expression in exponential phase. Over-expression of MTS2823 caused widespread down-regulation of gene expression, with the most profound effect on the gene classes preferentially associated with exponential growth. Genes linked to the methyl citrate network, in particular prpC, and to a lesser extent prpD were most strongly down-regulated. This could represent a preferential targeting by MTS2823, either to reduce the utilization of substrates (i.e. propionyl-CoA and/or oxaloacetate) or to reduce the accumulation of potentially toxic intermediates such as methyl citrate. The participation of these genes within a feed-forward regulatory loop provides an alternative explanation for their amplified response [65], [66]. Methyl citrate genes are also down-regulated in response to hypoxia and DNA damage [8], [67]. During transition to stationary phase, the down-regulation of genes required for active bacterial replication is commonly mediated by expression of a 6S RNA molecule that interferes with transcription by RNA polymerase associated with the principal sigma factor [68]. An M. smegmatis homologue of MTS2823 was recently identified in a bioinformatics screen based on suboptimal structural criteria for 6S RNA, but detailed analysis, including lack of binding to RNA polymerase, led the authors to conclude that it is not a genuine 6S RNA homologue [69]. Our results suggest that MTS2823 may have functional homology with 6S RNA in its ability to mediate down-regulation of exponential phase genes, although the molecular mechanism remains to be clarified. In vitro models of mycobacterial persistence typically involve growth arrest, associated with down-regulation of a broad panel of genes and up-regulation of a more limited set of condition-specific genes [8], [70]. MTS2823 may be an important mediator of the common down-regulatory component.
We anticipate that the majority of M. tuberculosis sRNAs will function in post-transcriptional regulation of more restricted sets of mRNAs involved in adaptive responses to specific environmental stimuli. MTS1338 provides a characteristic example. Expression of MTS1338 is strongly induced under the conditions used to generate stationary phase cultures, by a mechanism that is at least partly dependent on the hypoxia-responsive DosRS two-component transcriptional regulator.
sRNAs involved in Hfq-mediated interactions are generally degraded along with their mRNA target [13]. In contrast, we observed accumulation rather than degradation of M. tuberculosis sRNAs in the stationary phase induction model. Even higher levels of sRNA accumulation were observed in the lungs of mice during chronic tuberculosis infection, with MTS2823 present at 16% of the level of 16S rRNA, MTS0997 at 5% and MTS1338 at 0.5%. The abundance of sRNAs in infected tissues suggests that they may provide useful biomarkers, and potentially important functional mediators, during the course of disease.
In summary, sequence-based analysis of the transcriptome of M. tuberculosis uncovers a wide range of novel non-coding RNAs with the potential to influence patterns of gene expression in vitro and during infection. Targeted analysis by deletion and over-expression may provide insights into the molecular pathogenesis of this important human disease.
Materials and Methods
Ethics statement
The NIAID DIR Animal Care and Use Program adheres to the U. S. Government Principles for the Utilization and Care of Vertebrate Animals Used in Testing, Research, and Training, the PHS Policy on Humane Care and Use of Laboratory Animals, the Guide for the Care and Use of Laboratory Animals, and the U.S. Animal Welfare Regulations. We operate in accord with NIH Policy Manual 3040-2 (Animal Care and Use in the Intramural Program) and in compliance with the provisions of the NIH's intramural Institutional Assurance (NIH IRP, PHS Assurance A4149-01) on file with the NIH Office of Laboratory Animal Welfare (OLAW). The NIH Intramural Research Program is fully accredited by the Association for the Assessment and Accreditation of Laboratory Animal Care, International.The Animal Care and Use Committee (ACUC) of the National Institute of Allergy and Infectious Diseases, Division of Intramural Research, with permit number NIH IRP, PHS Assurance A4149-01, approved the animal study protocol LCID-3E under which all animal experiments were performed.
Oligonucleotides
Table S6 lists all oligos used in this study.
Strains and culture conditions
M. tuberculosis H37Rv and M. tuberculosis H37Rv:: δdosR::kan [5] were grown in Middlebrook 7H9 supplemented with 0.2% glycerol and 10% ADC in roller bottle culture. Exponential phase cultures were harvested at an OD600 0.6 to 0.8; stationary phase cultures were harvested one week after OD600 had reached 1.0. M. tuberculosis H37Rv:: δRv3676 [45] had a significantly slower growth rate and was grown two weeks after OD600 1.0 to generate stationary phase cultures. To monitor β-galactosidease activity, M. tuberculosis and M. smegmatis were grown on solid 7H9 supplemented with 25 µg/ml kanamycin and 50 µg/ml X-gal.
Infections
Eight-week-old C57Bl/6 mice were infected with 100 colony forming units of M. tuberculosis H37Rv by aerosol using a BioAerosol nebulizing generator (CH Technologies Inc., Westwood, NJ) for 10 minutes and the infection was allowed to develop for 9 months by which time the CFUs had reached 7.5±2.5×10⁵. Mice were sacrificed, each lung homogenized in 5 ml Trizol reagent (Invitrogen Corporation, Carlsbad, CA) and bacteria were separated from the lysed lung tissue by centrifugation at 3500 rpm for 10 minutes at 4°C. The cell pellet was washed once in Trizol, followed by resuspension in 1 ml Trizol containing 5 µg/ml glycogen and stored at −80°C until bacterial RNA extraction.
Cloning
lacZ reporter fusions were made by PCR amplification of the MTS0997 promoter region with primers P0997.f+r. The resulting fragment was inserted into pEJ414 [71]. Mutation of the −10 box was done with site-directed mutagenesis using primers SDM0997(−10).f+r and Pfu Ultra (Stratagene) according to manufacturer's instructions. Reporter plasmids were electroporated into M. smegmatis mc2155 [72] as well as M. tuberculosis H37Rv. Over-expression construct of MTS2823. The over-expression plasmid was made by replacing the rrnB promoter fragment in a previously described over-expression plasmid [22] with the region spanning −80 to −8 from the same promoter to generate pKA303. The −10 box is immediately followed by a HindIII site where the sRNAs can be inserted, which means that the sRNAs can be expressed from their own transcription start site. A 316 bp HindIII fragment containing MTS2823 (+1 to +304) was PCR amplified using primers ox2823.f and ox2823.r. The fragment was cloned into pCR-Blunt II-TOPO (Invitrogen), sequenced and subsequently sub-cloned into pKA303. The resulting plasmid was electroporated into M. tuberculosis H37Rv.
RNA isolation and handling
Cultures were cooled rapidly by the addition of ice directly to the culture before centrifugation. RNA was isolated by means of the FastRNA Pro blue kit from QBiogene/MP Bio according to manufacturer's instructions. RNA was treated Turbo DNase (Ambion) until DNA free. The quality of RNA was assessed using a Nanodrop (ND-1000, Labtech) and Agilent bioanalyser. In order to enrich for small transcripts in the RNA-seq reactions, total RNA was treated with tobacco acid pyrophosphatase (TAP, Epicentre technologies) and subsequently ligated with T4 RNA ligase (Ambion) before reverse transcription. Bacteria from mouse lungs were disrupted by bead beating in Trizol in a Fastprep instrument, chloroform extracted and ethanol precipitated. Due to the low bacterial count RNA from three mice was pooled. The RNA was subsequently purified with Turbo DNase and phenol extraction before reverse transcription. Northern blots, RT-PCR for investigating co-transcription and 5’ RACE were carried out as described previously [22].
RNA-seq
Construction of cDNA libraries and sequencing was carried out essentially as described previously [73]. Sequence reads were aligned to the reference sequence of M. tuberculosis H37Rv (EMBL accession code AL123456) as paired end data using BWA [74]. The orientation of the second read in correctly mapped pairs was reversed using Samtools [74] before producing coverage plots in order to maintain the directional fidelity of the data. Novel intergenic features were annotated by visual inspection of the transcriptome using the Artemis genome browser. RPKM values were calculated using only sequence reads that mapped to annotated features unambiguously (the ‘XA’ note in the alignment file was used to identify alternative mapping locations) and on the correct strand. To ascertain the proportion of a gene to which reads could be unambiguously mapped, 54 nucleotide paired end data were simulated from the genome sequence and aligned to the sequence under the settings used for mapping the RNA-seq reads.
qRT-PCR
cDNA for quantitative RT-PCR and RNA-seq was made with random primers and Superscript III according to manufacturer's instructions (Invitrogen) with an additional incubation step for one hour at 55°C in order to optimize read-through of highly structured sequences. qRT-PCR was carried out on a 7500 Fast Real-Time PCR System (Applied Biosystems) using Fast SYBR Green Master Mix (Applied Biosystems). RNA without RT (RT-) was analyzed alongside cDNA (RT+). Standard curves were performed for each gene analyzed and the quantities of cDNA within the samples were calculated from cycle threshold values. Data were averaged, adjusted for chromosomal DNA contamination (RT+ minus RT-) and normalized to corresponding 16S RNA values.
Microarray analysis
Microarrays were performed on three biological replicates of over-expression strain against the control strain containing empty vector. Reverse transcription, hybridization and subsequent analysis were carried out as described [75].
Statistical analysis
All analyses where carried out using STATA s.e.m version 10. To compare the frequencies of different functional categories we used Fisher's exact test. For the comparison between the annotated genome and the transcriptome, and for the comparison of the transcriptome with the antisense transcripts we used all the categories and therefore the False Discovery Rate correction for multiple testing [76] was applied. For the rest of the analyses only selected categories were tested and no test for multiple correction was required.
Supporting Information
Zdroje
1. WHO 2009 Global tuberculosis control - epidemiology, strategy, financing. Geneva WHO
2. BarryCE3rdBoshoffHIDartoisVDickTEhrtS 2009 The spectrum of latent tuberculosis: rethinking the biology and intervention strategies. Nat Rev Microbiol 7 845 855
3. ReddyTBRileyRWymoreFMontgomeryPDeCaprioD 2009 TB database: an integrated platform for tuberculosis research. Nucleic Acids Res 37 D499 508
4. ManganelliRVoskuilMI Schoolnik GK, Dubnau E, Gomez M, et al. 2002 Role of the extracytoplasmic-function sigma factor sigma(H) in Mycobacterium tuberculosis global gene expression. Mol Microbiol 45 365 374
5. ParkHDGuinnKMHarrellMILiaoRVoskuilMI 2003 Rv3133c/dosR is a transcription factor that mediates the hypoxic response of Mycobacterium tuberculosis. Mol Microbiol 48 833 843
6. RustadTRHarrellMILiaoRShermanDR 2008 The enduring hypoxic response of Mycobacterium tuberculosis. PLoS One 3 e1502
7. SchnappingerDEhrtSVoskuilMILiuYManganJA 2003 Transcriptional Adaptation of Mycobacterium tuberculosis within Macrophages: Insights into the Phagosomal Environment. J Exp Med 198 693 704
8. VoskuilMISchnappingerDViscontiKCHarrellMIDolganovGM 2003 Inhibition of respiration by nitric oxide induces a Mycobacterium tuberculosis dormancy program. J Exp Med 198 705 713
9. WaltersSBDubnauEKolesnikovaILavalFDaffeM 2006 The Mycobacterium tuberculosis PhoPR two-component system regulates genes essential for virulence and complex lipid biosynthesis. Mol Microbiol 60 312 330
10. ColeSTBroschRParkhillJGarnierTChurcherC 1998 Deciphering the biology of Mycobacterium tuberculosis from the complete genome sequence. Nature 393 537 544
11. GripenlandJNetterlingSLohETiensuuTToledo-AranaA 2010 RNAs: regulators of bacterial virulence. Nat Rev Microbiol 8 857 866
12. PapenfortKVogelJ 2010 Regulatory RNA in bacterial pathogens. Cell Host Microbe 8 116 127
13. WatersLSStorzG 2009 Regulatory RNAs in bacteria. Cell 136 615 628
14. MandalMBreakerRR 2004 Gene regulation by riboswitches. Nat Rev Mol Cell Biol 5 451 463
15. LohEDussurgetOGripenlandJVaitkeviciusKTiensuuT 2009 A trans-acting riboswitch controls expression of the virulence regulator PrfA in Listeria monocytogenes. Cell 139 770 779
16. GottesmanSStorzG 2010 Bacterial Small RNA Regulators: Versatile Roles and Rapidly Evolving Variations. Cold Spring Harb Perspect Biol Epub ahead of print. pii doi:10.1101/cshperspect.a003798 cshperspect.a003798v1
17. Toledo-AranaADussurgetONikitasGSestoNGuet-RevilletH 2009 The Listeria transcriptional landscape from saprophytism to virulence. Nature 459 950 956
18. PfeifferVSittkaATomerRTedinKBrinkmannV 2007 A small non-coding RNA of the invasion gene island (SPI-1) represses outer membrane protein synthesis from the Salmonella core genome. Mol Microbiol 66 1174 1191
19. PichonCFeldenB 2005 Small RNA genes expressed from Staphylococcus aureus genomic and pathogenicity islands with specific expression among pathogenic strains. Proc Natl Acad Sci U S A 102 14249 14254
20. MandinPRepoilaFVergassolaMGeissmannTCossartP 2007 Identification of new noncoding RNAs in Listeria monocytogenes and prediction of mRNA targets. Nucleic Acids Res 35 962 974
21. ArnvigKBYoungDB 2010 Regulation of pathogen metabolism by small RNA. Drug Discov Today Dis Mech 7 e19 e24
22. ArnvigKBYoungDB 2009 Identification of small RNAs in Mycobacterium tuberculosis. Mol Microbiol 73 397 408
23. DichiaraJMContreras-MartinezLMLivnyJSmithDMcDonoughKA 2010 Multiple small RNAs identified in Mycobacterium bovis BCG are also expressed in Mycobacterium tuberculosis and Mycobacterium smegmatis. Nucleic Acids Res 38 4067 78
24. PerkinsTTKingsleyRAFookesMCGardnerPPJamesKD 2009 A strand-specific RNA-Seq analysis of the transcriptome of the typhoid bacillus Salmonella typhi. PLoS Genet 5 e1000569
25. SharmaCMHoffmannSDarfeuilleFReignierJFindeissS 2010 The primary transcriptome of the major human pathogen Helicobacter pylori. Nature 464 250 255
26. SittkaALucchiniSPapenfortKSharmaCMRolleK 2008 Deep sequencing analysis of small noncoding RNA and mRNA targets of the global post-transcriptional regulator, Hfq. PLoS Genet 4 e1000163
27. AlbrechtMSharmaCMReinhardtRVogelJRudelT 2010 Deep sequencing-based discovery of the Chlamydia trachomatis transcriptome. Nucleic Acids Res 38 868 877
28. BohnCRigoulayCChabelskayaSSharmaCMMarchaisA 2010 Experimental discovery of small RNAs in Staphylococcus aureus reveals a riboregulator of central metabolism. Nucleic Acids Res 38 6620 6636
29. GuellMvan NoortVYusEChenWHLeigh-BellJ 2009 Transcriptome complexity in a genome-reduced bacterium. Science 326 1268 1271
30. BitterWHoubenENLuirinkJAppelmelkBJ 2009 Type VII secretion in mycobacteria: classification in line with cell envelope structure. Trends Microbiol 17 337 338
31. PymASBrodinPBroschRHuerreMColeST 2002 Loss of RD1 contributed to the attenuation of the live tuberculosis vaccines Mycobacterium bovis BCG and Mycobacterium microti. Mol Microbiol 46 709 717
32. SkjotRLOettingerTRosenkrandsIRavnPBrockI 2000 Comparative evaluation of low-molecular-mass proteins from Mycobacterium tuberculosis identifies members of the ESAT-6 family as immunodominant T-cell antigens. Infect Immun 68 214 220
33. RamageHRConnollyLECoxJS 2009 Comprehensive functional analysis of Mycobacterium tuberculosis toxin-antitoxin systems: implications for pathogenesis, stress responses, and evolution. PLoS Genet 5 e1000767
34. RustadTRSherridAMMinchKJShermanDR 2009 Hypoxia: a window into Mycobacterium tuberculosis latency. Cell Microbiol 11 1151 1159
35. RutherfordKParkhillJCrookJHorsnellTRiceP 2000 Artemis: sequence visualization and annotation. Bioinformatics 16 944 945
36. SorekRKuninVHugenholtzP 2008 CRISPR--a widespread system that provides acquired resistance against phages in bacteria and archaea. Nat Rev Microbiol 6 181 186
37. KarginovFVHannonGJ 2010 The CRISPR system: small RNA-guided defense in bacteria and archaea. Mol Cell 37 7 19
38. GardnerPPDaubJTateJGNawrockiEPKolbeDL 2009 Rfam: updates to the RNA families database. Nucleic Acids Res 37 D136 140
39. StewartGRWernischLStablerRManganJAHindsJ 2002 Dissection of the heat-shock response in Mycobacterium tuberculosis using mutants and microarrays. Microbiology 148 3129 3138
40. TorarinssonELindgreenS 2008 WAR: Webserver for aligning structural RNAs. Nucleic Acids Res 36 W79 84
41. LindahlLZengelJM 1986 Ribosomal genes in Escherichia coli. Annu Rev Genet 20 297 326
42. VitreschakAGMironovAALyubetskyVAGelfandMS 2008 Comparative genomic analysis of T-box regulatory systems in bacteria. Rna 14 717 735
43. WarnerDFSavviSMizrahiVDawesSS 2007 A riboswitch regulates expression of the coenzyme B12-independent methionine synthase in Mycobacterium tuberculosis: implications for differential methionine synthase function in strains H37Rv and CDC1551. J Bacteriol 189 3655 3659
44. HobsonRJMcBrideAJKempsellKEDaleJW 2002 Use of an arrayed promoter-probe library for the identification of macrophage-regulated genes in Mycobacterium tuberculosis. Microbiology 148 1571 1579
45. RickmanLScottCHuntDMHutchinsonTMenendezMC 2005 A member of the cAMP receptor protein family of transcription regulators in Mycobacterium tuberculosis is required for virulence in mice and controls transcription of the rpfA gene coding for a resuscitation promoting factor. Mol Microbiol 56 1274 1286
46. LunDSSherridAWeinerBShermanDRGalaganJE 2009 A blind deconvolution approach to high-resolution mapping of transcription factor binding sites from ChIP-seq data. Genome Biol 10 R142
47. RamanKChandraN 2008 Mycobacterium tuberculosis interactome analysis unravels potential pathways to drug resistance. BMC Microbiol 8 234
48. ManganelliRVoskuilMI Schoolnik GK, Smith I 2001 The Mycobacterium tuberculosis ECF sigma factor sigmaE: role in global gene expression and survival in macrophages. Mol Microbiol 41 423 437
49. SunRConversePJKoCTyagiSMorrisonNE 2004 Mycobacterium tuberculosis ECF sigma factor sigC is required for lethality in mice and for the conditional expression of a defined gene set. Mol Microbiol 52 25 38
50. Munoz-EliasEJTimmJBothaTChanWTGomezJE 2005 Replication dynamics of Mycobacterium tuberculosis in chronically infected mice. Infect Immun 73 546 551
51. GillWPHarikNSWhiddonMRLiaoRPMittlerJE 2009 A replication clock for Mycobacterium tuberculosis. Nat Med 15 211 214
52. ReesRJHartPD 1961 Analysis of the host-parasite equilibrium in chronic murine tuberculosis by total and viable bacillary counts. Br J Exp Pathol 42 83 88
53. ChaoMCRubinEJ 2010 Letting sleeping dos lie: does dormancy play a role in tuberculosis? Annu Rev Microbiol 64 293 311
54. KomorowskiMMiekiszJKierzekAM 2009 Translational repression contributes greater noise to gene expression than transcriptional repression. Biophys J 96 372 384
55. Vlietv 2010 Next generation sequencing of microbial transcriptomes: challenges and opportunities. FEMS Microiol Lett 302 1 7
56. JonesGJGordonSVHewinsonRGVordermeierHM 2010 Screening of predicted secreted antigens from Mycobacterium bovis reveals the immunodominance of the ESAT-6 protein family. Infect Immun 78 1326 1332
57. GeorgJHessWR 2011 cis-antisense RNA, another level of gene regulation in bacteria. Microbiol Mol Biol Rev 75 286 300
58. EpshteinVCardinaleCJRuckensteinAEBorukhovSNudlerE 2007 An allosteric path to transcription termination. Mol Cell 28 991 1001
59. UnniramanSPrakashRNagarajaV 2002 Conserved economics of transcription termination in eubacteria. Nucleic Acids Res 30 675 684
60. MitraAAngamuthuKNagarajaV 2008 Genome-wide analysis of the intrinsic terminators of transcription across the genus Mycobacterium. Tuberculosis 88 566 575
61. PulUWurmRArslanZGeissenRHofmannN 2010 Identification and characterization of E. coli CRISPR-cas promoters and their silencing by H-NS. Mol Microbiol 75 1495 1512
62. ChooneeNEvenSZigLPutzerH 2007 Ribosomal protein L20 controls expression of the Bacillus subtilis infC operon via a transcription attenuation mechanism. Nucleic Acids Res 35 1578 1588
63. HomuthGMogkASchumannW 1999 Post-transcriptional regulation of the Bacillus subtilis dnaK operon. Mol Microbiol 32 1183 1197
64. JagerSJagerAKlugG 2004 CIRCE is not involved in heat-dependent transcription of groESL but in stabilization of the mRNA 5’-end in Rhodobacter capsulatus. Nucleic Acids Res 32 386 396
65. DattaPShiLBibiNBalazsiGGennaroML 2011 Regulation of central metabolism genes of Mycobacterium tuberculosis by parallel feed-forward loops controlled by sigma factor E (σ(E)). J Bacteriol 193 1154 1160
66. MicklinghoffJCBreitingerKJSchmidtMGeffersREikmannsBJ 2009 Role of the transcriptional regulator RamB (Rv0465c) in the control of the glyoxylate cycle in Mycobacterium tuberculosis. J Bacteriol 191 7260 7269
67. BoshoffHIMyersTGCoppBRMcNeilMRWilsonMA 2004 The transcriptional responses of Mycobacterium tuberculosis to inhibitors of metabolism: novel insights into drug mechanisms of action. J Biol Chem 279 40174 40184
68. TrotochaudAEWassarmanKM 2005 A highly conserved 6S RNA structure is required for regulation of transcription. Nat Struct Mol Biol 12 313 319
69. PanekJKrasnyLBobekJJezkovaEKorelusovaJ 2011 The suboptimal structures find the optimal RNAs: homology search for bacterial non-coding RNAs using suboptimal RNA structures. Nucleic Acids Res 39 3418 3426
70. KerenIMinamiSRubinELewisK 2011 Characterization and Transcriptome Analysis of Mycobacterium tuberculosis Persisters. MBio 2 e00100 00111
71. PapavinasasundaramKPAndersonCBrooksPCThomasNAMovahedzadehF 2001 Slow induction of RecA by DNA damage in Mycobacterium tuberculosis. Microbiology 147 3271 3279
72. SnapperSBMeltonREMustafaSKieserTJacobsWRJ 1990 Isolation and characterization of efficient plasmid transformation mutants of Mycobacterium smegmatis. Mol Microbiol 4 1911 1919
73. CroucherNJFookesMCPerkinsTTTurnerDJMargueratSB 2009 A simple method for directional transcriptome sequencing using Illumina technology. Nucleic Acids Res 37 e148
74. LiHHandsakerBWysokerAFennellTRuanJ 2009 The Sequence Alignment/Map format and SAMtools. Bioinformatics 25 2078 2079
75. HuntDMSaldanhaJWBrennanJFBenjaminPStromM 2008 Single nucleotide polymorphisms that cause structural changes in the cyclic AMP receptor protein transcriptional regulator of the tuberculosis vaccine strain Mycobacterium bovis BCG alter global gene expression without attenuating growth. Infect Immun 76 2227 2234
76. BenjaminiYHochbergY 1995 Controlling the False Discovery Rate: A Practical and Powerful Approach to Multiple Testing. J R Stat Soc Series B Stat Methodol 57 289 300
77. SmootMEOnoKRuscheinskiJWangPLIdekerT 2011 Cytoscape 2.8: new features for data integration and network visualization. Bioinformatics 27 431 432
Štítky
Hygiena a epidemiologie Infekční lékařství LaboratořČlánek vyšel v časopise
PLOS Pathogens
2011 Číslo 11
- Parazitičtí červi v terapii Crohnovy choroby a dalších zánětlivých autoimunitních onemocnění
- Vakcíny proti klíšťové encefalitidě
- Kdy je nejlepší očkovat
- Možné vedlejší účinky očkování
- Imunogenita vakcín
Nejčtenější v tomto čísle
- Multiple Candidate Effectors from the Oomycete Pathogen Suppress Host Plant Immunity
- The Splicing Factor Proline-Glutamine Rich (SFPQ/PSF) Is Involved in Influenza Virus Transcription
- A TNF-Regulated Recombinatorial Macrophage Immune Receptor Implicated in Granuloma Formation in Tuberculosis
- SH3 Domain-Mediated Recruitment of Host Cell Amphiphysins by Alphavirus nsP3 Promotes Viral RNA Replication
Zvyšte si kvalifikaci online z pohodlí domova
Mazová zátka a její řešení
nový kurzVšechny kurzy