
HIV-1 Envelope Subregion Length Variation during Disease Progression
The V3 loop of the HIV-1 Env protein is the primary determinant of viral coreceptor usage, whereas the V1V2 loop region is thought to influence coreceptor binding and participate in shielding of neutralization-sensitive regions of the Env glycoprotein gp120 from antibody responses. The functional properties and antigenicity of V1V2 are influenced by changes in amino acid sequence, sequence length and patterns of N-linked glycosylation. However, how these polymorphisms relate to HIV pathogenesis is not fully understood. We examined 5185 HIV-1 gp120 nucleotide sequence fragments and clinical data from 154 individuals (152 were infected with HIV-1 Subtype B). Sequences were aligned, translated, manually edited and separated into V1V2, C2, V3, C3, V4, C4 and V5 subregions. V1-V5 and subregion lengths were calculated, and potential N-linked glycosylation sites (PNLGS) counted. Loop lengths and PNLGS were examined as a function of time since infection, CD4 count, viral load, and calendar year in cross-sectional and longitudinal analyses. V1V2 length and PNLGS increased significantly through chronic infection before declining in late-stage infection. In cross-sectional analyses, V1V2 length also increased by calendar year between 1984 and 2004 in subjects with early and mid-stage illness. Our observations suggest that there is little selection for loop length at the time of transmission; following infection, HIV-1 adapts to host immune responses through increased V1V2 length and/or addition of carbohydrate moieties at N-linked glycosylation sites. V1V2 shortening during early and late-stage infection may reflect ineffective host immunity. Transmission from donors with chronic illness may have caused the modest increase in V1V2 length observed during the course of the pandemic.
Published in the journal:
. PLoS Pathog 6(12): e32767. doi:10.1371/journal.ppat.1001228
Category:
Research Article
doi:
https://doi.org/10.1371/journal.ppat.1001228
Summary
The V3 loop of the HIV-1 Env protein is the primary determinant of viral coreceptor usage, whereas the V1V2 loop region is thought to influence coreceptor binding and participate in shielding of neutralization-sensitive regions of the Env glycoprotein gp120 from antibody responses. The functional properties and antigenicity of V1V2 are influenced by changes in amino acid sequence, sequence length and patterns of N-linked glycosylation. However, how these polymorphisms relate to HIV pathogenesis is not fully understood. We examined 5185 HIV-1 gp120 nucleotide sequence fragments and clinical data from 154 individuals (152 were infected with HIV-1 Subtype B). Sequences were aligned, translated, manually edited and separated into V1V2, C2, V3, C3, V4, C4 and V5 subregions. V1-V5 and subregion lengths were calculated, and potential N-linked glycosylation sites (PNLGS) counted. Loop lengths and PNLGS were examined as a function of time since infection, CD4 count, viral load, and calendar year in cross-sectional and longitudinal analyses. V1V2 length and PNLGS increased significantly through chronic infection before declining in late-stage infection. In cross-sectional analyses, V1V2 length also increased by calendar year between 1984 and 2004 in subjects with early and mid-stage illness. Our observations suggest that there is little selection for loop length at the time of transmission; following infection, HIV-1 adapts to host immune responses through increased V1V2 length and/or addition of carbohydrate moieties at N-linked glycosylation sites. V1V2 shortening during early and late-stage infection may reflect ineffective host immunity. Transmission from donors with chronic illness may have caused the modest increase in V1V2 length observed during the course of the pandemic.
Introduction
The gp120 portion of the HIV-1 envelope protein (Env) mediates attachment prior to fusion with the host cell membrane during target cell infection. gp120 has five hypervariable regions (V1–V5) bounded by cysteine residues and separated by four relatively “constant” regions (C1–C4) [1]–[3]. Gp120 is notable for its sequence variation, which may arise through recombination and point mutation, as well as by insertion and deletion of one or more nucleotides. Insertion and deletion events (indels) occur throughout env but are maintained through positive selection particularly within the hypervariable loops, which thereby may acquire significant length variation [4], The third hypervariable region is known to encode the primary determinants of coreceptor usage specificity [5]–[7], as well as epitopes recognized by humoral [8], [9] and cellular [10], [11] immune responses. V3 loop sequence variation has been extensively studied, and correlated with changes in host cell range, cytopathogenicity, and disease progression [12]–[14].
The V1V2 region in particular is characterized by a high degree of length polymorphism, sequence variation, and predicted N-linked glycosylation sites (PNLGS) [15]–[20], each of which may affect viral attachment, coreceptor usage and recognition by neutralizing antibodies [20], [21]. Comparison of structural models of gp120 and gp120 bound to CD4 and a chemokine coreceptor have yielded considerable insight into the functional roles played by V1V2 and V3 during viral attachment [22], [23]. In the unbound gp120 conformation, the V2 loop partially obscures V3 and other gp120 residues involved in coreceptor binding. Binding to CD4 induces conformational changes that expose the coreceptor binding site on gp120, including residues from V1V2, V3 and other regions [22], [24].
Numerous studies have suggested that sequence variation in V1V2 influences host cell range and/or syncytium-inducing (SI) phenotype [25]–[31]. For example, Toohey demonstrated that recombinant chimeric clones with a V1V2 region from macrophage-tropic HIV-1 strains replicated efficiently in macrophages, whereas clones with the V1V2 region from lymphotropic strains did not [31]. However, not all studies have been concordant on the role of V1V2 in viral replication kinetics, cell range and transmission [15]–[19], [32]. For example, Pastore showed that sequence changes in V1V2 could rescue otherwise lethal mutations in V3 associated with a change in coreceptor usage [33], and V2 polymorphisms have also been linked with restriction to CCR5 coreceptor usage [16]. In contrast, Wang et al found no relationship between SI phenotype and V1V2 sequence, length, distribution of PNLGS or charge [32].
The V1V2 region also appears to be an important determinant of sensitivity to neutralizing antibodies [34]–[38]. The V1V2 region evolves under positive natural selection in vivo [4], [39]–[41], and an inverse relationship between V1–V4 length and neutralization susceptibility has been demonstrated in subtypes A [20], B [34]–[38] and C [42]. Tellingly, laboratory strains lacking V1V2 may still replicate efficiently in vitro, but appear to be especially sensitive to antibody neutralization [43], [44]. Consistent with this observation, viral strains with shorter and less glycosylated V1V4 regions have been reported to preferentially replicate in subjects newly infected with HIV-1 subtype C [45] (where presumably an effective neutralizing antibody response has not had time to emerge), and similar observations have been made concerning the V1V2 loop in individuals recently infected by HIV-1 subtype A [19]. However, we and others have not observed this effect in HIV-1 subtype B [19], [46], [47].
Despite these reports, the relationship between V1V2 region length polymorphism and disease progression remains unclear. In two small longitudinal studies, elongation of V1 and V2 was noted in long-term nonprogressors (LTNP), but not within individuals progressing rapidly to AIDS [15]–[19]. In a third study, no clear relationship between V1V2 length variation and disease progression was observed [48]. Lastly, some investigators postulate that V1V2 length changes positively correlate with the pace of disease progression [16], [19], while others have suggested that V1V2 length increase may be a correlate of delayed progression to AIDS [18].
Thus, our understanding of the role of the V1V2 loop in influencing HIV pathogenesis remains incomplete and is challenged by several contradictory observations. To more fully characterize HIV envelope subregion variability and to clarify the associations between subregion length variation, glycosylation, and disease progression, we have comprehensively examined length and glycosylation of each gp120 subregion as a function of clinical parameters in a large collection HIV-1 subtype B infected individuals.
Methods
Ethics statement
This study was performed using publicly available data from the Los Alamos database, and previously unpublished experimental data obtained at the University of Washington. Unpublished data were obtained and analyzed with written informed consent of study participants, and approval by the University of Washington Institutional Review Board.
Patient selection
We analyzed new and published HIV-1 envelope gene sequences and associated clinical data from all available subjects in the Seattle Primary Infection Cohort (PIC) [49], the Multicenter AIDS Cohort Study (MACS) [50], and from the Los Alamos National Laboratories HIV database (HIVDB) (http://www.hiv.lanl.gov/content/hiv-db/mainpage.html) not meeting pre-specified exclusion criteria. Subjects were excluded from this study if younger than 18 years of age or if there was any history of antiretroviral therapy prior to sampling as determined by patient report and clinical records (MACS, PIC) or as indicated in the methods section of published reports (HIVDB), unless otherwise noted. All subjects considered in the cross-sectional and longitudinal analyses were infected with HIV-1 subtype B, except for two subjects infected with HIV-1 subtype A who were included in longitudinal analyses, but were excluded from cross-sectional analyses. (Additional subtypes were considered in analyses of env subregion length change during transmission, presented in Text S1, Section 8). Clinical data retrieved included CD4 count, viral load, time since infection, and treatment history. Sequence data were only accepted if directly derived from plasma or PBMC without an intervening step involving viral propagation in vitro. In some cases, individual authors were consulted to resolve clinical or methodological ambiguities. Accession numbers for published sequences are provided in Table S1. Gene sequence data used in this study are available at http://mullinslab.microbiol.washington.edu/publications/curlin_2010/.
Subject groups
Viral gene sequence data were considered in both cross-sectional (Table 1) and longitudinal analyses (Table 2). The cross-sectional dataset included only plasma and PBMC sequences derived from individuals infected with subtype B (see results, and Table 1). Sequences were triaged by author, database identifier and associated clinical data to exclude duplicate entries. To assess the role of stage of illness on loop length variation, subjects were divided into four non-overlapping groups; group Cx1 subjects were sampled within two months of the estimated time of infection. Group Cx2 subjects were sampled between two months and three years following infection. Group Cx3 subjects were sampled at times >3 years post infection. Group Cx4 was comprised of all individuals meeting 1993 CDC criteria for AIDS when sampling occurred (generally CD4 count <200/mm3), regardless of time since infection.


The longitudinal dataset was derived from 20 subjects infected with subtype B and 2 individuals infected with subtype A, from the PIC cohort and from previous reports [18], [51]–[55], in whom data were available from two or more timepoints (see results, and Table 2). All intra-individual longitudinal comparisons were made between sequences obtained from the same compartment (e.g., plasma vs. plasma). Individuals partitioned into group L1 (N = 15) did not meet criteria for AIDS at any time prior to the final sample (median follow-up 3.25 years, range 1 to 20.8 years), whereas subjects in group L2 (N = 7) were reported to have an AIDS-defining illness or peripheral CD4 count <200/mm3 between the first and second samples (median follow-up 2.75 years, range 2 to 4 years).
Nucleic acid isolation, cloning and sequencing
Sequences from the PIC and MACS cohorts (Tables 1 & 2) were obtained from plasma or PBMC by standard methods [56], [57], using safeguards to prevent contamination and template resampling [58]. Briefly, PCR amplification was performed using Taq polymerase (Bioline) with primers ED3 and BH2 [59] (first round) followed by ED5 and DR7 (second round) [60]. PCR products were cloned into a TA TOPO vector (Invitrogen) and selected colonies sequenced under contract using Big Dye dye-terminator protocols. Genbank accession numbers pending submission.
Sequence analysis
Deduced amino acid sequences were aligned using ClustalW [61] and divided into seven subregions; V1V2 (HXB2 nucleotide positions 6615–6812), C2 (HXB2 6813-7109), V3 (HXB2 7110–7217), C3 (HXB2 7218–7376), V4 (HXB2 7377–7478), C4 (HXB2 7479–7556), and V5 (HXB2 7557–7637). Alignments were manually edited and subregion lengths were counted using MacClade. PNLGS were counted using NetNGlyc.1 (http://www.cbs.dtu.dk/services/NetNGlyc/). Coreceptor usage (CCR5 vs. CXCR4 tropism) was predicted for all available subtype B V3 loop sequences, using the Position-Specific Substitution Method (PSSM) [62], Geno2pheno [63] and two other machine learning algorithms [64], [65] (hereafter denoted PSSM, G2P, PGRC and BMLC, respectively). For G2P coreceptor usage predictions, we selected the standard 10% false positivity threshold, and PGRC predictions were based on the support vector machine (SVR) user option. Estimated time since infection was calculated for all data entries. When time was reported as time since onset of symptoms or time post seroconversion (SC), symptoms and seroconversion were assumed to occur at 14 days and 42 days after infection, respectively [66], [67]. Date of seroconversion was assumed to occur at the midpoint between most recent negative serological test and first reported positive test, unless additional information was available.
Statistical analysis
For cross-sectional analyses, univariate and multivariate regressions were conducted assessing subregion lengths and number of glycosylation sites as a function of time since infection, stage of disease, CD4 count, HIV viral load, adjusting for sample source (plasma vs. PBMC), and date of sampling (calendar year). In regression analyses, to allow direct comparisons of the effect of each variable on V1V2 length and/or glycosylation, we compared β values (i.e., regression coefficients scaled such that each variable is equivalent to having a mean value of 0 and a standard deviation of 1). Generalized estimating equations (GEE) were utilized to account for non-independence of data points [68]–[70], and an exchangeable correlation structure was assumed. This method adjusts for the correlation of multiple sequences nested within a sample as well as multiple samples per patient. As an additional means of verifying that analysis outcomes were not influenced by data linkage, regression analyses were performed on replicate data subsets reconstituted from the original data by random resampling, including analyses on 100 data subsets each obtained by using one randomly selected sequence from each individual (See Text S1 section S2). To ensure that results were not unduly influenced by outlying sequences with extremely short or long loop lengths, analyses were repeated after excluding sequences representing the shortest 5% and longest 5% of the V1V2 loops in the dataset. For the longitudinal dataset, multivariate linear regressions were conducted assessing V1V2 length and number of glycosylation sites as a function of time since infection within a person, and the mean rate of change per year was estimated. Statistical analyses were performed using SAS version 9.1 (SAS Institute, Cary, NC).
Results
Sequence data
We obtained 5185 partial length HIV-1 env gene sequences for cross-sectional and longitudinal analysis by the methods described above (Tables 1 & 2). Sequences were isolated from 475 samples obtained from 154 individuals, including 27 from the MACS, 43 from the Seattle PIC and 84 from the HIVDB. Study subjects resided in North America (N = 116), Western Europe (N = 25), East Africa (N = 2), and Asia (N = 11), contributed a median of 14 sequences (range 1–287) and included persons in stages 1 (N = 41), 2 (N = 62), 3 (N = 40), and 4 (N = 27) of infection (note that some subjects contributing to the longitudinal analysis were included at more than one stage of infection). Sequences were derived from plasma (N = 2495), PBMC (N = 2620) and other sites (N = 70). Sequences were of subtype B (N = 5013) and subtype A (N = 172). All subtype A sequences and sequences derived from sites other than blood were excluded from cross-sectional analyses, but were considered as special cases under longitudinal analyses (sequence data available at: *webaddress pending acceptance*).
Cross-sectional analyses
Variation in sequence length and glycosylation
The V1V2, V4 and V5 hypervariable regions displayed heterogeneity in lengths up to approximately 2-fold in the 152 individuals examined. V1V2 was the most variable region, with loop lengths ranging from 50 to 99 amino acids (mean = 68), while V4 and V5 loop lengths ranged from 19 to 44 (mean = 32), and 14 to 36 (mean = 28) amino acids, respectively. In contrast, the V3 loop and the C2, C3 and C4 regions showed relatively little length variation (Figure 1). The subregions with the greatest number of potential glycosylation sites were V1V2 (mean 6 sites, range 0–12), C2 (mean 5, range 3–8) and V4 (mean 5, range 1–7). V3, C3 and V5 were more modestly glycosylated (mean = 1, 3, and 2, respectively, with a maximum of 5 glycosylated sites), whereas C4 rarely contained potential glycosylation sites (1 site was found in 8 of 4403 sequences).

Relationship between V1V2 loop length, sample features and clinical factors – univariate analyses
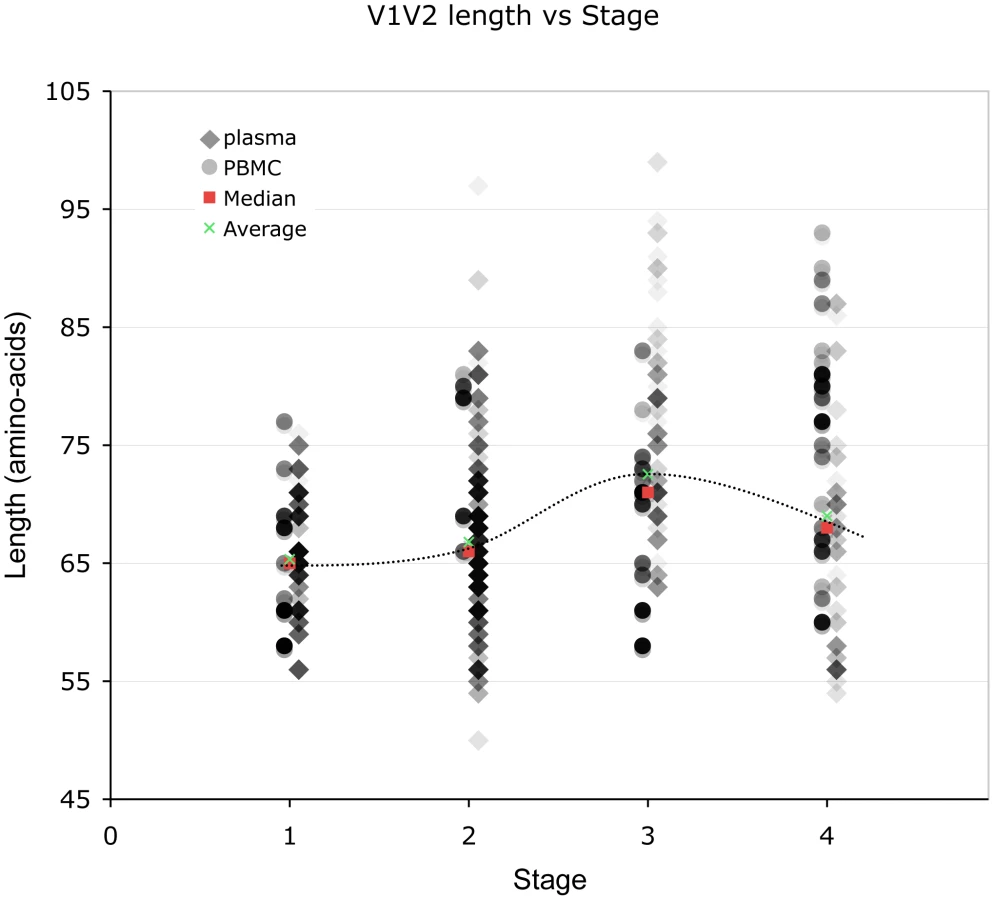
(And see Text S1, sections S1, S3, S6, and Figures S1, S2 and S12.) We examined V1V2 loop lengths as a function of year of sampling and specimen type (plasma vs. PBMC). In separate univariate GEE analyses, V1V2 length increased with calendar year of sampling (β = 1.62 increase in V1V2 length per year; p = 0.003, Figure 2, lower panel) and trended towards greater length in PBMC, though not significantly (β = 1.70 for PBMC compared to plasma; p = 0.11). We then examined individual subregion lengths as a function of time since infection, clinical stage, CD4 counts, and HIV plasma viral load. In separate GEE regression analyses, V1V2 length was significantly correlated with time since infection (β = 1.00 increase in V1V2 length per year; p<0.001, Figure 2, upper panel) and clinical stage, as subjects with stage 3 (β = 6.36; p<0.001) and stage 4 (β = 3.30; p = 0.02), but not stage 2 (β = 0.80; p = 0.4) had significantly longer V1V2 lengths compared to subjects with stage 1 infection (Figure 3 and S12). However, V1V2 length did not significantly correlate with either CD4 stratum (<200, 200–500 or >500 cells/ml) or plasma viral load.

Relationship between V1V2 loop length, sample features and clinical factors – multivariate analyses (Table 3)
To further understand the interaction between significant variables, we next performed multivariate analyses of V1V2 length vs. time since infection, clinical stage, CD4 level, and HIV viral load after adjusting for calendar year and type of sample. This analysis was performed for all sequences in the dataset, as well as with plasma sequences and PBMC sequences considered separately (Table 3). Overall, V1V2 length was not significantly associated with time since infection, CD4 level, or HIV viral load. However, among sequences derived from plasma, V1V2 length was significantly associated with increased time since infection (β = 0.77 per year; p<0.001). Conversely, among the PBMC sequences, V1V2 length was associated with decreased CD4 counts (β = 8.13 for CD4 counts between 200 and 500 and β = 6.77 for CD4 counts less than 200 compared to >500) although the association with the lowest CD4 count group did not reach statistical significance (p = 0.09). Among subjects without AIDS (Stages 1 through 3), V1V2 length was associated with time since infection (β = 0.70 increase in V1V2 length per year; p<0.001), even after adjustment for calendar year and type of sample (data not shown). Overall, after adjusting for calendar year and sample type, V1V2 length remained significantly associated with clinical stage, as subjects with stage 3 (β = 6.25; p<0.001) and stage 4 (β = 3.54; p = 0.02), but not stage 2 (β = 0.09; p = 0.9) had significantly longer V1V2 lengths compared to subjects with stage 1 infection. However, V1V2 lengths in subjects with clinical stage 4 were significantly shorter than V1V2 lengths from subjects in stage 3 (p<0.001). The findings of increased V1V2 length in stage 3 and 4 infection compared to stage 1 and 2 were similarly noted both among sequences derived from plasma as well as PBMC, although the plasma associations did not reach statistical significance in all cases. In order to assess the potential that the results regarding clinical and viral factors associated with V1V2 length could be driven by unusually short or long sequences, we repeated the above analyses excluding the shortest and longest 5% of V1V2 lengths. Since model coefficients and p-values were similar in this restricted analysis (Table S2), our findings do not appear to be unduly influenced by a small number of outlying small or large sequences (Also see Text S1, section S3 and Figure S6).

As an alternative means of accounting for the variable number of sequences contributed by study subjects, the data was subjected to a resampling analysis, in which each subject contributed a single randomly selected sequence. This process was repeated 100 times, resulting in 100 resampled datasets. These analyses confirmed that the observed relationship between V1V2 length and time since infection, and year of sampling were not significantly biased due to the inclusion of individuals with multiple sequences (See Text S1, section S2 and Figure S5).
Relationship between V4 and V5 loop lengths and clinical variables
(Also see Text S1, section S4 and Figure S7.) Despite their high degree of length variability, V4 and V5 loop lengths did not appear to vary significantly by time since infection in univariate regression analyses. In separate analyses adjusting for sample year and type, V4 length appeared somewhat increased in those with stage 2 (β = 1.22, p = 0.02), stage 3 (β = 0.98, p = 0.09) or stage 4 (β = 1.11, p = 0.10) compared to stage 1 infection. In contrast, V5 length decreased with increasing time after infection (β = −0.07, p<0.001), was decreased in stage 4 (β = −0.69, p = 0.01 compared to stage 1), and was decreased in those with CD4 counts below 200 cells/ml (β = −0.66, p = 0.002) compared to those with CD4 counts above 500 cells/ml.
Relationship between subregion glycosylation and clinical variables
(And see Text S1 section S1, and Figures S3, S4 and S8.) In separate univariate GEE analyses, the number of PNLGS in V1V2 increased with calendar year of sampling (β = 0.06 increase per year; p = 0.02), but was not significantly associated with sample type (β = 0.32 more potential sites in PBMC compared to plasma; p = 0.17). Glycosylation in V1V2 was increased in those with stage 3 (β = 0.96, p = 0.002), but not stage 2 or 4 compared to stage 1 infection, and was decreased in those with CD4 counts <200 cells/ml (β = −0.63, p = 0.04 compared to CD4 counts >500). Similar findings were obtained in an analysis restricted to sequences derived from plasma; the number of PNLGS in V1V2 increased with calendar year of sampling (β = 0.05 increase per year; p = 0.001), was increased in those with stage 3 infection (β = 1.14, p = 0.001) and was decreased in those with CD4 counts <200 cells/ml (β = −0.84, p = 0.04 compared to CD4 counts >500). However, in PBMC, the number of sequences was limited, and no associations between the number of potential glycosylation sites and clinical features achieved statistical significance. Glycosylation in V4 decreased (p<0.001), while in V5 glycosylation increased with calendar year (β = 0.01 per year, p = 0.02), although the magnitude of these effects was small (β = −0.03 per year, and 0.01 per year, respectively).
Coreceptor usage, clinical factors and V1V2 loop length
(Also see Text S1 section S5 and Figures S10 and S11.) We next used four published genotypic methods to infer coreceptor usage based on V3 loop amino acid sequence [62]–[65]. In our dataset, 4476 V3 loop sequences were available for scoring, and were derived from 129 individuals. 121 V3 loops could not be scored by the PGRC method because the aligned sequences exceeded the length limit specified by the input format (40 characters). There was agreement in coreceptor usage assignment by all of the methods in 3644 of 4476 sequences (81.4%) and disagreement between one or more methods in the remaining 832 sequences. 1046 of 4476 sequences were scored as CXR4-using or syncytium-inducing by one or more methods, and the remaining 3430 were uniformly scored as CCR5 or non-syncytium by all methods. 60 of 129 individuals had at least one X4-scoring V3 loop as determined by one or more of the prediction methods, while the remaining 69 had only CCR5-scoring sequences.
We then considered inferred coreceptor usage as a function of time since infection, clinical stage, CD4 counts, HIV viral load, and V1V2 length, both overall and separately in plasma - and PBMC–derived viruses. Because the PSSM method provides a continuous numerical measure corresponding to the sequence position on a continuum of the evolutionary changes leading to X4 usage (the PSSM score), we examined PSSM score in relation to these variables. Overall, in separate GEE regression analyses, PSSM score was not related to time since infection (p = 0.9) or HIV viral load (p = 0.5). However, PSSM score was significantly increased (indicating greater CXCR4 usage) in those with stage 4 (β = 6.34, p = 0.0002) but not stage 2 or stage 3 infection (p = 0.8 each). Similarly, PSSM score was significantly increased in those with intermediate (200–500 cells/ml) and low (<200 cells/ml) CD4 counts (β = 1.52, p = 0.02 and β = 6.62; p<0.0001, respectively) compared to those with CD4 counts above 500 cells/ml. PSSM score was weakly associated with increased V1V2 length (β = 0.06; p = 0.09 per one amino acid increase in V1V2 length). The analyses restricted to plasma samples yielded similar results, with PSSM score strongly associated with stage 4 infection (β = 8.54, p<0.0001), intermediate (200–500 cells/ml) and low (<200 cells/ml) CD4 counts (β = 1.67, p = 0.03 and β = 8.83; p<0.0001, respectively) compared to those with CD4 counts above 500 cells/ml, and PSSM score weakly associated with increased V1V2 length (β = 0.07; p = 0.12 per one amino acid increase in V1V2 length). In sequences derived from PBMC samples, PSSM score was not associated with stage of infection, CD4 counts, HIV viral load, or V1V2 length. However, PSSM score was inversely associated with time since infection (β = −0.15; p = 0.01 per year).
Longitudinal analyses
In the longitudinal dataset, significant V1V2 length increases between first and second timepoints were noted in 10 of 22 subjects, a significant V1V2 length decrease over time occurred in one subject, and no significant V1V2 length changes over time were seen in the remaining 11 subjects. These findings appeared to vary by stage of infection (t-test p = 0.03). In the 15 patients from the L1 group (individuals not meeting AIDS criteria at any time prior to final sampling), the mean increase of V1V2 length per subjects was 1.69 amino acids per year, and 9 subjects experienced significant V1V2 length increases over time (Figures 4 and 5). In contrast, of the seven subjects in the L2 group (individuals progressing to AIDS between first and final sample), the mean V1V2 length decreased by an average of 0.10 amino acids per year, with only one having a significant trend of increasing length, while one individual showed a significant decrease in length (Figure 6). The distribution of V1V2 length change (increase or decrease) by group was therefore asymmetric (Fisher's exact test, p = 0.02), reflecting a trend of increasing length in asymptomatic individuals (group L1) and stable or decreasing length in individuals with AIDS (group L2) (Table 4). Three subjects in group L1 had extensive longitudinal sampling (Figure 5); in 1362 and Q23 [51], there was a period of V1V2 length stability of approximately 2 years, followed by increase through 4.5 years. V1V2 length increase over time was also seen in CC1. In the case of CC1, a pseudotyped virus was created using the gp120 coding region from the initial timepoint from this individual in a HIV-1 NL4-3 background, and cultured in vitro [54]. In contrast to the patterns observed in vivo, V1V2 length and number of glycosylation sites both declined rapidly over 20 generations in vitro (p<0.001).


Discussion
We have systematically examined gp120 subregion length variation, and the relationship between length polymorphism, N-linked glycosylation sites, and clinical markers of disease progression. Although V1V2, V4 and V5 all displayed remarkable length heterogeneity, and V1V2, C3 and V4 were also quite variable with respect to glycosylation, the most significant associations between virological and clinical variables localized to the V1V2 region. We found that V1V2 length and glycosylation increased significantly over time during chronic infection, and then declined in late-stage illness. In regression analyses, time since infection was the most influential factor in determining V1V2 length. In addition, there was a modest but significant increase in V1V2 length over the period from 1984–2004. V5 loop length was highly variable, but tended to decrease slightly in length over the course of infection.
In SIV infection, the number of PNLGS in gp120 increases over time in vivo following inoculation of a cell-passaged strain [71]. In one earlier study in humans, Bunnik et al noted expansion in gp120 length followed by contraction over time in 4 of 5 individuals receiving antiretroviral therapy, and similar changes in glycosylation in 3 subjects [72]. Others have noted a relationship between early infection and reduced V1V2 length and glycosylation in subtypes C and A [19], [45]. In contrast, a comparison of early and chronic HIV-1 subtype B sequences from the HIV sequence database failed to reveal any significant difference in V1V2 length [19], suggesting that these effects may be subtype-specific. Data on length/glycosylation changes during transmission have been conflicting. Derdeyn et al [45] demonstrated reduced length and glycosylation in V1–V4 following heterosexual transmission in HIV-1 subtype C. However, Frost et al failed to note similar findings in a study of eight subtype B homosexual transmission pairs [47], and in our examination of these and 10 additional subtype B infected homosexual transmission pairs, we found no consistent pattern of change in V1–V2 or V1–V4 length or glycosylation upon transmission [46].
Interpretation of the data presented here may be affected by several methodological factors. There is probably some variation in the accuracy of the reported time of infection for sequences obtained from previous reports. In some cases, sequences obtained from prior publications may have been obtained under conditions permitting template resampling [73], and a systematic error due to evolving laboratory methods could result in bias. Also, in our analyses, we have not formally corrected for multiple comparisons. Physiological factors are also likely to introduce some noise, particularly in cross-sectional analyses of parameters with respect to time since infection. The individuals included here represent a broad spectrum of clinical scenarios, diverse host immune response profiles and varying disease progression rates. Plasma sequences may receive contributions from both recently infected target cells and older reservoirs, and therefore imperfectly reflect selective pressures prevailing at the time of infection. Finally, length and glycosylation phenotypes are likely to be affected by chance events and unknown factors not considered in our analyses. Therefore, the effects we describe are influential rather than deterministic, and reflect important selective forces that can be discerned against a background of high inter-individual variation.
Despite these limitations, the analyses presented here and the work of others [40], [45]–[47], [72] provide the outlines of an overall pattern characterized by transmission of randomly selected V1V2 loop lengths from viruses present in the donor pool, a brief decline in loop size during the initial months immediately following infection, gradual selection for bulkier V1V2 loops during chronic infection, and finally, reversion to more compact loops during late stage illness. Structural studies [22], [23], neutralization studies [20], [34]–[38], [42], and in vitro data on viruses lacking V1 and V2 [43], [44] suggest that one major function of the V1V2 region may be to permit evasion from humoral immune responses in the host. Thus, the trends outlined above support the hypothesis that HIV populations may evolve to escape humoral selective pressure by increasing V1V2 loop size. According to this view, the newly infected, immunologically naïve host might be expected to harbor relatively short V1V2 loops that eventually lengthen in response to an effective humoral response at some fitness cost (Figure S9). Experimental evidence indicating that relaxation of antibody-mediated selective pressure during early infection is associated with shorter loops is provided by Derdeyn, who demonstrated significantly greater neutralization sensitivity among five recipients during early infection, than in the corresponding donors [45]. The decline in V1V2 size observed in advanced disease probably reflects waning effectiveness of humoral immunity in hosts with late-stage illness and profound immune dysregulation (Figure 7). This decline is also congruent with previous findings of an inverse relationship between the rate of HIV genetic evolution and the rate of CD4 T cell decline in some individuals [74]. The dramatic reduction in V1V2 length associated with transfer to the in vitro environment [54] represents the extreme case of absent host immunity, where viruses without an unnecessarily bulky V1V2 loop achieve maximum replicative fitness. As would be expected, the patterns we observe are most pronounced in plasma sequences, which most directly reflect the selective forces present at the time of sampling. In contrast, a significant increase in V1V2 length over time was not seen in the PBMC compartment. These observations are consistent with the presence of archived genotypes from earlier times during the course of infection within the PBMC compartment. We also note that genotypes present in plasma may emanate from other cellular compartments in addition to PBMC, and may therefore reflect somewhat different evolutionary pressures. However, a considerably greater number of V1V2 sequences were derived from plasma, and sample size may also account for some of the differences observed between these compartments.

Our model may help to explain a failure to find any significant difference in V1V2 length in a comparison of early and chronic HIV-1 subtype B sequences (including sequences from late-stage individuals) [19]. When we reanalyzed the data presented by Chohan [19] after separating subjects with stable chronic illness from subjects with AIDS (Figure S13), we observed a pattern of lengthening over time, followed by decline in late-stage illness, as reported here (See Text S1, section S7). Similarly, we may explain discordant results obtained on V1V2 length variation during transmission of HIV-1 subtypes C and B. While a trend towards shorter loops in recipients was seen in subtype C [45] but not B [46], [47], it is likely for methodological reasons that the subjects studied by Derdeyn were sampled at somewhat later times than those of Frost and Liu. Thus the sequences in the latter two studies would be expected to be a random sampling from the donor pool, while those of Derdeyn might reflect the expected shortening prior to the onset of an effective antibody response. Indeed, when we examine a much larger set of subtype A and C transmission pairs from East Africa with more precisely known sampling times obtained soon after transmission, it is difficult to appreciate any consistent pattern of V1V2 length change (See Text S1, section S8 and Figure S14). Thus there may be no need to infer separate mechanisms for different HIV-1 subtypes and modes of transmission.
In addition, we may also explain a trend of increasing V1V2 length by calendar year. If shorter and less glycosylated V1V2 were always selected during transmission, transmission from donors in early infection would maintain a constant V1V2 length within the epidemic, whereas if all new cases were acquired from chronically infected hosts, this increase of V1V2 length by calendar year could be dramatic. However, most studies suggest that about half of transmission events involve subjects in early infection [46], [75], [76], consistent with the moderate trend we observed. Alternatively, the temporal trends we have observed could represent a gradual adaptation by HIV-1 to host the host environment at the population level, a hypothesis that has been proposed by several investigators with respect to mutational escape from HLA-restricted CTL epitopes [77]–[79].
Finally, our results imply that the polymorphisms seen in V1V2 reflect the ability of the host to mount a meaningful immunological response, rather than virologic features that dictate the course of illness. That is, we argue that V1V2 length change is a consequence of environmental selective pressure rather than a causative factor in disease progression.
Supporting Information
Zdroje
1. StarcichBR
HahnBH
ShawGM
McNeelyPD
ModrowS
1986 Identification and characterization of conserved and variable regions in the envelope gene of HTLV-III/LAV, the retrovirus of AIDS. Cell 45 637 648
2. WilleyRL
RutledgeRA
DiasS
FolksT
TheodoreT
1986 Identification of conserved and divergent domains within the envelope gene of the acquired immunodeficiency syndrome retrovirus. Proc Natl Acad Sci USA 83 5038 5042
3. ModrowS
HahnBE
ShawGM
GalloRC
Wong-StaalF
1987 Computer-assisted analysis of envelope protein sequences of seven human immunodeficiency virus isolates: Prediction of antigenic epitopes in conserved and variable regions. J Virol 61 570 578
4. WoodN
BhattacharyaT
KeeleBF
GiorgiE
LiuM
2009 HIV evolution in early infection: selection pressures, patterns of insertion and deletion, and the impact of APOBEC. PLoS Pathog 5 e1000414
5. CocchiF
DeVicoAL
Garzino-DemoA
CaraA
GalloRC
1996 The V3 domain of the HIV-1 gp120 envelope glycoprotein is critical for chemokine-mediated blockade of infection [see comments]. Nat Med 2 1244 1247
6. FengY
BroderCC
KennedyPE
BergerEA
1996 HIV-1 entry cofactor: functional cDNA cloning of a seven-transmembrane, G protein-coupled receptor. Science 272 872 877
7. SpeckRF
WehrlyK
PlattEJ
AtchisonRE
CharoIF
1997 Selective employment of chemokine receptors as human immunodeficiency virus type 1 coreceptors determined by individual amino acids within the envelope V3 loop. J Virol 71 7136 7139
8. GoudsmitJ
DebouckC
MeloenRH
SmitL
BakkerM
1988 Human immunodeficiency virus type 1 neutralization epitope with conserved architecture elicits early type-specific antibodies in experimentally infected chimpanzees. ProcNatlAcadSciUSA 85 4478 4482
9. JavaherianK
LangloisAJ
McDanalC
RossKL
EcklerLI
1989 Principal neutralizing domain of the human immunodeficiency virus type 1 envelope protein. ProcNatlAcadSciUSA 86 6768 6772
10. LuoL
LiY
ChangJS
ChoSY
KimTY
1998 Induction of V3-specific cytotoxic T lymphocyte responses by HIV gag particles carrying multiple immunodominant V3 epitopes of gp120. Virology 240 316 325
11. WatanabeN
McAdamSN
BoysonJE
PiekarczykMS
YasutomiY
1994 A simian immunodeficiency virus envelope V3 cytotoxic T-lymphocyte epitope in rhesus monkeys and its restricting major histocompatibility complex class I molecule Mamu-A*02. J Virol 68 6690 6696
12. HartleyO
KlassePJ
SattentauQJ
MooreJP
2005 V3: HIV's switch-hitter. AIDS Res Hum Retroviruses 21 171 189
13. HillMD
LorenzoE
KumarA
2004 Changes in the human immunodeficiency virus V3 region that correspond with disease progression: a meta-analysis. Virus Res 106 27 33
14. IdaS
GatanagaH
ShiodaT
NagaiY
KobayashiN
1997 HIV type 1 V3 variation dynamics in vivo: Long-term persistence of non-syncytium-inducing genotypes and transient presence of syncytium-inducing genotypes during the course of progressive AIDS. AIDS Res and Human Retrovir 13 1597 1609
15. PalmerC
BalfeP
FoxD
MayJC
FrederikssonR
1996 Functional characterization of the V1V2 region of human immunodeficiency virus type 1. Virology 220 436 449
16. MasciotraS
OwenSM
RudolphD
YangC
WangB
2002 Temporal relationship between V1V2 variation, macrophage replication, and coreceptor adaptation during HIV-1 disease progression. Aids 16 1887 1898
17. KitrinosKM
HoffmanNG
NelsonJA
SwanstromR
2003 Turnover of env variable region 1 and 2 genotypes in subjects with late-stage human immunodeficiency virus type 1 infection. J Virol 77 6811 6822
18. ShiodaT
OkaS
XinX
LiuH
HarukuniR
1997 In vivo sequence variability of human immunodeficiency virus type 1 envelope gp120: association of V2 extension with slow disease progression. J Virol 71 4871 4881
19. ChohanB
LangD
SagarM
KorberB
LavreysL
2005 Selection for human immunodeficiency virus type 1 envelope glycosylation variants with shorter V1-V2 loop sequences occurs during transmission of certain genetic subtypes and may impact viral RNA levels. J Virol 79 6528 6531
20. SagarM
WuX
LeeS
OverbaughJ
2006 Human immunodeficiency virus type 1 V1-V2 envelope loop sequences expand and add glycosylation sites over the course of infection, and these modifications affect antibody neutralization sensitivity. J Virol 80 9586 9598
21. ChackerianB
RudenseyLM
OverbaughJ
1997 Specific N-linked and O-linked glycosylation modifications in the envelope V1 domain of simian immunodeficiency virus variants that evolve in the host alter recognition by neutralizing antibodies. J Virol 71 7719 7727
22. KwongPD
WyattR
RobinsonJ
SweetRW
SodroskiJ
1998 Structure of an HIV gp120 envelope glycoprotein in complex with the CD4 receptor and a neutralizing human antibody. Nature 393 648 659
23. ChenB
VoganEM
GongH
SkehelJJ
WileyDC
2005 Determining the structure of an unliganded and fully glycosylated SIV gp120 envelope glycoprotein. Structure 13 197 211
24. CartierL
HartleyO
Dubois-DauphinM
KrauseKH
2005 Chemokine receptors in the central nervous system: role in brain inflammation and neurodegenerative diseases. Brain Res Brain Res Rev 48 16 42
25. AndewegA
LeeflangP
OsterhausA
BoschM
1993 Both the V2 and V3 regions of the human immunodeficiency virus type 1 surface glycoprotein functionally interact with other envelope regions in syncytium formation. J Virol 67 3232 3239
26. GroeninkM
FouchierRAM
BroersenS
BakerCH
KootM
1993 Relation of phenotype evolution of HIV-1 to envelope V2 configuration. Science 260 1513 1516
27. KoitoA
HarroweG
LevyJA
Cheng-MayerC
1994 Functional role of the V1/V2 region of human immunodeficiency virus type 1 envelope glycoprotein gp120 in infection of primary macrophages and soluble CD4 neutralization. J Virol 68 2253 2259
28. O'BrienWA
KoyanagiY
NamazieA
ZhaoJQ
DiagneA
1990 HIV-1 tropism for mononuclear phagocytes can be determined by regions of gp120 outside the CD4-binding domain. Nature 348 69 73
29. SullivanN
ThaliM
FurmanC
HoDD
SodroskiJ
1993 Effect of amino acid changes in the V1/V2 region of the human immunodeficiency virus type 1 gp120 glycoprotein on subunit association, syncytium formation, and recognition by a neutralizing antibody. J Virol 67 3674 3679
30. WesterveltP
TrowbridgeDB
EpsteinLG
BlumbergBM
LiY
1992 Macrophage tropism determinants of human immunodeficiency virus type 1 in vivo. J Virol 66 2577 2582
31. TooheyK
WehrlyK
NishioJ
PerrymanS
ChesebroB
1995 Human immunodeficiency virus envelope V1 and V2 regions influence replication efficiency in macrophages by affecting virus spread. Virology 213 70 79
32. WangN
ZhuT
HoDD
1995 Sequence diversity of V1 and V2 domains of gp120 from human immunodeficiency virus type 1: lack of correlation with viral phenotype. J Virol 69 2708 2715
33. PastoreC
NedellecR
RamosA
PontowS
RatnerL
2006 Human immunodeficiency virus type 1 coreceptor switching: V1/V2 gain-of-fitness mutations compensate for V3 loss-of-fitness mutations. J Virol 80 750 758
34. BenichouS
LegrandR
NakagawaN
FaureT
TraincardF
1992 Identification of a neutralizing domain in the external envelope glycoprotein of simian immunodeficiency virus. AIDS Res Hum Retroviruses 8 1165 1170
35. KentKA
RudE
CorcoranT
PowellC
ThiriartC
1992 Identification of two neutralizing and 8 non-neutralizing epitopes on simian immunodeficiency virus envelope using monoclonal antibodies. AIDS Res Hum Retroviruses 8 1147 1151
36. MatsumiS
MatsushitaS
YoshimuraK
JavaherianK
TakatsukiK
1995 Neutralizing monoclonal antibody against a external envelope glycoprotein (gp110) of SIVmac251. AIDS Res Hum Retroviruses 11 501 508
37. JurkiewiczE
HunsmannG
SchaffnerJ
NissleinT
LukeW
1997 Identification of the V1 region as a linear neutralizing epitope of the simian immunodeficiency virus SIVmac envelope glycoprotein. J Virol 71 9475 9481
38. PinterA
HonnenWJ
HeY
GornyMK
Zolla-PaznerS
2004 The V1/V2 domain of gp120 is a global regulator of the sensitivity of primary human immunodeficiency virus type 1 isolates to neutralization by antibodies commonly induced upon infection. J Virol 78 5205 5215
39. LamersS
SleasmanJW
SheJX
BarrieKA
PomeroySM
1993 Independent variation and positive selection in env V1-V2 domains within maternal-infant strains of human immunodeficiency virus type-1 in vivo. JVirol 67 3951 3960
40. RybarczykBJ
MontefioriD
JohnsonPR
WestA
JohnstonRE
2004 Correlation between env V1/V2 region diversification and neutralizing antibodies during primary infection by simian immunodeficiency virus sm in rhesus macaques. J Virol 78 3561 3571
41. FrostSD
WrinT
SmithDM
PondSL
LiuY
2005 Neutralizing antibody responses drive the evolution of human immunodeficiency virus type 1 envelope during recent HIV infection. Proc Natl Acad Sci U S A 102 18514 18519
42. LiB
DeckerJM
JohnsonRW
Bibollet-RucheF
WeiX
2006 Evidence for potent autologous neutralizing antibody titers and compact envelopes in early infection with subtype C human immunodeficiency virus type 1. J Virol 80 5211 5218
43. JohnsonWE
MorganJ
ReitterJ
PufferBA
CzajakS
2002 A replication-competent, neutralization-sensitive variant of simian immunodeficiency virus lacking 100 amino acids of envelope. J Virol 76 2075 2086
44. CaoJ
SullivanN
DesjardinE
ParolinC
RobinsonJ
1997 Replication and neutralization of human immunodeficiency virus type 1 lacking the V1 and V2 variable loops of the gp120 envelope glycoprotein. J Virol 71 9808 9812
45. DerdeynCA
DeckerJM
Bibollet-RucheF
MokiliJL
MuldoonM
2004 Envelope-constrained neutralization-sensitive HIV-1 after heterosexual transmission. Science 303 2019 2022
46. LiuY
CurlinME
DiemK
ZhaoH
GhoshAK
2008 Env length and N-linked glycosylation following transmission of human immunodeficiency virus Type 1 subtype B viruses. Virology 374 229 233
47. FrostSD
LiuY
PondSL
ChappeyC
WrinT
2005 Characterization of human immunodeficiency virus type 1 (HIV-1) envelope variation and neutralizing antibody responses during transmission of HIV-1 subtype B. J Virol 79 6523 6527
48. HughesES
BellJE
SimmondsP
1997 Investigation of population diversity of human immunodeficiency virus type 1 in vivo by nucleotide sequencing and length polymorphism analysis of the V1/V2 hypervariable region of env. J Gen Virol 78 (Pt 11) 2871 2882
49. SchackerT
CollierAC
HughesJ
SheaT
CoreyL
1996 Clinical and epidemiologic features of primary HIV infection. Ann Intern Med 125 257 264
50. KaslowRA
OstrowDG
DetelsR
PhairJP
PolkBF
1987 The Multicenter AIDS Cohort Study: rationale, organization, and selected characteristics of the participants. Am J Epidemiol 126 310 318
51. PossM
RodrigoAG
GosinkJJ
LearnGH
de Vange PanteleeffD
1998 Evolution of envelope sequences from the genital tract and peripheral blood of women infected with clade A human immunodeficiency virus type 1. J Virol 72 8240 8251
52. DacheuxL
MoreauA
Ataman-OnalY
BironF
VerrierB
2004 Evolutionary dynamics of the glycan shield of the human immunodeficiency virus envelope during natural infection and implications for exposure of the 2G12 epitope. J Virol 78 12625 12637
53. LiuY
McNevinJ
CaoJ
ZhaoH
GenowatiI
2006 Selection on the human immunodeficiency virus type 1 proteome following primary infection. J Virol 80 9519 9529
54. TrkolaA
KuhmannSE
StrizkiJM
MaxwellE
KetasT
2002 HIV-1 escape from a small molecule, CCR5-specific entry inhibitor does not involve CXCR4 use. Proc Natl Acad Sci U S A 99 395 400
55. McDonaldRA
MayersDL
ChungRC
WagnerKF
Ratto-KimS
1997 Evolution of human immunodeficiency virus type 1 env sequence variation in patients with diverse rates of disease progression and T-cell function. J Virol 71 1871 1879
56. ShankarappaR
MargolickJB
GangeSJ
RodrigoAG
UpchurchD
1999 Consistent viral evolutionary changes associated with the progression of human immunodeficiency virus type 1 infection. J Virol 73 10489 10502
57. TobinNH
LearnGH
HolteSE
WangY
MelvinAJ
2005 Evidence that low-level viremias during effective highly active antiretroviral therapy result from two processes: expression of archival virus and replication of virus. J Virol 79 9625 9634
58. RodrigoAG
GorackePC
RowhanianK
MullinsJI
1997 Quantitation of target molecules from polymerase chain reaction-based limiting dilution assays. AIDS Res and Hum Retrovir 13 737 742
59. AltfeldM
RosenbergES
ShankarappaR
MukherjeeJS
HechtFM
2001 Cellular immune responses and viral diversity in individuals treated during acute and early HIV-1 infection. J Exp Med 193 169 180
60. DelwartEL
HerringB
RodrigoAG
MullinsJI
1995 Genetic Subtyping of Human Immunodeficiency Virus Using a Heteroduplex Mobility Assay. PCR Methods and Applications 4 S202 216
61. ThompsonJD
HigginsDG
GibsonTJ
1994 CLUSTAL W: improving the sensitivity of progressive multiple sequence alignment through sequence weighting, position-specific gap penalties and weight matrix choice. Nucleic Acids Res 22 4673 4680
62. JensenMA
LiFS
van 't WoutAB
NickleDC
ShrinerD
2003 Improved coreceptor usage prediction and genotypic monitoring of R5-to-X4 transition by motif analysis of human immunodeficiency virus type 1 env V3 loop sequences. J Virol 77 13376 13388
63. LengauerT
SanderO
SierraS
ThielenA
KaiserR
2007 Bioinformatics prediction of HIV coreceptor usage. Nat Biotechnol 25 1407 1410
64. PillaiS
GoodB
RichmanD
CorbeilJ
2003 A new perspective on V3 phenotype prediction. AIDS Res Hum Retroviruses 19 145 149
65. BoisvertS
MarchandM
LavioletteF
CorbeilJ
2008 HIV-1 coreceptor usage prediction without multiple alignments: an application of string kernels. Retrovirology 5 110
66. BuschMP
SattenGA
1997 Time course of viremia and antibody seroconversion following human immunodeficiency virus exposure. Am J Med 102 117 124; discussion 125–116
67. ConstantineNT
van der GroenG
BelseyEM
TamashiroH
1994 Sensitivity of HIV-antibody assays determined by seroconversion panels. Aids 8 1715 1720
68. HanleyJA
NegassaA
EdwardesMD
ForresterJE
2003 Statistical analysis of correlated data using generalized estimating equations: an orientation. Am J Epidemiol 157 364 375
69. BurtonP
GurrinL
SlyP
1998 Extending the simple linear regression model to account for correlated responses: an introduction to generalized estimating equations and multi-level mixed modelling. Stat Med 17 1261 1291
70. ZegerSL
LiangKY
1986 Longitudinal data analysis for discrete and continuous outcomes. Biometrics 42 121 130
71. EdmonsonP
Murphey-CorbM
MartinLN
DelahuntyC
HeeneyJ
1998 Evolution of a Simian Immunodeficiency Virus pathogen. J Virol 72 405 414
72. BunnikEM
PisasL
van NuenenAC
SchuitemakerH
2008 Autologous neutralizing humoral immunity and evolution of the viral envelope in the course of subtype B human immunodeficiency virus type 1 infection. J Virol 82 7932 7941
73. LiuSL
RodrigoAG
ShankarappaR
LearnGH
HsuL
1996 HIV quasispecies and resampling. Science 273 415 416
74. DelwartEL
PanH
SheppardHW
WolpertD
NeumannAU
1997 Slower evolution of human immunodeficiency virus type 1 quasispecies during progression to AIDS. J Virol 71 7498 7508
75. PilcherCD
TienHC
EronJJJr
VernazzaPL
LeuSY
2004 Brief but Efficient: Acute HIV Infection and the Sexual Transmission of HIV. J Infect Dis 189 1785 1792
76. WawerMJ
GrayRH
SewankamboNK
SerwaddaD
LiX
2005 Rates of HIV-1 transmission per coital act, by stage of HIV-1 infection, in Rakai, Uganda. J Infect Dis 191 1403 1409
77. KawashimaY
PfafferottK
FraterJ
MatthewsP
PayneR
2009 Adaptation of HIV-1 to human leukocyte antigen class I. Nature 458 641 645
78. MooreCB
JohnM
JamesIR
ChristiansenFT
WittCS
2002 Evidence of HIV-1 adaptation to HLA-restricted immune responses at a population level. Science 296 1439 1443
79. YusimK
KesmirC
GaschenB
AddoMM
AltfeldM
2002 Clustering patterns of cytotoxic T-lymphocyte epitopes in human immunodeficiency virus type 1 (HIV-1) proteins reveal imprints of immune evasion on HIV-1 global variation. J Virol 76 8757 8768
80. PossM
MartinHL
KreissJK
GranvilleL
ChohanB
1995 Diversity in virus populations from genital secretions and peripheral blood from women recently infected with human immunodeficiency virus type 1. J Virol 69 8118 8122
Štítky
Hygiena a epidemiologie Infekční lékařství LaboratořČlánek vyšel v časopise
PLOS Pathogens
2010 Číslo 12
- Parazitičtí červi v terapii Crohnovy choroby a dalších zánětlivých autoimunitních onemocnění
- Vakcíny proti klíšťové encefalitidě
- Kdy je nejlepší očkovat
- Možné vedlejší účinky očkování
- Imunogenita vakcín
Nejčtenější v tomto čísle
- HIV-1 Envelope Subregion Length Variation during Disease Progression
- Coming of Age—Sexual Reproduction in Species
- Evidence That Intracellular Stages of Utilize Amino Sugars as a Major Carbon Source
- Compartmentation of Redox Metabolism in Malaria Parasites
Zvyšte si kvalifikaci online z pohodlí domova
Mazová zátka a její řešení
nový kurzVšechny kurzy