
Chronic Kidney Disease in Primary Care: Outcomes after Five Years in a Prospective Cohort Study
In this prospective cohort study, Adam Shardlow and colleagues report on the progression of chronic kidney disease over 5 years among patients in primary care.
Published in the journal:
. PLoS Med 13(9): e32767. doi:10.1371/journal.pmed.1002128
Category:
Research Article
doi:
https://doi.org/10.1371/journal.pmed.1002128
Summary
In this prospective cohort study, Adam Shardlow and colleagues report on the progression of chronic kidney disease over 5 years among patients in primary care.
Introduction
In the UK and many other countries, the majority of people with chronic kidney disease (CKD) are diagnosed and managed in primary care clinics without ever being referred to a nephrologist. In contrast, most detailed studies investigating the risks associated with CKD have been led by nephrologists, resulting in a predominantly secondary care perspective. Consequently, guidelines based on these studies tend to emphasize the risk of end-stage kidney disease (ESKD) and the need for timely referral to facilitate preparation for renal replacement therapy. Landmark epidemiological studies have highlighted the importance of diagnosing CKD because the abnormalities that define CKD (reduced glomerular filtration rate [GFR] and albuminuria) are powerful independent risk factors for multiple adverse outcomes, including progression of CKD, development of ESKD [1,2], acute kidney injury (AKI) [3], excess cardiovascular events (CVEs) [4], and increased mortality [5]. Nevertheless, the prognosis associated with CKD is extremely heterogeneous, and the risk of adverse outcomes varies widely according to the population studied. For example, population-based studies have reported that the majority of people with CKD are at low risk of developing ESKD [6], whereas studies of people known to have CKD and managed in secondary care report ESKD as a common outcome [7,8].
Many previous studies have understandably focused on risks associated with CKD [1–5]. However, it is arguably as important to study positive outcomes such as stable CKD or remission of CKD so that people at low risk for adverse outcomes can be spared unnecessary intervention and referral to nephrology clinics. Interestingly, there is currently no consensus on when CKD should be considered no longer present (in remission), and there is therefore a lack of readily comparable data to indicate how frequently remission occurs or the factors that contribute to it.
The majority of people with CKD in primary care are elderly, and albuminuria is present in only a minority [9], suggesting that overall this population is at low risk for progression to ESKD. In this prospective cohort study, we sought to study in detail the natural history of CKD in primary care to better inform the appropriate emphasis for future guidance on caring for people with CKD in a primary care setting.
Methods
Ethics
The Renal Risk in Derby (RRID) study was approved by the Nottingham Research Ethics Committee 1. All participants provided written, informed consent. The RRID study complies with the Declaration of Helsinki and the principles of Good Clinical Practice.
Participants
Detailed methods for the RRID study have been published previously [9]. In brief, participants were individually recruited from 32 primary care clinics in Derbyshire, UK, between 2008 and 2010 and prospectively studied. In total, 8,280 people were invited from registers of people with CKD stage 3, 1,822 attended baseline visits, and 1,741 were eligible to participate (Fig 1). Participants were aged >18 y and at least two estimated GFR (eGFR) results (derived from the Modification of Diet in Renal Disease study [MDRD] equation) of 30–59 ml/min/1.73 m2, more than 90 d apart, were required to be eligible [10]. People judged to have a life expectancy of less than 1 y, unable to attend study visits, or with a solid organ transplant were excluded.

Study Visits
Visits were conducted at baseline and repeated at 1 and 5 y. Prior to each visit, participants completed a background questionnaire covering demographic variables and social, medical, and medication history. Questionnaires were reviewed at study visits and clarified as required. Height, weight, and waist and hip circumference were measured. Three blood pressure measurements that differed by <10% were taken using an oscillometric device (UA-767 Plus 30, A&D Medical) after at least 5 min rest.
Laboratory Methods
Participants were asked to abstain from eating meat for 12 h prior to study visits to avoid confounding the serum creatinine assay. Blood and urine samples were analysed in a single clinical laboratory at the Royal Derby Hospital for standard haematological and biochemical variables. Creatinine was measured using the Jaffe method, standardized against an isotope dilution mass spectrometry method. GFR was estimated using the Chronic Kidney Disease Epidemiology Collaboration (CKD-EPI) equation in the primary analysis, with an additional sensitivity performed using the MDRD equation. The average urine albumin-to-creatinine ratio (uACR) from three consecutive early morning specimens was used for analysis.
Thirty-one participants who were unable to attend for year 5 study visits were able to submit blood and urine samples specifically for the study. For 176 participants, unable to either attend for a study visit or to submit study samples, we incorporated blood and uACR results taken for clinical purposes into the dataset. These were selected to be less than 6 mo from the year 5 visit due date. Samples taken during hospital admissions were not used.
Mortality Data
Date and cause of death as stated on death certificates were obtained from the Office of National Statistics via the Health and Social Care Information Centre (HSCIC). Independent of each other and without knowledge of other participant data, three investigators (AS, RJF, and MWT) assessed the information on death certificates and classified cause of death into four categories (cardiovascular, malignancy, infection, and other). Differences in classification were subsequently resolved by discussion.
Endpoint Definitions
We used Kidney Disease: Improving Global Outcomes (KDIGO) definitions for CKD, CKD staging, and CKD progression [10]. Progression of CKD was defined as a 25% decline in GFR, coupled with a worsening of GFR category, or an increase in albuminuria category. Our prespecified endpoint from study design (development of ESKD or doubling of serum creatinine) was not used because of a very small number of events noted during year 5 follow-up. The KDIGO definition was used as an internationally agreed standard of CKD progression that was observed more frequently in our study population. We defined CKD remission as the presence of both eGFR >60 ml/min/1.73 m2 and uACR <3 mg/mmol at any study visit in an individual who had previously met KDIGO diagnostic criteria for CKD.
Statistical Analysis
Analysis was performed using IBM SPSS version 22. Urine ACR was logarithmically transformed prior to multivariable analysis. Outcomes were analysed using binomial logistic regression models. For analyses of progression and remission, participants with a complete year 5 outcome (eGFR and uACR values or a date of death before the year 5 visit) were included. Basic models were initially produced including baseline age, eGFR log uACR, and sex. Variables that were significantly associated with the outcome on univariable analysis were then added in groups, according to biological and clinical relevance. The final models included all variables that were significantly associated with the outcome in previous models and gave the best discrimination. For each model, predicted probabilities were used to draw receiver operating characteristic (ROC) curves, and area under the ROC curve (AUROC) was used to compare models. Survival analysis was performed using Cox proportional hazards models. All 1,741 participants were included in the survival analysis. Death prior to a year 5 visit was considered an event. Participants were censored at date of year 5 visit, date of first dialysis, or 5 y from the time of baseline visit if neither of these events occurred. Three participants underwent unilateral nephrectomy during the study follow-up period and therefore were excluded from analysis of CKD progression and remission.
Results
Cohort Description and Outcomes
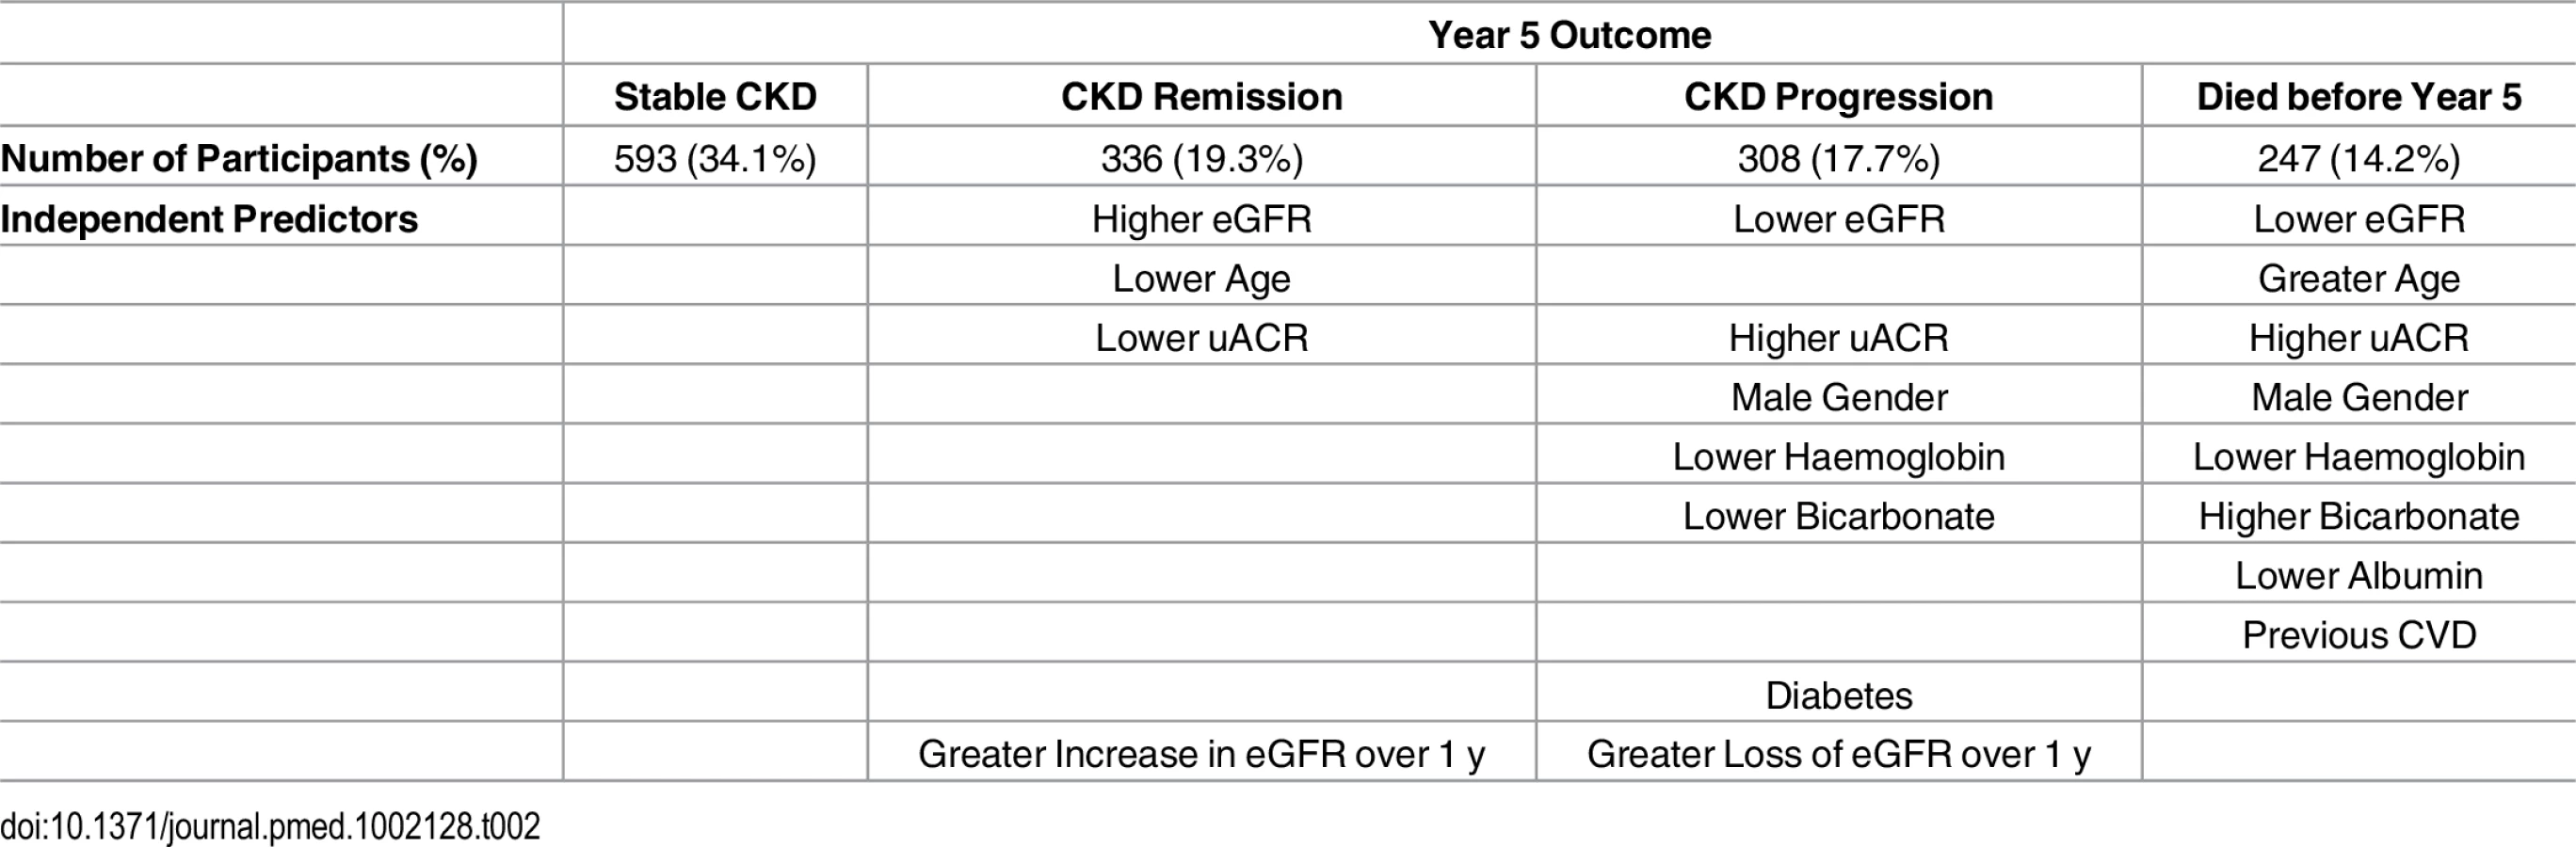
Description of the cohort at baseline has previously been published [9]. Key baseline variables are given in Table 1 for the whole cohort and groups according to outcome. Data on renal outcomes at 5 y were obtained in 1,484 participants (85.2%), and survival data were available in all participants (from the Office of National Statistics). Two hundred and forty-seven of 1,741 people (14.2%) died prior to their year 5 visit, representing an age-standardised mortality rate per year of 4.2% in males and 2.2% in females. This compares to a UK age-standardised mortality rate of 3.9% and 2.9% in males and females, respectively [11]. Four participants (0.2%) reached ESKD, and 308 (17.7%) evidenced progression of CKD by KDIGO criteria. However, 593 participants (34.1%) had stable CKD, and 336 (19.3%) met our criteria for CKD remission (Table 1). Year 5 outcomes are reported in Table 2 and summarised in S1 Fig. Outcomes are further subdivided by baseline CKD category in Table 3 and S2 Fig.


Associations with Progression of CKD
A basic multivariable model that included baseline eGFR, sex, uACR, and age as predictors of CKD progression was associated with an AUROC of 0.69 (95% CI 0.66–0.74). The addition of baseline haemoglobin, bicarbonate, diabetes status, and systolic blood pressure (SBP) produced a model with an AUROC of 0.73 (95% CI 0.69–0.76). In this model, baseline age was not statistically significant. The impact of the change at 1 y in SBP, diastolic blood pressure (DBP), and eGFR was also assessed. Change in eGFR at year 1 was a significant determinant of CKD progression, but change in SBP and DBP at 1 y did not enter the model (Table 4). When the recently validated four-variable Kidney Failure Risk Equation (KFRE) [2,12] was applied to our study population at baseline, the majority were assessed to be at extremely low risk (median 5-y probability of ESKD = 0.08%). In the four participants who did progress to ESKD, predicted 5-y risks at baseline were 54.0%, 33.1%, 14.9%, and 9.0%, respectively.

Associations with All-Cause Mortality
Cause of death was classified as cardiovascular in 94 cases (38.1% of 247 deaths), malignancy in 63 (25.5%), infection in 50 (20.2%), “other” in 34 (13.8%), and “no data available” in 6 (2.4%). Two people died before year 5 follow-up but after the development of ESKD. Participants who died tended to be older than other outcome groups and had lower eGFR and higher uACR on average at baseline (Table 1). Cox proportional hazards models identified age, male sex, baseline eGFR, log uACR, haemoglobin, albumin, and bicarbonate as independent predictors of death (Table 5). Change in eGFR at year 1 did not enter the model (hazard ratio [HR] = 1.00, p = 0.67).

Associations with CKD Remission
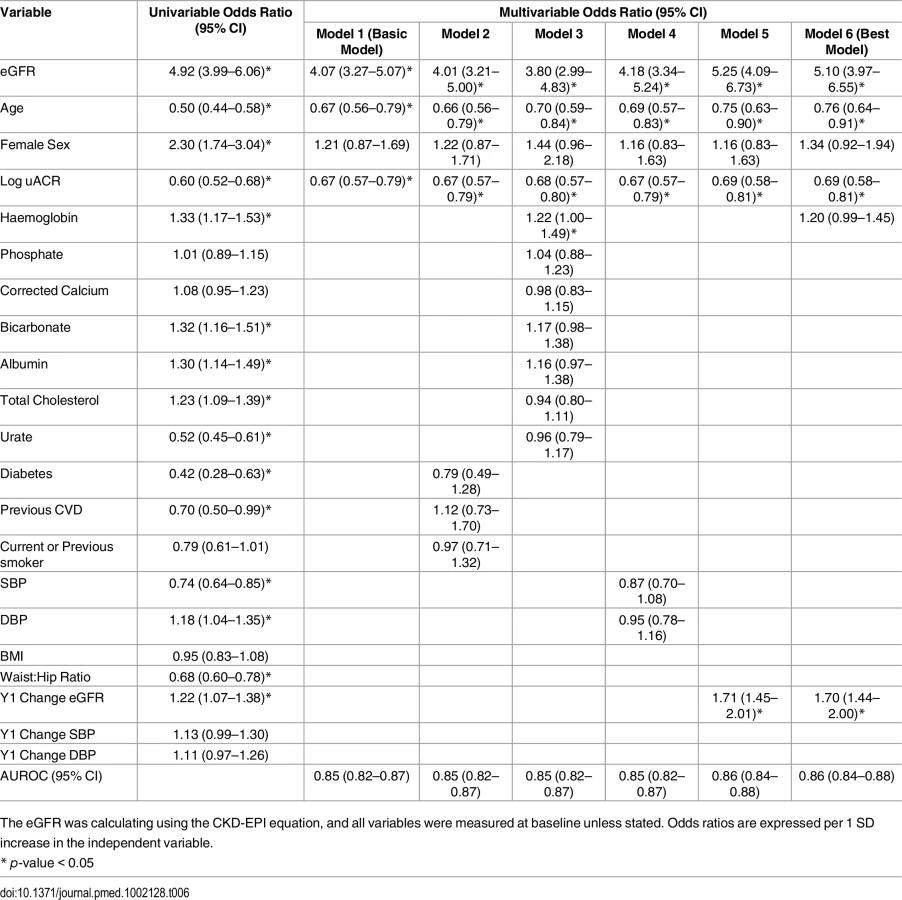
At baseline, participants who evidenced remission at year 5 had a higher mean eGFR and a lower median uACR, compared to the rest of the study cohort (Table 1). In addition, participants with remission were younger and evidenced a higher proportion of females (Table 6). A basic multivariable model, including age, sex, eGFR, and log uACR as independent variables, was associated with an AUROC of 0.85 (95% CI 0.82–0.87) (Table 6). This was improved to 0.86 (95% CI 0.84–0.88) by addition of the change in eGFR seen at 1 y and baseline haemoglobin. There was no significant difference in weight change between renal outcome groups (Table 1), nor did weight change enter multivariable models as a predictor of remission.
The number of participants at each time point who demonstrated CKD remission is illustrated in Fig 2. Despite meeting KDIGO diagnostic criteria for CKD stage 3 prior to study entry, 496 participants (28.5%) no longer met the criteria for a diagnosis of CKD at the baseline study visit. Of this group, 224 (45.2%) remained in remission at year 5. Remission at 5 y was most likely in the group with remission at both baseline and year 1 (odds ratio relative to those with no remission at baseline and year 1 = 23.6, 95% CI 16.5–33.9, p < 0.001). Those with remission at baseline only (OR = 5.9, 95%, CI 3.8–9.2, p < 0.001) and year 1 only (OR = 7.1, 95% CI 4.3–11.8, p < 0.001) showed intermediate likelihood of remission at 5 y. The group with remission at baseline and year 1 also evidenced lower mortality (3.2%) over 5 y compared with those with remission at baseline only (5.0%) and those with remission at year 1 only (5.3%). Mortality was significantly lower in all groups demonstrating remission at any time point compared to the group who met criteria for CKD at both baseline and year 1 (15.7%; log-rank test p < 0.001).

Sensitivity Analysis
Repeat analyses using the MDRD formula to estimate GFR revealed similar numbers of participants reaching each outcome. Predictors of different outcomes were similar using MDRD eGFR to those presented above using CKD-EPI eGFR (S1–S4 Tables).
Discussion
In this population with CKD stage 3 in primary care, the majority of whom did not meet criteria for referral to a nephrologist [13], we observed a very low incidence of ESKD over 5 y (0.2%), and only a minority evidenced progression of CKD as defined by KDIGO (17.7%). Similar to population-based studies, the risk of all-cause (14.2%) and cardiovascular mortality (5.4%) greatly exceeded the risk of ESKD [1,14]. Stable CKD (34.1%) was more common than progression, and a substantial minority evidenced remission of CKD (19.3%).
Our data confirm in a primary care population the previous findings that reduced GFR and albuminuria are important independent risk factors for adverse outcomes [1–4]. Other risk factors were similar to those reported in previous studies [15]. In univariable analysis, diabetes was a significant predictor of CKD progression and mortality. After multivariable adjustment, diabetes remained an independent predictor only of CKD progression. Nevertheless, as diabetes was a predictor of CKD progression, it may have adversely affected survival indirectly through its effect on GFR. Lower haemoglobin independently predicted both CKD progression and all-cause mortality [16]. As reported recently by the Chronic Renal Insufficiency Cohort (CRIC) study investigators, lower serum bicarbonate was associated with CKD progression [17]. Serum albumin was an independent predictor of mortality, but not CKD progression. Change in GFR at 1 y was an independent determinant of CKD progression at 5 y. This observation confirms that annual assessment of GFR is useful for monitoring and as a marker of prognosis even in people with relatively mild CKD. Overall, the risk of progression to ESKD was extremely low over 5 y, and less severe CKD progression was observed in only a minority. The KFRE successfully identified four participants who developed ESKD as moderate or high risk, but risk prediction tools that predict risk over longer periods or give an estimate of “time to ESKD” may be more useful in primary care.
Despite globally applied criteria for the diagnosis of CKD, there is no consensus on when CKD should be considered no longer present (in remission). Therefore, there is a lack of readily comparable data to indicate how frequently remission occurs or the factors that contribute to it. Using a definition based on lack of any diagnostic criteria for CKD, we observed remission in a substantial proportion of people who met the KDIGO criteria for CKD prior to the baseline study visit. We propose that this observation was in part due to diagnostic considerations. We recruited participants based on previous routine GFR values estimated using the MDRD equation. Prior to study visits, participants were asked not to eat meat for 12 h, and for analysis, the more accurate CKD-EPI formula (published in 2009, after initiation of the study) was used to estimate GFR. Thus, our data illustrate the importance of applying the most accurate equation to estimate GFR and avoidance of meat prior to testing (previous studies have reported that meat ingestion can increase the serum creatinine by as much as 20 μmol/L) [18]. Nevertheless, there were participants who met the diagnostic criteria for CKD at the baseline visit who evidenced remission at 1 and 5 y (Fig 2). We propose that changes in medication or hydration status and healing of mild kidney damage may have contributed to this remission. A further possibility is that loss of muscle mass with increasing age may result in a decrease in serum creatinine and a rise in eGFR, but this does not seem to have been a contributory factor since weight change was not associated with remission in this cohort. Improvement in eGFR over time has been reported previously in 41% of participants in a large database study (median 7 ml/min/1.73 m2 improvement over 2 y) [19]. This cohort had a similar mean age (76.1 y) to our study, but these participants did not necessarily meet formal definitions for CKD and included some people with an eGFR >60 ml/min/1.73 m2.
Together, these data make a strong case for an internationally agreed definition of CKD remission so that it can be studied in other populations. Furthermore, a definition of remission will allow some patients to be removed from CKD registers, which may have implications for their health and life insurance. We propose that remission should be defined (in persons previously diagnosed with CKD) as the absence of diagnostic criteria for CKD that persists for at least 1 y, since this was associated with a substantially higher likelihood of long-term remission than a single set of normal values. Remission at any time point was also associated with lower mortality risk. We have identified lower age, higher eGFR, and lower uACR as predictors of remission with good discrimination, and these simple variables may therefore be used to identify patients who should be reassessed for remission or who should perhaps be given a provisional rather than a firm diagnosis of CKD. It remains to be shown, however, whether those meeting CKD criteria for a short period prior to improvement carry any residual excess risk.
The benign prognosis observed in participants in CKD category G3a A1 raises the question of whether older people with mildly reduced GFR but no albuminuria should be labelled as having CKD at all. This is important because our data confirm that G3a A1 represents the largest group of those diagnosed with CKD in primary care (S2 Fig). It has been suggested that an age-calibrated definition of CKD should be applied to avoid labelling people with age-related GFR decline and low risk of adverse outcomes as having CKD. Based on an analysis of values in normal populations across the age spectrum and the risks associated with reduced GFR, it has been proposed that the GFR threshold for diagnosis of CKD in the absence of albuminuria in those over 65 y should be lowered from 60 to 45 ml/min/1.73 m2 [20]. Our data support this recommendation, though it should be noted that progression of CKD over 5 y was observed in 17.4% of those with G3a A1 at baseline, suggesting that monitoring of GFR and uACR in this group should continue.
Strengths and Limitations
Notable strengths of this study include use of strict KDIGO criteria for diagnosis of CKD stage 3 prior to study entry and detailed clinical characterisation of participants at each study visit. In this analysis, we have focussed on basic risk factors that would be easily measurable in clinical settings, but the use of novel biomarkers may improve risk prediction in the future.
Our study included predominantly white people, reflecting the demographic composition of the population of Derbyshire. In addition, the study population was elderly (mean age 72.9 ± 9.0 y), reflecting the higher prevalence of CKD in older people. Although our study population was generally representative of people with CKD cared for in primary care in the UK [21], the lack of ethnic diversity and relatively high age may limit application of our findings to populations with different ethnic composition or younger age. Recruitment commenced in 2008, and we therefore used the MDRD equation to diagnose CKD. The MDRD equation is known to underestimate GFR at higher levels of ≥60 ml/min/1.73 m2 and is less accurate than the CKD-EPI equation [22]. It is possible, therefore, that some participants were included who would not have been diagnosed with CKD were the CKD-EPI equation to have been used. Nevertheless, our study reflects a “real-world” situation with some people still having a diagnosis of CKD based on the MDRD equation. Sensitivity analyses using GFR estimated using the MDRD equation produced similar results to the primary analysis.
In this analysis, we used KDIGO definitions for CKD progression. The study protocol specified a definition of ESKD or doubling of serum creatinine as markers of progression, but these endpoints were met too infrequently to be useful for analysis of our cohort. Nevertheless, we believe that analysis using less severe CKD progression as an endpoint remains relevant because it has been shown that those with greater declines in eGFR are at higher future risk of ESKD and all-cause mortality [1].
Conclusions
We have observed, in a primary care setting, that the most common outcome associated with CKD stage 3 over 5 y was stable kidney function. Moreover, a significant minority of people evidenced CKD remission. Our data therefore suggest that management of CKD in primary care should focus principally on identifying the minority of people who are at high risk of adverse outcomes for intervention to slow CKD progression and reduce CVEs. Efforts should also be made to identify and reassure the majority who are at low risk of progression to ESKD. Consideration should be given to adopting an age-calibrated definition of CKD to avoid labelling a large group of people with age-related decline in GFR and low associated risk as having CKD. Nevertheless, robust mechanisms should be in place to identify the minority at high risk for developing ESKD to facilitate timely referral.
Supporting Information
Zdroje
1. Coresh J, Turin TC, Matsushita K, Sang Y, Ballew SH, Appel LJ, et al. Decline in estimated glomerular filtration rate and subsequent risk of end-stage renal disease and mortality. Jama. 2014;311(24):2518–31. doi: 10.1001/jama.2014.6634 24892770; PubMed Central PMCID: PMC4172342.
2. Tangri N, Stevens LA, Griffith J, Tighiouart H, Djurdjev O, Naimark D, et al. A predictive model for progression of chronic kidney disease to kidney failure. Jama. 2011;305(15):1553–9. doi: 10.1001/jama.2011.451 21482743.
3. James MT, Grams ME, Woodward M, Elley CR, Green JA, Wheeler DC, et al. A Meta-analysis of the Association of Estimated GFR, Albuminuria, Diabetes Mellitus, and Hypertension With Acute Kidney Injury. American journal of kidney diseases: the official journal of the National Kidney Foundation. 2015;66(4):602–12. doi: 10.1053/j.ajkd.2015.02.338 25975964.
4. Matsushita K, Coresh J, Sang Y, Chalmers J, Fox C, Guallar E, et al. Estimated glomerular filtration rate and albuminuria for prediction of cardiovascular outcomes: a collaborative meta-analysis of individual participant data. The lancet Diabetes & endocrinology. 2015;3(7):514–25. doi: 10.1016/S2213-8587(15)00040-6 26028594.
5. Go AS, Chertow GM, Fan D, McCulloch CE, Hsu CY. Chronic kidney disease and the risks of death, cardiovascular events, and hospitalization. The New England journal of medicine. 2004;351(13):1296–305. doi: 10.1056/NEJMoa041031 15385656.
6. Hallan SI, Dahl K, Oien CM, Grootendorst DC, Aasberg A, Holmen J, et al. Screening strategies for chronic kidney disease in the general population: follow-up of cross sectional health survey. BMJ. 2006;333(7577):1047. doi: 10.1136/bmj.39001.657755.BE 17062598; PubMed Central PMCID: PMCPMC1647344.
7. Hoefield RA, Kalra PA, Baker P, Lane B, New JP, O'Donoghue DJ, et al. Factors associated with kidney disease progression and mortality in a referred CKD population. American journal of kidney diseases: the official journal of the National Kidney Foundation. 2010;56(6):1072–81. Epub 2010/08/10. doi: 10.1053/j.ajkd.2010.06.010 20692750.
8. Yang W, Xie D, Anderson AH, Joffe MM, Greene T, Teal V, et al. Association of kidney disease outcomes with risk factors for CKD: findings from the Chronic Renal Insufficiency Cohort (CRIC) study. American journal of kidney diseases: the official journal of the National Kidney Foundation. 2014;63(2):236–43. Epub 2013/11/05. doi: 10.1053/j.ajkd.2013.08.028 24182662; PubMed Central PMCID: PMCPMC3946885.
9. McIntyre NJ, Fluck RJ, McIntyre CW, Taal MW. Risk profile in chronic kidney disease stage 3: older versus younger patients. Nephron Clinical practice. 2011;119(4):c269–76. doi: 10.1159/000329109 21921639.
10. KDIGO clinical practice guidelines for the evaluation and management of chronic kidney disease. Kidney International Supplements. 2013;(3):1–150.
11. https://www.ons.gov.uk/peoplepopulationandcommunity/birthsdeathsandmarriages/deaths. Accessed 29th May 2016
12. Tangri N, Grams ME, Levey AS, Coresh J, Appel LJ, Astor BC, et al. Multinational Assessment of Accuracy of Equations for Predicting Risk of Kidney Failure: A Meta-analysis. Jama. 2016;315(2):164–74. doi: 10.1001/jama.2015.18202 26757465.
13. McIntyre NJ, Fluck R, McIntyre C, Taal M. Treatment needs and diagnosis awareness in primary care patients with chronic kidney disease. The British journal of general practice: the journal of the Royal College of General Practitioners. 2012;62(597):e227–32. doi: 10.3399/bjgp12X636047 22520909; PubMed Central PMCID: PMC3310028.
14. O'Hare AM, Choi AI, Bertenthal D, Bacchetti P, Garg AX, Kaufman JS, et al. Age affects outcomes in chronic kidney disease. Journal of the American Society of Nephrology: JASN. 2007;18(10):2758–65. Epub 2007/09/15. doi: 10.1681/asn.2007040422 17855638.
15. Taal MW, Brenner BM. Predicting initiation and progression of chronic kidney disease: Developing renal risk scores. Kidney international. 2006;70(10):1694–705. doi: 10.1038/sj.ki.5001794 16969387.
16. Mohanram A, Zhang Z, Shahinfar S, Keane WF, Brenner BM, Toto RD. Anemia and end-stage renal disease in patients with type 2 diabetes and nephropathy. Kidney international. 2004;66(3):1131–8. doi: 10.1111/j.1523-1755.2004.00863.x 15327408.
17. Dobre M, Yang W, Chen J, Drawz P, Hamm LL, Horwitz E, et al. Association of serum bicarbonate with risk of renal and cardiovascular outcomes in CKD: a report from the Chronic Renal Insufficiency Cohort (CRIC) study. American journal of kidney diseases: the official journal of the National Kidney Foundation. 2013;62(4):670–8. doi: 10.1053/j.ajkd.2013.01.017 23489677; PubMed Central PMCID: PMC3701754.
18. Preiss DJ, Godber IM, Lamb EJ, Dalton RN, Gunn IR. The influence of a cooked-meat meal on estimated glomerular filtration rate. Ann Clin Biochem. 2007;44(Pt 1):35–42. doi: 10.1258/000456307779595995 17270090.
19. Hemmelgarn BR, Culleton BF, Ghali WA. Derivation and validation of a clinical index for prediction of rapid progression of kidney dysfunction. QJM. 2007;100(2):87–92. doi: 10.1093/qjmed/hcm001 17277316.
20. Delanaye P, Glassock RJ, Pottel H, Rule AD. An Age-Calibrated Definition of Chronic Kidney Disease: Rationale and Benefits. Clin Biochem Rev. 2016;37(1):17–26. 27057075; PubMed Central PMCID: PMCPMC4810758.
21. Lusignan S, Gallagher H, Jones S, Chan T, van Vlymen J, Tahir A, et al. Audit-based education lowers systolic blood pressure in chronic kidney disease: the Quality Improvement in CKD (QICKD) trial results. Kidney international. 2013;84(3):609–20. doi: 10.1038/ki.2013.96 23536132; PubMed Central PMCID: PMCPMC3778715.
22. Levey AS, Stevens LA, Schmid CH, Zhang YL, Castro AF 3rd, Feldman HI, et al. A new equation to estimate glomerular filtration rate. Annals of internal medicine. 2009;150(9):604–12. 19414839; PubMed Central PMCID: PMC2763564.
Štítky
Interní lékařstvíČlánek vyšel v časopise
PLOS Medicine
2016 Číslo 9
- Omeprazol a mechanismus hojení krvácení z peptického vředu
- Diosmin a hesperidin: Co ukazuje farmakokinetika?
- Genetický výzkum potvrdil asociaci mezi autismem a střevními obtížemi
- Intermitentní hladovění v prevenci a léčbě (nejen) civilizačních chorob
- Porovnání farmakologických vlastností mikronizovaného diosminu a hesperidinu v terapii chronické žilní insuficience a hemoroidů
Nejčtenější v tomto čísle
- Sex Differences in Tuberculosis Burden and Notifications in Low- and Middle-Income Countries: A Systematic Review and Meta-analysis
- International Criteria for Acute Kidney Injury: Advantages and Remaining Challenges
- Potential for Controlling Cholera Using a Ring Vaccination Strategy: Re-analysis of Data from a Cluster-Randomized Clinical Trial
- The Policy Dystopia Model: An Interpretive Analysis of Tobacco Industry Political Activity
Zvyšte si kvalifikaci online z pohodlí domova
Mazová zátka a její řešení
nový kurzVšechny kurzy