
The Incidence Patterns Model to Estimate the Distribution of New HIV Infections in Sub-Saharan Africa: Development and Validation of a Mathematical Model
Annick Borquez and colleagues describe the development and validation of a mathematical model for estimating the distribution of new HIV infections in sub-Saharan Africa.
Published in the journal:
. PLoS Med 13(9): e32767. doi:10.1371/journal.pmed.1002121
Category:
Research Article
doi:
https://doi.org/10.1371/journal.pmed.1002121
Summary
Annick Borquez and colleagues describe the development and validation of a mathematical model for estimating the distribution of new HIV infections in sub-Saharan Africa.
Introduction
Constraints in both health system capacity and financial resources drive countries toward programmatic efficiency in public health, including in their response to the HIV epidemic. To ensure that appropriate interventions and funds are allocated to the groups and settings that carry the largest incidence burden, a quantitative assessment of specific populations’ sizes and associated incidence patterns should be the foundation of the programmatic response [1]. In recent years, this response has shifted toward scaling up access to testing and treatment, as evidence supporting early treatment initiation to both improve health outcomes [2] and prevent transmission [3,4] accumulates. The new WHO treatment guidelines recommending antiretroviral therapy (ART) regardless of CD4 cell count and the UNAIDS 90-90-90 target—aiming to achieve knowledge of HIV status for 90% of those infected, treatment for 90% of those aware of their positive status, and viral suppression for 90% of those on treatment by 2020—reflect this commitment [5].
Understanding HIV incidence patterns allows identification of populations needing HIV services, including testing and prevention, and is therefore essential for reaching the treatment targets. Prospective cohort studies are considered the gold standard for estimating HIV incidence [6]; however, these are logistically complex and costly to implement, especially when estimates disaggregated by geographical location and population type are needed [6]. To circumvent these difficulties, alternative methods for calculating HIV incidence have been developed. Incidence assays, able to detect recent infection, are increasingly used to estimate incidence from cross-sectional data. Yet, their accuracy is compromised when ART biomarkers are unavailable and when stratifying the population by a range of factors, as sample sizes are reduced [6,7]. Further, several statistical and mathematical models have been developed to infer HIV incidence from HIV/AIDS case reports, HIV prevalence, and AIDS mortality data [8].
The UNAIDS Modes of Transmission (MoT) model is a tool that estimates the distribution of new infections in populations [9]. This simple model, used globally for over a decade [9], estimates the number of new infections in different groups according to their main mode of exposure, based on data from a variety sources on the average number of sexual or injecting contacts, condom use, and HIV prevalence among partners [10]. The MoT model’s Excel implementation makes it accessible to epidemiologists with no mathematical modelling background [10], and its estimates have been used to guide policy in several countries [11,12].
However, concerns have been raised regarding the reliability of the MoT model outputs in the sub-Saharan Africa (SSA) region [13,14]. First, the model structure assumes risk in the “low risk group” (defined as people who report being in a monogamous heterosexual relationship for the past 12 mo) to be homogeneous, while in practice this group includes sero-concordant positive couples, who cannot become newly infected, and sero-concordant negative couples, who can acquire infection only from external partnerships and are therefore not at risk. This can lead to overestimating the low risk group’s contribution to incidence and, by extension, to underestimating the incidence burden of key populations [13–15]. Second, the model includes groups that are not necessarily relevant from a programmatic perspective, whilst overlooking geographical heterogeneity, preventing the results from being used in practice for decision making [15]. Third, the model heavily relies on low quality or often unavailable behavioural data [14,15], leading to potentially inaccurate estimates. Finally, the uncertainty estimation method of the model is subjective, as the variation ranges of parameters are arbitrarily determined by the user.
To address these concerns, we propose a new generic approach for estimating the distribution of incident infections acquired according to identifiable determinants of risk in the generalised epidemics of SSA. The objectives of this study were to (1) describe the Incidence Patterns Model (IPM) for SSA, (2) validate and train the IPM using data from cohort studies in four countries, (3) apply the IPM to six different countries to show the predicted distributions of newly acquired HIV infections in different population groups, and (4) use the IPM outputs to infer the distributions of the groups transmitting HIV.
Methods
Ethical approval was obtained from the Imperial College Research Ethics Committee (ICREC_9_3_13), the Biomedical Research and Training Institute’s institutional review board (AP91/10), and the Medical Research Council of Zimbabwe (MRCZ/A/681) for the Manicaland study; from the Malawi National Health Sciences Research Committee (#419) for the Karonga study; from the Uganda Virus Research Institute Research and Ethics Committee and the Uganda National Council for Science and Technology for the Rakai study; and from the Lake Zone Institutional Review Board and the Tanzania National Ethical Review Committee for the Kisesa study. Written informed consent was a requirement for participation in each of the four studies; thumbprint in front of a witness was required for participants who could not write.
In this section we describe the population structure, incidence inference methods, and statistical framework underpinning the IPM. We then present the model’s validation and training process, implemented using cohort data from ALPHA Network studies. The ALPHA Network is an initiative aiming to facilitate comparative and pooled analyses of data from ten community-based, longitudinal HIV studies in SSA that are based on a complete census of a geographical area and that use similar survey instruments [16,17]. Four of these studies had readily available data fit to the model requirements and were selected for the validation: the Manicaland, Karonga [18], Kisesa [19], and Rakai cohorts in Zimbabwe, Malawi, Tanzania, and Uganda, respectively. We describe the application of the trained model to six countries in the SSA region (Gabon, Kenya, Malawi, Rwanda, Swaziland, and Zambia) and define a simple model that uses the IPM outputs to infer the distribution of infections transmitted by different groups in these six countries.
Incidence Patterns Model Structure and Statistical Framework
The IPM was developed to address limitations of the UNAIDS MoT model, and its principal advantages over the latter are described in detail throughout the Methods and summarised in Table 1. The IPM is better adapted to programmatic needs, offers a sounder methodological framework, and is validated against cohort data.

Stratification of the Population
In the model, the population is divided according to factors associated with HIV acquisition risk. The population is disaggregated by sex and marital/sexual activity status or membership in a key population, HIV and ART status for those in unions, and circumcision status as described in Table 2 and S1 Fig. The model is applied to each highest administrative division (here named “province”) in the country in order to account for geographical heterogeneity in HIV risk.

Marital status is strongly correlated with age but provides additional information on risk and is likely to be a better indicator to identify populations and deliver interventions. Married or cohabiting heterosexual unions are disaggregated according to sero-discordancy status and whether the man or the woman is HIV-positive, such that within partnership transmission is confined to sero-discordant unions. Polygamous unions are not explicitly represented in the model. However, the model allows for differences in the proportion of males and females in union.
The other marital/sexual activity status groups represented are never married men and women, previously married men and women (including widowed, divorced, and separated individuals), and men and women who were not sexually active in the past 12 mo (assumed to be at no risk of infection).
The key populations included are female sex workers (FSW), men who have sex with men (MSM) and people who inject drugs (PWID), disaggregated into men who inject drugs (MWID) and women who inject drugs (FWID).
Incidence Estimation
The IPM is a single-time-step compartmental deterministic model. It builds on prior historical information on incidence patterns in the SSA region to estimate the distribution of new infections acquired in the next year. The methods are briefly described below, and further information is provided in S1 Text, section 1.1 to 1.3.
All men except MSM, MWID, and men who are not sexually active are stratified by circumcision status, as being circumcised reduces the risk of infection. Unions are disaggregated by ART status as HIV-positive individuals on ART have a reduced risk of onward transmission. The other groups are not disaggregated by ART status because the incidence calculation in these groups is not based on within - or between-group transmission estimates.
The calculation of the force of infection λ in each group i and province r is described below.
Unions
HIV incidence within unions is derived by directly applying infection hazards to the susceptible individuals corresponding to transmission from both stable (ξs) and external (ξe) partners in sero-discordant unions and from external partners only in sero-concordant HIV-negative unions. ϕ is the relative risk of infection among circumcised men and о is the relative risk of infection among people whose HIV-positive partner is on ART. M1,r and W1,r correspond to the number of men and women in union in region r, respectively. Groups 1 to 4 correspond to sero-discordant unions where the male partner is HIV-negative. These men are therefore exposed to transmission from their stable partners and from external partners. In groups 1 and 2, men are circumcised; in groups 2 and 4, women are on ART. Groups 5 and 6 correspond to sero-discordant unions where the female partner is HIV-negative. These groups are not disaggregated by circumcision status as it is assumed that circumcision does not reduce the risk of infection for the female partner; however, these groups are disaggregated by ART status, with men in group 6 receiving ART. Group 7 and 8 correspond to sero-concordant HIV-negative unions, in which individuals are exposed to infection only through external partners. Men in group 7 are circumcised, and the reduction in risk is adjusted to the proportion of men versus women in union. Within partnership transmission post-infection from an external contact in sero-concordant HIV-negative partnerships is not explicitly modelled but is taken into account in the external partnership hazard. Group 9 corresponds to sero-concordant HIV-positive unions, in which transmission results in no new infections.

Never married men and women
Incidence among never married men and women is estimated using measured prevalence (ρi,r) and mean duration of sexual activity (δi,r). It is based on the assumption that among young people, prevalence reflects incidence as a result of recent initiation of sexual activity and because prevalence is not yet influenced by mortality due to AIDS or ART treatment. Group 10 corresponds to circumcised, never married men, and therefore the force of infection is adjusted for the relative risk of circumcision ϕ.

Previously married men and women
Incidence among this population is calculated by applying the total infection hazard among unions (ξs + ξe) multiplied by a relative risk (ςi) that is estimated from cohort studies with incidence data among both married and previously married participants. Group 13 corresponds to circumcised, previously married men, and therefore the force of infection is adjusted for the relative risk of circumcision ϕ.

Key populations
Incidence among key populations is estimated by assuming it is a function of prevalence (ρi,r) and turnover (δi,r), which depends on the duration of infection, duration of risk practice, and life expectancy. The duration of infection accounts for the prevalence of ART in these populations.

Estimation: Statistical Framework
A Bayesian framework is used to account for prior information on both demography and the HIV epidemic in the SSA region. We assume that countries in the region share basic demographic and epidemic patterns and that prior regional information will be useful in settings lacking local data to inform one of the model parameters.
Data
One of the fundamental principles behind the IPM is its reliance on available data. The Demographic and Health Surveys (DHS) are extensive, high-quality household surveys carried out routinely every 5 y on average in the majority of SSA countries, providing data on a range of key topics, including HIV prevalence for men and women between the ages of 15 and 49 y representative of each administrative division [20,21]. The model requires province-level DHS data on the distribution of the population by group according to marital, sexual activity, and circumcision status as well as on the HIV prevalence by group and the duration of sexual activity among never married men and women. It also uses linked-unions data on the distribution of unions by sero-concordance and ART status (see S12 Table for a list of SSA countries with the data needed to apply the model).
Province-level data on the size of and HIV prevalence among key populations, as well as duration of exposure to risk practices, are also needed. This data can be obtained from Integrated Behavioural and Biological Surveys (IBBS) or from local research studies. Finally, the model requires data on the total number of new infections in the country in the past year, which can be estimated from DHS surveys using HIV incidence assays or taken directly from the latest UNAIDS estimates obtained from the Spectrum model [22]. It is preferable to use incidence data rather than model estimates, as the latter rely on both the quality of the inputs and of the structural assumptions.
Specification of Prior Distributions
Prior distributions were specified for 38 parameters describing the size of the population and HIV prevalence in each marital/sexual activity status group, as well as the duration of sexual activity for never married men and women (see Table 3 for values). These prior distributions were obtained from recent DHS surveys in 19 countries in the region (S2 Table) that had included HIV testing. Pooled estimates for the SSA region as well as four sub-regions (western, eastern, central, and southern SSA) were calculated using weighted averages. The prior sample size was calculated by dividing the total sample size by 500 for the pooled SSA region and by a factor that produced a similar sample size for the sub-regions. This factor was determined based on average sample sizes when disaggregating the DHS data by province to give less weight to the priors when fitting to the data. Prior distributions for 11 parameters describing the size of the population and HIV prevalence as well as mean duration of risk practice in each key population were defined based on literature reviews. The prior sample sizes for the key population sizes and HIV prevalence were set at 500 for FSW, MWID, and FWID and at 250 for MSM to reflect higher variability in the last group.

Prior distributions were specified for six parameters determining the risk of infection in each of the population groups (infection hazards within and external to partnerships, relative risk of infection among circumcised compared to uncircumcised individuals, relative risk of infection among currently compared to previously married men and women, and ART coverage among unions) based on trials and cohort studies in the region (Table 3). These parameters are shared across provinces within a country.
Parameter Estimation
A log-likelihood is calculated for each data point for the proportion of people in each group, the HIV prevalence in each group, the duration of sexual activity among never married men and women for each province, as well as for the total number of new infections predicted to occur in the next year. In some cases, data on the total number of new infections by province is available, and so a log-likelihood is calculated for each province. The total log-likelihood corresponds to the sum of all log-likelihoods listed. We used a Markov chain Monte Carlo (MCMC) approach to sample from the posterior distribution and report the mean and 2.5 and 97.5 percentiles as the parameter estimate and 95% credible interval, respectively (details are provided in S1 Text, section 1.3). The place of each component within the Bayesian framework is summarised in Fig 1.

Validation and Training of the Incidence Patterns Model
To evaluate the model’s performance in different epidemic settings, it was applied to cohort data from four studies in the ALPHA Network. The extent to which the model could be improved by “training” it with local historical data was also investigated. Pairs of serial sero-surveillance surveys, referred to as “rounds” of data, were used, with one round available from Karonga (Malawi; surveys 1 to 3 of the original study), one round from Kisesa (Tanzania; surveys 5 to 6 of the original study), two rounds from Manicaland (Zimbabwe; surveys 3 to 4 and 4 to 5 of the original study), and three rounds from Rakai (Uganda; surveys 11 to 12, 12 to 13, and 13 to 14 of the original study), to assess whether (1) the projected distribution of new infections by group accurately represented the observed distribution (validation); (2) the projected geographical distribution of new infections accurately represented the observed distribution when using the different rounds of data as proxies for administrative divisions of one country (validation); (3) the model’s performance was improved when training it on historical data (“internal training”); the proposed training approach was to fit the model to data on the number of new infections in each group, as opposed to the total number of new infections, for one round of data, and use the corresponding posterior distributions of the incidence parameters as priors when applying the model on the next round of data; (4) the model’s performance was improved when training it on data from another site with similar HIV prevalence patterns (“external training”); and (5) the model’s performance was improved when training it on data from all other sites (“global training”).
The model’s performance using internal training was assessed on data from round 4 of Manicaland (using priors informed by round 3) and on data from rounds 12 and 13 of Rakai (using priors informed by rounds 11 and 12, respectively). The model’s performance using external training was assessed on each round of Rakai, using priors informed by all the rounds of Manicaland, and vice versa. This external training pairing was also implemented for Karonga and Kisesa. The model’s performance using global training was assessed on all rounds of data from all sites, using priors informed simultaneously by all rounds of all other sites.
Data to inform the model were extracted for each round of each of the four cohorts using STATA version MP13. No data were available on male-to-male sex or injecting drug use, and so the model could not be validated for these populations. The Manicaland survey coupled with the Women at Risk survey [41] provided data on paid sex that allowed validating the model for FSW.
Further details on the cohorts, results from the statistical analyses, and methods for the validation and training are provided in S1 Text, section 2.2 and 2.3, and S3–S9 Tables.
Estimation of HIV Acquisition
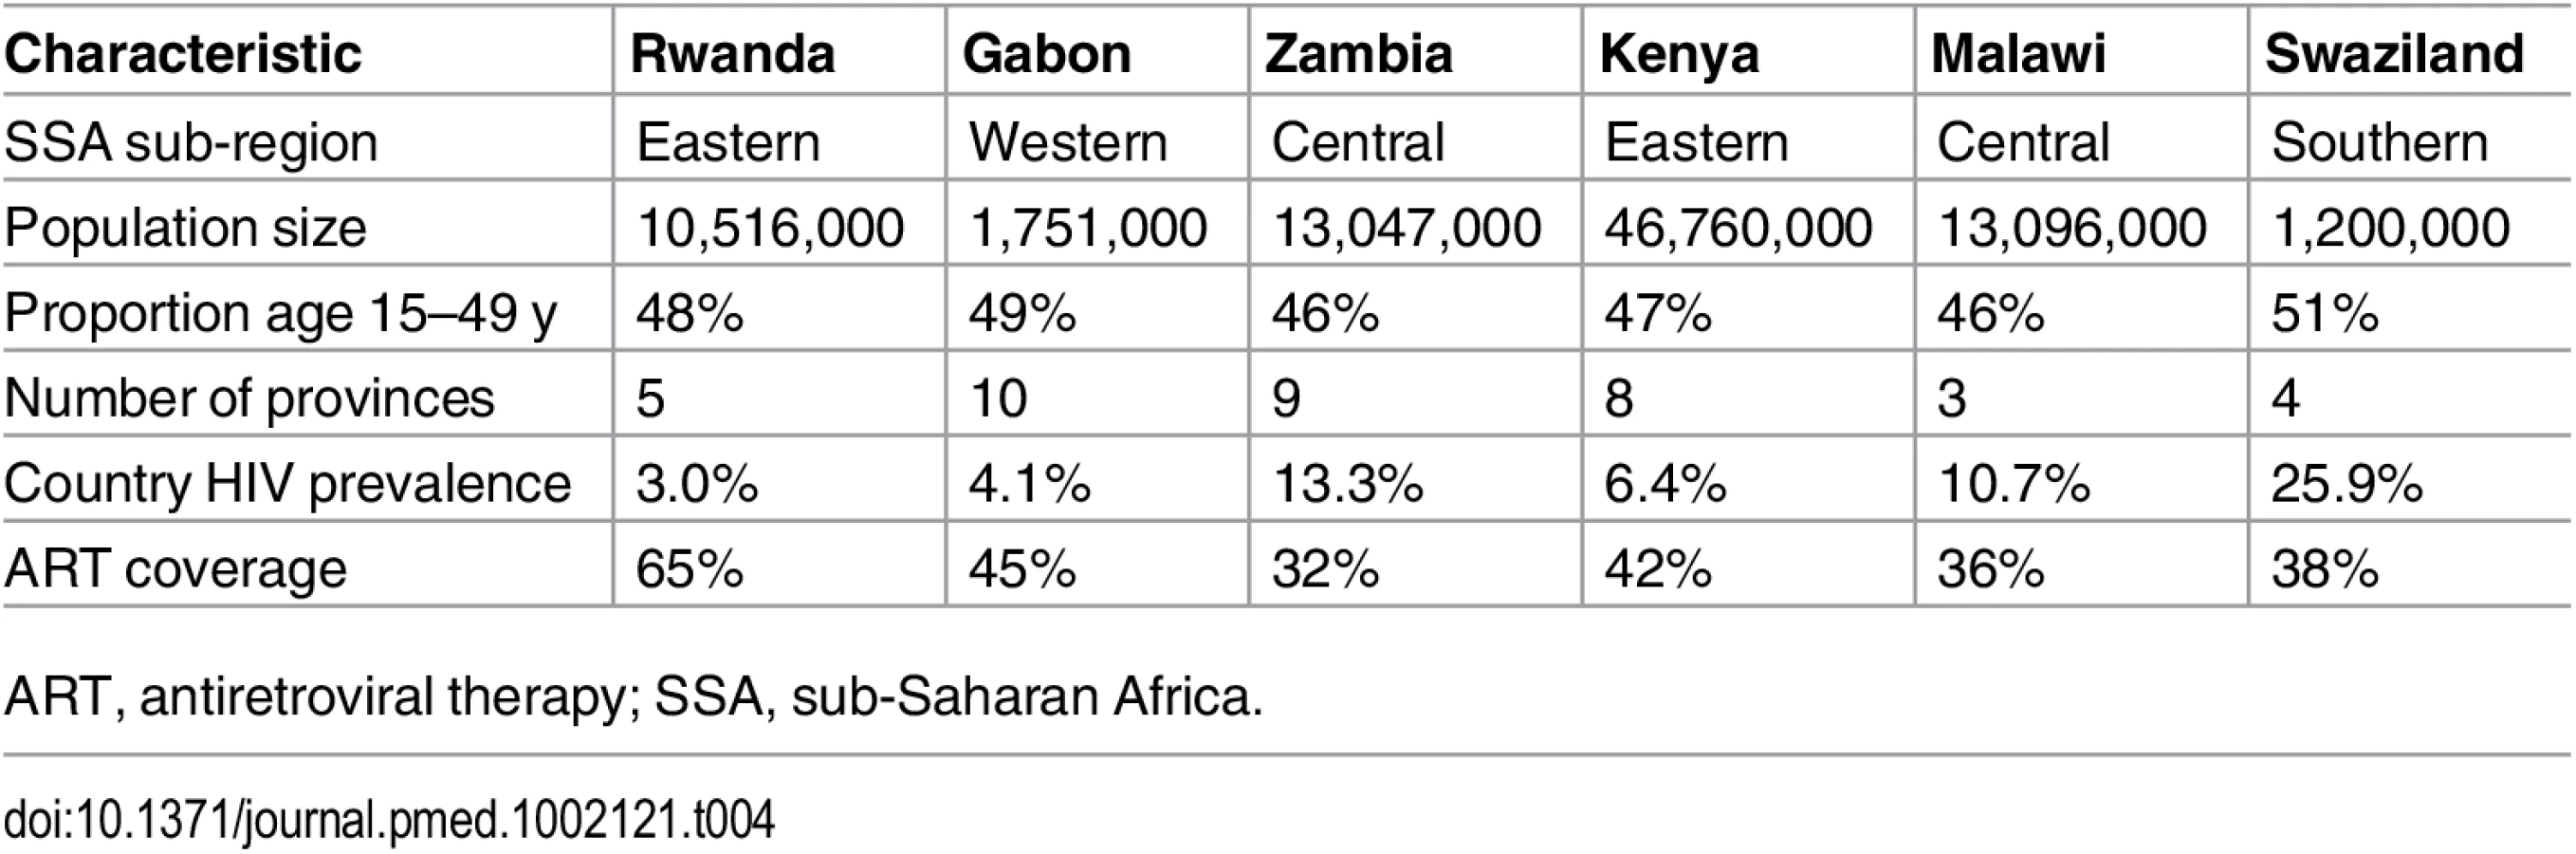
After validating and training the IPM on data from the ALPHA Network studies, we applied the model to data from Gabon, Kenya, Malawi, Rwanda, Swaziland, and Zambia (S10 and S11 Tables). Basic demographic and epidemiological information on the six countries is provided in Table 4.
Estimation of HIV Transmission
In order to provide an indication of the plausible differences in the contribution of each population group to HIV acquisition and transmission, the outputs from the IPM were used to derive the proportion of transmission events attributable to each group in these six countries. It is important to consider transmission as an output, as some groups will account for a small proportion of new infections acquired as a result of their small population size but may contribute substantially to transmission if, for instance, the individuals in these groups have a high number of sexual partners and low levels of condom use. For the purpose of this study, a simple model was implemented to allocate new infections acquired in each group as estimated by the IPM to the different groups using assumptions on the sexual mixing patterns between groups and on the relative transmissibility from each group (S1 Text, section 4; S13 Table). This is illustrated in Fig 2. A prior distribution for the mixing matrix, corresponding to the proportion of all sexual contacts in a group that happen with individuals in each of the other groups, was defined based on available information from the DHS on sexual mixing patterns by age, on reporting of extramarital sex among men and women in union, and on paying for sex among men by age. Similarly, we assumed a prior distribution for the relative transmissibility of a group, corresponding to the mean cumulative probability of transmitting HIV to partners over the course of a year, based on factors that are known to influence the risk of transmission including HIV transmission probabilities per sex act for men and women, relative risk of transmission through anal sex and sharing injecting equipment compared to vaginal sex, average condom use, and sexually transmitted infection (STI) prevalence (S1 Text, section 4; S13 Table). New infections attributable to within partnership transmission in unions can be directly obtained from the IPM (as it explicitly represents within partnership and external partnership transmission hazards) and were accounted for in the derivations.

Results
Validation and Training
To test the model’s ability to predict the distribution of new infections by group, it was applied to each round of data in each of the four ALPHA Network studies. The 95% credible intervals of the model’s projections overlapped with the 95% confidence intervals of the data for all groups, suggesting that the model performs well. Fig 3 presents results obtained when applying the model simultaneously to seven rounds of data from the ALPHA Network studies as if they were provinces within a country. The last panel shows the estimated distribution of new infections by “province” (i.e., round) compared to the data. The model’s 95% credible intervals overlap with the data confidence intervals for four out of seven “provinces”, and the absolute difference between the intervals is under 5% for the other two rounds.

The model was reapplied to the Manicaland data after stratifying for FSW. As shown in Fig 4, which also provides a more detailed stratification of the unions, the model captured the contribution of FSW to the number of new infections with reasonable accuracy; the confidence intervals of the data overlapped with the credible intervals of the model for both rounds of data.

Fig 5 shows the results of the model validation for round 12 of Rakai with original priors and various training strategies. The original priors and posteriors obtained after training the model and then used as “updated priors” in these analyses are plotted on the left. Following each training, the within partnership infection hazard was shifted to the right of the original prior distribution, suggesting it is significantly higher than observed in the trials used to derive the original priors. This was expected as trials are highly controlled contexts where the best standards of preventive care are offered to all participants. The range estimated varied from 0.02/person-years at risk to 0.16/person-years at risk depending on the training method. The range of the infection hazard from external partners was within the ranges estimated in trials but narrower. The original and trained priors for the efficacy of circumcision were similar for all training types. The estimated relative risk of infection among previously married men and women compared to that in unions was lower in the models with internal and global training with pooled sites compared to the original prior, but slightly higher when training the model on Manicaland data; however, the distributions overlapped in all cases.

The patterns of distribution of new infections and the performance of the model differed according to the training method. The mean posterior log-likelihood for each type of training is shown in Table 5, for all rounds. The training methods are ranked according to which resulted in the maximum mean posterior log-likelihood; the last column in Table 5 shows the best training method and training methods with results within five log-likelihood units of the best one. Overall, any form of training, and especially training based on all the data from the sites combined, led to significant improvements in model performance. For example, using Rakai data from round 12 (presented in Fig 5 and highlighted in bold in Table 5), the model with global training performed best, followed by the models with internal training, external training, and no training. The difference between the best training method and the other three was more than five log-likelihood units, and thus the global training method was considered to be significantly better. On all rounds of data, the globally trained model performed best or was amongst the best set of training methods. External training performed similarly to global training. In all but one setting (Kisesa), the trained models were significantly better than the original model.

Application to Countries in the Region
HIV acquisition
The posterior distribution of new infections in Gabon, Kenya, Malawi, Rwanda, Swaziland, and Zambia by province and population group using “updated priors” from the global training on all ALPHA Network studies is shown in Fig 6. The incidence patterns by group were relatively similar between all countries except Swaziland. In the five countries other than Swaziland, individuals in unions contributed to a high share (40% to 75%) of new infections, with a majority of these occurring among sero-concordant HIV-negative couples. Never married women accounted for <5% to >20% of new infections, while the contribution of never married men varied more broadly, from very low in Gabon and Rwanda to high in Zambia, with nearly 30% of new infections occurring in this group in some provinces. Previously married men and women contributed to less than 10% of new infections in all countries except Kenya, where their contribution was slightly higher. FSW accounted for between 5% and nearly 20% of new infections, MSM for up to 5% of new infections, and MWID and FWID for less than 1%.

Swaziland exhibited different incidence patterns. The majority of new infections were estimated to occur among never married men and women, with only 15% to 25% occurring among individuals in unions. This difference can be explained by the demographic and prevalence patterns: fewer men and women reported being in union in Swaziland, and a higher proportion of these were sero-concordant HIV-positive and sero-discordant compared with the other countries (see S4 and S5 Figs for a graphical representation of demographic and HIV prevalence patterns in each country). In addition, HIV prevalence was high among never married men and women, and there was a low prevalence of circumcision among men and a relatively short mean duration of sexual activity among both men and women, giving rise to this pattern. The proportion of new infections occurring in key populations was also lower than in the other countries, reflecting a more generalised epidemic.
Within countries, the distribution of new infections was relatively homogeneous across provinces with a few exceptions: in the southern province of Malawi, individuals in unions had a lower contribution to new infections than in the other two provinces, while never married men and women and FSW had a higher contribution. A similar pattern was observed in Kigali City, Rwanda. Nyanza, in Kenya, also differed from the other provinces, with a higher contribution of never married men, reflecting lower circumcision prevalence and a different distribution of couples by sero-concordance and circumcision status.
The geographical distribution of new infections was heterogeneous, mostly reflecting differences in population sizes. However, some provinces, including Nyanza in Kenya and Manzini in Swaziland, were estimated to contribute a disproportionately high proportion of new infections for their population sizes.
Uncertainty in the results was higher among key populations than among other population groups in all six countries and among never married men in Rwanda, Kenya, Zambia, and Gabon. There was also high uncertainty in the estimates among previously married men in Kenya, reflecting low sample sizes.
HIV transmission
Fig 7 shows the distribution of new infections transmitted by each group in each of the countries studied given assumptions on transmissibility and mixing patterns in the population. In Gabon, Kenya, Malawi, Rwanda, and Zambia, previously married men, FSW, and MSM represented only a small fraction of acquired infections but they had a larger contribution to transmission. Conversely, never married women, who represented a relatively large proportion of new infections, contributed much less to onwards transmission. Individuals in unions contributed to a lower or equivalent proportion of transmissions compared to their contribution to the number of infections acquired.

The transmission patterns were different in Swaziland, where individuals in unions contributed to a higher proportion of transmissions than they did to the numbers of new infections acquired, as a result of the high HIV prevalence in unions. Both never married men and never married women accounted for a high proportion of infections transmitted, also as a result of high HIV prevalence in these groups.
Discussion
Findings, Interpretation, and Contribution to the Field
Modelling tools to estimate the distribution of new infections in the population are needed to inform HIV prevention, screening, and treatment planning at the local level [8]. We built on existing approaches [42–44] to develop a new version of the MoT model, widely used in HIV policy. Our model, the IPM, relies on available, high-quality data obtained from DHS, IBBS, and local surveys to predict the distribution of new infections according to key determinants of risk: marital/sexual activity status, HIV and ART status within unions, circumcision status, membership in key populations based on risk behaviours, and geographical location. Model validation using cohort data from four settings in the region—Manicaland, Zimbabwe; Karonga, Malawi; Kisesa, Tanzania; and Rakai, Uganda [17]—showed that the model accurately predicts the distribution of new infections acquired in the general population according to key characteristics including geographical location and that its projections can be improved by training it on historical cohort data from other settings in the region.
As such, the IPM offers substantial improvements over the MoT model, both in terms of methodological rigour and programmatic relevance. Its population structure among individuals in unions considers important heterogeneities in risk that determine incidence patterns and therefore limits the risk of overestimating their contribution to the epidemic. The IPM uses reliable and widely available data on HIV prevalence and risk determinants to estimate incidence, therefore minimising the biases and uncertainty associated with self-reported behaviour [45]. Unlike the MoT model, the IPM is implemented within a Bayesian framework that uses prior information reflecting current knowledge of demography and HIV prevalence in SSA, minimising the impact of small datasets on the results, but also allowing for a systematic representation of uncertainty. Finally, a key methodological improvement offered by our model is its validation. Validation is a critical stage in the modelling process, and this study contributes to ongoing efforts to improve the assessment of model performance—through model-to-model comparisons and model-to-data comparisons—by initiatives such as the HIV Modelling Consortium [46–48].
To provide examples of model outputs, we applied the model to six countries in the region and compared the distribution of new infections acquired in each of these. Individuals in unions contributed to a high proportion of new infections in all countries, with a lower contribution in Swaziland, where marriage is less common and HIV prevalence in unions is high, reflecting a hyperendemic epidemic. Sero-concordant HIV-negative unions accounted for a large share of new infections in these countries, indicating that interventions promoting condom use with concurrent partners would be key to reducing incidence. In Malawi, Zambia, Swaziland, and the Nyanza province in Kenya, sero-discordant unions accounted for a larger proportion of new infections among unions, suggesting that interventions such as couples HIV counselling that lead to early ART treatment or pre-exposure prophylaxis (PrEP) use are needed. Community interventions to promote couples HIV counselling have been successfully implemented in Zambia [49], Rwanda [50], and elsewhere in the region, testing a range of strategies to maximise impact [51]. In Zambia, especially in the Copperbelt and Lusaka provinces, and in Swaziland, the contribution of never married men was very high, a finding that is partly explained by the low prevalence of circumcision in these countries [52]. Findings from studies investigating the determinants of uptake of voluntary medical male circumcision in these two countries should inform its scale up [53–56], and strategies such as early infant circumcision [57,58] or circumcision among adolescents through school programmes [59], which are likely to have higher acceptability, should be promoted [60]. Never married women were also disproportionately affected in Swaziland compared to their population size (see S2 Fig), and similarly in Zambia, Gabon, the Southern province in Malawi, and Kigali City and the South province in Rwanda. Previously married men accounted for a large proportion of transmissions in these settings according to the transmission model, suggesting that intergenerational sex could be contributing to the high incidence burden among young women. Interventions that delay the onset of sexual activity, promote gender equality, and improve access to services have been shown to be effective at reducing HIV risk among young women in the region [61]. A comprehensive review by the What Works for Women and Girls initiative provides guidance for their scale up [62]. In all countries, FSW contributed disproportionately to incidence compared to their population size, and their importance to prevention was also highlighted by the transmission model outputs. Improving the working conditions of FSW and engaging them in healthcare [63–65] is paramount for controlling the epidemic in the region in the short and long term [66,67]. Similarly, MSM contributed disproportionately to the proportion of infections acquired and transmitted and should be a priority for national HIV programmes in the region [68–70]. Contextual information on risks and interventions among this population is becoming available, providing valuable guidance for programme design and implementation [71–76].
Study Limitations
There are three main sources of limitations in our study: the model structure, the incidence estimation methods, and the data used to both apply the model in countries and validate it. In terms of model structure, the model’s parsimony, which conveys transparency to the results generated, also implies several necessary simplifications. The model does not include partners of key populations such as FSW clients or stable female partners of MSM. Our decisions were driven by the need to limit categories to groups for which incidence could be estimated in a straightforward way, for which data were available, and that had programmatic relevance. Implementing interventions directed at stable partners of members of key populations is difficult in practice. However, it is important that the contribution of key populations to the epidemic is not underestimated as a result of the model structure. To account for this, we also presented the distribution of infections transmitted, which provides a complementary perspective on incidence patterns, highlighting priorities for prevention. These results are more illustrative than definitive, as they strongly depend on assumptions about mixing patterns in the population. Country - or province-specific information on sexual networks, as well as phylogenetic data providing insights into transmission patterns, could be used to refine the mixing matrix definition, leading to more robust results.
Among the groups that are represented in the model, determinants of HIV risk such as age, age gaps in partnerships [77,78], number of previous marriages, engagement in transactional sex [79,80], exposure to sexual violence [78,81–83], sexual identity for MSM [84,85], and work place for FSW [85,86] are not included. Increased resolution by (social) determinants is hindered by the lack of power once the data are disaggregated further. However, the model results should be combined with evidence from other epidemiological and social sciences studies that identify determinants of infection at the local level.
Although our model represents concurrency, it does not incorporate the role of acute infection [87,88], potentially leading to underestimation of the risk of infection among unions. This is especially important among polygamous unions, which are not explicitly represented in the model. While the risk might be concentrated in some couples, the model applies an average risk from concurrent partnerships among all HIV-negative individuals in unions, failing to represent this heterogeneity. However, the validation shows that the model is able to estimate the distribution of new infections among unions with reasonable accuracy.
In terms of incidence estimation, methods that use prevalence and duration of exposure assume that incidence is constant through time [89], and the model will therefore not detect sudden changes in incidence caused by rapid changes in behaviour or successful interventions. However, these changes are unlikely to occur on a large scale or to be of a high magnitude over a 1-y time scale and so are unlikely to affect the results. The short time scale of the model, however, implies that longer-term epidemic dynamics are not captured [14,67,90]. While this represents a limitation of the model, making long-term projections requires additional data and carries greater uncertainty [46] as sexual behaviours and access to treatment might change in the future. Two essential features of this model are accuracy and applicability on a cross-section of countries, and therefore a long-term perspective would not be appropriate.
Although the data used in this model mostly come from the DHS surveys, which follow a strong methodology, they are still subject to reporting bias, and therefore the results might be affected by this bias. In addition, as in all analyses, the extent to which variances have been constrained by our choices of parametric distribution can understate the overall uncertainty in the model outputs.
The ALPHA Network cohort studies are a valuable source of information for model validation as they benefit from years of experience working with household participants in the context of HIV testing [17]. Nonetheless, their findings are susceptible to reporting bias and inaccuracies in the estimation of sero-conversion dates. After restricting analyses to participants who were present at two subsequent surveys and tested for HIV, the number of sero-conversions was relatively small in some groups, especially among linked unions, leading to broad confidence intervals.
Implications and Next Steps
Our model is currently tailored to the generalised epidemics of SSA, where the vast majority of HIV cases are observed among the general population. The application of the model by national teams has been piloted in Botswana, and model documentation is being developed based on the feedback received. The model is being implemented on a user-friendly software platform to facilitate its scale up in the region. However, for a number of countries in SSA (17 out of 42 countries), recent DHS data are currently unavailable, preventing them from applying the model (S12 Table). To predict the distribution of new infections in epidemics that are concentrated among key populations, a different type of model would be required. Such a tool should have a higher resolution of the dynamics of transmission within and between key populations and the general population and therefore would require different data.
Within the SSA region, epidemic drivers also vary, and further model testing in other settings is needed to confirm the model’s ability to capture different epidemic dynamics. Importantly, the capacity of the model to accurately estimate the contribution of MSM and PWID to the distribution of new infections needs to be assessed. Data availability was the limiting factor in this analysis, but progress in data collection methods among key populations as well as increased research capacity on MSM in SSA [91–96] should help address this gap in the near future. Model validation is an iterative process that should be carried out as long as the model is in use to improve the quality of its outputs as data become available.
This study provides a highly pragmatic and reliable perspective on incidence patterns highlighting priorities for prevention across geographic areas and populations, an approach that has been repeatedly emphasised as the cornerstone of renewed efforts to drive down infection rates. Modelling tools to inform HIV programme planning that provide for geographical heterogeneity are becoming available: Anderson et al.’s model [43] and Optima[97] are two key examples. They both have a long-term perspective and focus on allocative efficiency. The IPM, in contrast, outputs short-term predictions, which are also needed to guide not only prevention but also testing and treatment programmes, especially in the context of the UNAIDS 90-90-90 target. The IPM was designed to provide clear information on incidence as opposed to guidance on interventions’ cost-effectiveness, and its strength lies in its simplicity, systematic use of information, and careful representation of the population in terms of programmatic relevance. Its outputs should not be directly (i.e., proportionally) translated into budget allocation, as some populations will require more costly interventions, and specific provinces might have low incidence precisely because their HIV programmes are well designed and implemented, requiring sustained funding. Indeed, the model outputs should be contrasted with local programme data obtained through monitoring and evaluation efforts to identify discrepancies between incidence, programme activities, and spending. Contextual epidemiological and cost-effectiveness studies should then be used to guide programmatic planning among the populations predicted to contribute importantly to incidence. The IPM also feeds into the monitoring process by informing data collection priorities as it highlights settings and populations in which uncertainty is high.
To our knowledge, this is the first model to embed prior epidemiological and demographic information from SSA and to be validated against data from a range of settings in the region. We have demonstrated that the model can reliably predict HIV incidence patterns, and that this is enhanced when local high-quality data are incorporated into the analyses. We believe this model is a valuable tool to inform programme planning and that its application would contribute to the formulation of the effective and efficient prevention and testing programmes that are urgently needed to curb the epidemic.
Supporting Information
Zdroje
1. Schwartlander B, Stover J, Hallett T, Atun R, Avila C, Gouws E, et al. Towards an improved investment approach for an effective response to HIV/AIDS. Lancet. 2011;377 : 2031–2041. doi: 10.1016/S0140-6736(11)60702-2 21641026
2. National Institutes of Health. Starting antiretroviral treatment early improves outcomes for HIV-infected individuals. 2015 May 27 [cited 26 Jul 2015]. Available: http://www.nih.gov/news/health/may2015/niaid-27.htm. doi: 10.1177/1363459314556904 25394654
3. Cohen MS, Chen YQ, McCauley M, Gamble T, Hosseinipour MC, Kumarasamy N, et al. Prevention of HIV-1 infection with early antiretroviral therapy. N Engl J Med. 2011;365 : 493–505. doi: 10.1056/NEJMoa1105243 21767103
4. Cohen M, Chen Y, McCauley M, Gamble T, Hosseinipour M, Kumarasamy N, et al. Final results of the HPTN 052 randomized controlled trial: antiretroviral therapy prevents HIV transmission. 8th IAS Conference on HIV Pathogenesis, Treatment & Prevention; 19–22 Jul 2015; Vancouver, Canada.
5. Joint United Nations Programme on HIV/AIDS. 90-90-90: an ambitious treatment target to help end the AIDS epidemic. 2014 Oct [cited 8 Aug 2016]. Available: http://www.unaids.org/sites/default/files/media_asset/90-90-90_en_0.pdf.
6. Hallett TB. Estimating the HIV incidence rate: recent and future developments. Curr Opin HIV AIDS. 2011;6 : 102–107. doi: 10.1097/COH.0b013e328343bfdb 21505383
7. World Health Organization, Joint United Nations Programme on HIV/AIDS. WHO/UNAIDS technical update on HIV incidence assays for surveillance and epidemic monitoring. 2013 May 30 [cited 26 Jul 2015]. Available: http://www.unaids.org/sites/default/files/sub_landing/files/2013_TechnicalUpdate_WHO_UNAIDS_HIVincidenceAssays.pdf.
8. Gouws E. Methods for estimating HIV incidence. UNAIDS Quarterly Update on HIV Epidemiology. 2010 [cited 8 Aug 2016]. Available: http://www.unaids.org/sites/default/files/media_asset/epi_alert_1stqtr2010_en_0.pdf.
9. Gouws E, Cuchi P, international Collaboration on Estimating HIV Incidence by Modes of Transmission. Focusing the HIV response through estimating the major modes of HIV transmission: a multi-country analysis. Sex Transm Infect. 2012;88:I76–I85. doi: 10.1136/sextrans-2012-050719 23172348
10. Joint United Nations Programme on HIV/AIDS. Modelling the expected short-term distribution of incidence of HIV infections by exposure group: manual. 2007 [cited 8 Aug 2016]. Available: http://data.unaids.org/pub/Manual/2007/20090407_ModeOfTransmission_manual2007_en.pdf.
11. Case KK, Ghys PD, Gouws E, Eaton JW, Borquez A, Stover J, et al. Understanding the modes of transmission model of new HIV infection and its use in prevention planning. Bull World Health Organ. 2012;90 : 831–838. doi: 10.2471/Blt.12.102574 23226895
12. Shubber Z, Mishra S, Vesga JF, Boily MC. The HIV Modes of Transmission model: a systematic review of its findings and adherence to guidelines. J Int AIDS Soc. 2014;17 : 18928. doi: 10.7448/Ias.17.1.18928 24962034
13. Foss A, Prudden H, Mehl A, Zimmerman C, Ashburn K, Trasi R, et al. The UNAIDS Modes of Transmission model: a useful tool for decision making? Sex Transm Infect. 2011;87:A167. doi: 10.1136/sextrans-2011-050108.160
14. Mishra S, Pickles M, Blanchard JF, Moses S, Shubber Z, Boily MC. Validation of the Modes of Transmission model as a tool to prioritize HIV prevention targets: a comparative modelling analysis. PLoS ONE. 2014;9:e101690. doi: 10.1371/journal.pone.0101690 25014543
15. Prudden HJ, Watts CH, Vickerman P, Bobrova N, Heise L, Ogungbemi MK, et al. Can the UNAIDS modes of transmission model be improved?: a comparison of the original and revised model projections using data from a setting in west Africa. AIDS. 2013;27 : 2623–2635. doi: 10.1097/01.aids.0000432476.22616.2f 23921619
16. London School of Hygiene & Tropical Medicine. ALPHA Network: home. 2015 [cited 17 Dec 2015]. Available: http://alpha.lshtm.ac.uk/.
17. Reniers G, Wamukoya M, Urassa M, Nyaguara A, Nakiyingi-Miiro J, Lutalo T, et al. Data Resource Profile: Network for Analysing Longitudinal Population-based HIV/AIDS data on Africa (ALPHA Network). Int J Epidemiol. 2016;45 : 83–93. doi: 10.1093/ije/dyv343 26968480
18. Crampin AC, Dube A, Mboma S, Price A, Chihana M, Jahn A, et al. Profile: the Karonga Health and Demographic Surveillance System. Int J Epidemiol. 2012;41 : 676–685. doi: 10.1093/ije/dys088 22729235
19. Kishamawe C, Isingo R, Mtenga B, Zaba B, Todd J, Clark B, et al. Health & Demographic Surveillance System Profile: the Magu Health and Demographic Surveillance System (Magu HDSS). Int J Epidemiol. 2015;44 : 1851–1861. doi: 10.1093/ije/dyv188 26403815
20. Corsi DJ, Neuman M, Finlay JE, Subramanian SV. Demographic and health surveys: a profile. Int J Epidemiol. 2012;41 : 1602–1613. doi: 10.1093/ije/dys184 23148108
21. The DHS Program. Demographic and Health Surveys. 2015 [cited 17 Dec 2015]. Available: http://www.dhsprogram.com/.
22. Joint United Nations Programme on HIV/AIDS. Methods for deriving UNAIDS estimates. 2016 [cited 8 Aug 2016]. Available: http://www.unaids.org/sites/default/files/media_asset/2016_methods-for-deriving-UNAIDS-estimates_en.pdf.
23. Vandepitte J, Lyerla R, Dallabetta G, Crabbe F, Alary M, Buve A. Estimates of the number of female sex workers in different regions of the world. Sex Transm Infect. 2006;82 (Suppl 3):iii18–iii25. doi: 10.1136/sti.2006.020081 16735288
24. Talbott JR. Size matters: the number of prostitutes and the global HIV/AIDS pandemic. PLoS ONE. 2007;2:e543. doi: 10.1371/journal.pone.0000543 17579715
25. Center for Strategic and International Studies Global Health Policy Center. HIV prevention among injection drug users. Washington (District of Columbia): Center for Strategic and International Studies; 2010.
26. Caceres C, Konda K, Pecheny M, Chatterjee A, Lyerla R. Estimating the number of men who have sex with men in low and middle income countries. Sex Transm Infect. 2006;82 (Suppl 3):iii3–iii9. 16735290
27. Mathers BM, Degenhardt L, Phillips B, Wiessing L, Hickman M, Strathdee SA, et al. Global epidemiology of injecting drug use and HIV among people who inject drugs: a systematic review. Lancet. 2008;372 : 1733–1745. doi: 10.1016/S0140-6736(08)61311-2 18817968
28. Baral S, Beyrer C, Muessig K, Poteat T, Wirtz AL, Decker MR, et al. Burden of HIV among female sex workers in low-income and middle-income countries: a systematic review and meta-analysis. Lancet Infect Dis. 2012;12 : 538–549. doi: 10.1016/S1473-3099(12)70066-X 22424777
29. United States Census Bureau. HIV/AIDS Surveillance Data Base. 2015 [cited 17 Jul 2015. Available: http://www.census.gov/population/international/data/hiv/interactive/.
30. Beyrer C, Baral SD, van Griensven F, Goodreau SM, Chariyalertsak S, Wirtz AL, et al. Global epidemiology of HIV infection in men who have sex with men. Lancet. 2012;380 : 367–377. doi: 10.1016/S0140-6736(12)60821-6 22819660
31. Auvert B, Taljaard D, Lagarde E, Sobngwi-Tambekou J, Sitta M, Puren A. Randomized, controlled intervention trial of male circumcision for reduction of HIV infection risk: The ANRS 1265 trial. PLoS Med. 2005;2 : 1112–1122. doi: 10.1371/journal.pmed.0020298
32. Gray RH, Kigozi G, Serwadda D, Makumbi F, Watya S, Nalugoda F, et al. Male circumcision for HIV prevention in men in Rakai, Uganda: a randomised trial. Lancet. 2007;369 : 657–666. doi: 10.1016/S0140-6736(07)60313-4 17321311
33. Bailey RC, Moses S, Parker CB, Agot K, Maclean I, Krieger JN, et al. Male circumcision for HIV prevention in young men in Kisumu, Kenya: a randomised controlled trial. Lancet. 2007;369 : 643–656. doi: 10.1016/S0140-6736(07)60312-2 17321310
34. Celum C, Wald A, Lingappa JR, Magaret AS, Wang RS, Mugo N, et al. Acyclovir and transmission of HIV-1 from persons infected with HIV-1 and HSV-2. New Engl J Med. 2010;362 : 427–439. doi: 10.1056/Nejmoa0904849 20089951
35. Baeten JM, Donnell D, Ndase P, Mugo NR, Campbell JD, Wangisi J, et al. Antiretroviral prophylaxis for HIV prevention in heterosexual men and women. New Engl J Med. 2012;367 : 399–410. doi: 10.1056/Nejmoa1108524 22784037
36. Lopman B, Nyamukapa C, Mushati P, Mupambireyi Z, Mason P, Garnett GP, et al. HIV incidence in 3 years of follow-up of a Zimbabwe cohort—1998–2000 to 2001–03: contributions of proximate and underlying determinants to transmission. Int J Epidemiol. 2008;37 : 88–105. doi: 10.1093/ije/dym255 18203774
37. Lopman BA, Nyamukapa C, Hallett TB, Mushati P, Spark-du Preez N, Kurwa F, et al. Role of widows in the heterosexual transmission of HIV in Manicaland, Zimbabwe, 1998–2003. Sex Transm Infect. 2009;85 (Suppl 1):i41–i48. doi: 10.1136/sti.2008.033043 19307340
38. Nalugoda F, Guwatudde D, Bwaninka JB, Makumbi FE, Lutalo T, Kagaayi J, et al. Marriage and the risk of incident HIV infection in Rakai, Uganda. J Acquir Immune Defic Syndr. 2014;65 : 91–98. doi: 10.1097/QAI.0b013e3182a7f08a 24419066
39. Fazito E, Cuchi P, Mahy M, Brown T. Analysis of duration of risk behaviour for key populations: a literature review. Sex Transm Infect. 2012;88 (Suppl 2):i24–i32. doi: 10.1136/sextrans-2012-050647 23172343
40. Joint United Nations Programme on HIV/AIDS. Fact sheet 2014. 2014 [cited 8 Aug 2016]. Available: http://www.unaids.org/sites/default/files/en/media/unaids/contentassets/documents/factsheet/2014/20140716_FactSheet_en.pdf.
41. Elmes J, Nhongo K, Ward H, Hallett T, Nyamukapa C, White PJ, et al. The price of sex: condom use and the determinants of the price of sex among female sex workers in eastern Zimbabwe. J Infect Dis. 2014;210:S569–S578. doi: 10.1093/infdis/jiu493 25381377
42. Cuadros DF, Awad SF, Abu-Raddad LJ. Mapping HIV clustering: a strategy for identifying populations at high risk of HIV infection in sub-Saharan Africa. Int J Health Geogr. 2013;12 : 28. doi: 10.1186/1476-072x-12-28 23692994
43. Anderson SJ, Cherutich P, Kilonzo N, Cremin I, Fecht D, Kimanga D, et al. Maximising the effect of combination HIV prevention through prioritisation of the people and places in greatest need: a modelling study. Lancet. 2014;384 : 249–256. doi: 10.1016/S0140-6736(14)61053-9 25042235
44. Hallett TB, Zaba B, Todd J, Lopman B, Mwita W, Biraro S, et al. Estimating incidence from prevalence in generalised HIV epidemics: methods and validation. PLoS Med. 2008;5:e80. doi: 10.1371/journal.pmed.0050080 18590346
45. Kelly CA, Soler-Hampejsek E, Mensch BS, Hewett PC. Social desirability bias in sexual behavior reporting: evidence from an interview mode experiment in rural Malawi. Int Perspect Sex Reprod Health. 2013;39 : 14–21. doi: 10.1363/3901413 23584464
46. Eaton JW, Johnson LF, Salomon JA, Barnighausen T, Bendavid E, Bershteyn A, et al. HIV Treatment as prevention: systematic comparison of mathematical models of the potential impact of antiretroviral therapy on HIV incidence in South Africa. PLoS Med. 2012;9:e1001245. doi: 10.1371/journal.pmed.1001245 22802730
47. Eaton JW, Menzies NA, Stover J, Cambiano V, Chindelevitch L, Cori A, et al. Health benefits, costs, and cost-effectiveness of earlier eligibility for adult antiretroviral therapy and expanded treatment coverage: a combined analysis of 12 mathematical models. Lancet Glob Health. 2014;2:E23–E34. doi: 10.1016/S2214-109x(13)70172-4 25104632
48. HIV Modelling Consortium. Strengthening the use of mathematical models in community trials. 2013 [cited 20 Aug 2016]. Available: http://www.hivmodelling.org/sites/default/files/publications/Models_in_Community_Trials_18thOctober2012_Final.pdf.
49. Wall KM, Kilembe W, Nizam A, Vwalika C, Kautzman M, Chomba E, et al. Promotion of couples’ voluntary HIV counselling and testing in Lusaka, Zambia by influence network leaders and agents. BMJ Open. 2012;2. doi: 10.1136/bmjopen-2012-001171
50. Wall K, Karita E, Nizam A, Bekan B, Sardar G, Casanova D, et al. Influence network effectiveness in promoting couples’ HIV voluntary counseling and testing in Kigali, Rwanda. AIDS. 2012;26 : 217–227. doi: 10.1097/QAD.0b013e32834dc593 22008653
51. Medley A, Baggaley R, Bachanas P, Cohen M, Shaffer N, Lo YR. Maximizing the impact of HIV prevention efforts: interventions for couples. AIDS Care. 2013;25 : 1569–1580. doi: 10.1080/09540121.2013.793269 23656251
52. Weiss HA, Quigley MA, Hayes RJ. Male circumcision and risk of HIV infection in sub-Saharan Africa: a systematic review and meta-analysis. AIDS. 2000;14 : 2361–2370. 11089625
53. Redding CA, Jones D, Zulu R, Chitalu N, Cook R, Weiss SM. Stages of change for voluntary medical male circumcision and sexual risk behavior in uncircumcised Zambian men: the Spear and Shield Project. Int J Behav Med. 2015;22 : 799–806. doi: 10.1007/s12529-015-9485-z 25896876
54. Cook R, Jones D, Redding CA, Zulu R, Chitalu N, Weiss SM. Female partner acceptance as a predictor of men’s readiness to undergo voluntary medical male circumcision in Zambia: the Spear and Shield Project. AIDS Behav. 2015. doi: 10.1007/s10461-015-1079-x
55. Price JE, Phiri L, Mulenga D, Hewett PC, Topp SM, Shiliya N, et al. Behavior change pathways to voluntary medical male circumcision: narrative interviews with circumcision clients in Zambia. PLoS ONE. 2014;9:e111602. doi: 10.1371/journal.pone.0111602 25375790
56. Maibvise C, Mavundla TR. Reasons for the low uptake of adult male circumcision for the prevention of HIV transmission in Swaziland. Afr J AIDS Res. 2014;13 : 281–289. doi: 10.2989/16085906.2014.952652 25388982
57. Jarrett P, Kliner M, Walley J. Early infant male circumcision for human immunodeficiency virus prevention: knowledge and attitudes of women attending a rural hospital in Swaziland, Southern Africa. SAHARA J. 2014;11 : 61–66. doi: 10.1080/17290376.2014.929530 24957082
58. Mavhu W, Hatzold K, Laver SM, Sherman J, Tengende BR, Mangenah C, et al. Acceptability of early infant male circumcision as an HIV prevention intervention in Zimbabwe: a qualitative perspective. PLoS ONE. 2012;7:e32475. doi: 10.1371/journal.pone.0032475 22384258
59. Montague C, Ngcobo N, Mahlase G, Frohlich J, Pillay C, Yende-Zuma N, et al. Implementation of adolescent-friendly voluntary medical male circumcision using a school based recruitment program in rural KwaZulu-Natal, South Africa. PLoS ONE. 2014;9:e96468. doi: 10.1371/journal.pone.0096468 24788339
60. Gray RH, Wawer MJ, Kigozi G. Programme science research on medical male circumcision scale-up in sub-Saharan Africa. Sex Transm Infect. 2013;89 : 345–349. doi: 10.1136/sextrans-2012-050595 23698513
61. Watts C, Seeley J. Addressing gender inequality and intimate partner violence as critical barriers to an effective HIV response in sub-Saharan Africa. J Int AIDS Soc. 2014;17 : 19849. doi: 10.7448/IAS.17.1.19849 25499456
62. Croce-Galis M, Hardee K, Gay J. Scaling up evidence informed HV prevention for adolescent girls and young women. 2014 Jun [cited 8 Aug 2016]. Available: http://www.whatworksforwomen.org/system/attachments/68/original/WWFW_Adolescent_Prevention_Brief_June_30_2014.pdf?1404142668.
63. Dhana A, Luchters S, Moore L, Lafort Y, Roy A, Scorgie F, et al. Systematic review of facility-based sexual and reproductive health services for female sex workers in Africa. Global Health. 2014;10 : 46. doi: 10.1186/1744-8603-10-46 24916010
64. Chersich MF, Luchters S, Ntaganira I, Gerbase A, Lo YR, Scorgie F, et al. Priority interventions to reduce HIV transmission in sex work settings in sub-Saharan Africa and delivery of these services. J Int AIDS Soc. 2013;16 : 17980. doi: 10.7448/IAS.16.1.17980 23462140
65. Mountain E, Mishra S, Vickerman P, Pickles M, Gilks C, Boily MC. Antiretroviral therapy uptake, attrition, adherence and outcomes among HIV-infected female sex workers: a systematic review and meta-analysis. PLoS ONE. 2014;9:e105645. doi: 10.1371/journal.pone.0105645 25265158
66. Croce-Galis M, Hardee K. What works for women and girls: evidence for HIV/AIDS interventions. Chapter 4. Prevention for key affected populations. 2012 [cited 8 Aug 2016]. Washington (District of Columbia): Health Policy Project. Available: http://www.whatworksforwomen.org/system/attachments/34/original/Prevention_for_Key_Affected_Populations.pdf?1342493628.
67. Mishra S, Sgaier SK, Thompson LH, Moses S, Ramesh BM, Alary M, et al. HIV epidemic appraisals for assisting in the design of effective prevention programmes: shifting the paradigm back to basics. PLoS ONE. 2012;7:e32324. doi: 10.1371/journal.pone.0032324 22396756
68. Sabin ML, Lazarus JV, Frescura L, Gill W, Mahy M. HIV in men who have sex with men in sub-Saharan Africa. Lancet Infect Dis. 2012;12 : 505–506. doi: 10.1016/S1473-3099(12)70150-0 22742625
69. Smith AD, Tapsoba P, Peshu N, Sanders EJ, Jaffe HW. Men who have sex with men and HIV/AIDS in sub-Saharan Africa. Lancet. 2009;374 : 416–422. doi: 10.1016/S0140-6736(09)61118-1 19616840
70. McIntyre JA. The need for HIV prevention interventions for men who have sex with men in Africa. Sex Transm Infect. 2010;86 : 82–83. doi: 10.1136/sti.2009.041640 20332365
71. Muraguri N, Temmerman M, Geibel S. A decade of research involving men who have sex with men in sub-Saharan Africa: current knowledge and future directions. SAHARA J. 2012;9 : 137–147. doi: 10.1080/17290376.2012.744176 23237068
72. Mutua G, Sanders E, Mugo P, Anzala O, Haberer JE, Bangsberg D, et al. Safety and adherence to intermittent pre-exposure prophylaxis (PrEP) for HIV-1 in African men who have sex with men and female sex workers. PLoS ONE. 2012;7:e33103. doi: 10.1371/journal.pone.0033103 22511916
73. van Griensven F, Sanders EJ. Understanding HIV risks among men who have sex with men in Africa. Sex Transm Dis. 2008;35 : 355–356. doi: 10.1097/OLQ.0b013e31816bf64c 18362856
74. Wolf RC, Cheng AS, Kapesa L, Castor D. Building the evidence base for urgent action: HIV epidemiology and innovative programming for men who have sex with men in sub-Saharan Africa. J Int AIDS Soc. 2013;16 (Suppl 3):18903. doi: 10.7448/IAS.16.4.18903 24321118
75. Tucker A, de Swardt G, McIntyre J, Struthers H. How do community-based HIV prevention programmes for men who have sex with men ‘travel’? Lessons from the Ukwazana/Zwakalani journey in South Africa. Cult Health Sex. 2015;17 : 977–989. doi: 10.1080/13691058.2015.1018948 25752360
76. McNaghten A, Kearns R, Siegler AJ, Phaswana-Mafuya N, Bekker LG, Stephenson R, et al. Sibanye Methods for Prevention Packages Program Project protocol: pilot study of HIV prevention interventions for men who have sex with men in South Africa. JMIR Res Protoc. 2014;3:e55. doi: 10.2196/resprot.3737 25325296
77. Delva W, Beauclair R, Welte A, Vansteelandt S, Hens N, Aerts M, et al. Age-disparity, sexual connectedness and HIV infection in disadvantaged communities around Cape Town, South Africa: a study protocol. BMC Public Health. 2011;11 : 616. doi: 10.1186/1471-2458-11-616 21810237
78. Gregson S, Nyamukapa CA, Garnett GP, Mason PR, Zhuwau T, Carael M, et al. Sexual mixing patterns and sex-differentials in teenage exposure to HIV infection in rural Zimbabwe. Lancet. 2002;359 : 1896–1903. doi: 10.1016/S0140-6736(02)08780-9 12057552
79. Choudhry V, Ambresin AE, Nyakato VN, Agardh A. Transactional sex and HIV risks—evidence from a cross-sectional national survey among young people in Uganda. Global Health Action. 2015;8 : 27249. doi: 10.3402/gha.v8.27249 26001780
80. Underwood C, Skinner J, Osman N, Schwandt H. Structural determinants of adolescent girls’ vulnerability to HIV: views from community members in Botswana, Malawi, and Mozambique. Soc Sci Med. 2011;73 : 343–350. doi: 10.1016/j.socscimed.2011.05.044 21724310
81. Li Y, Marshall CM, Rees HC, Nunez A, Ezeanolue EE, Ehiri JE. Intimate partner violence and HIV infection among women: a systematic review and meta-analysis. J Int AIDS Soc. 2014;17 : 18845. doi: 10.7448/Ias.17.1.18845 24560342
82. Wamoyi J, Mshana G, Mongi A, Neke N, Kapiga S, Changalucha J. A review of interventions addressing structural drivers of adolescents’ sexual and reproductive health vulnerability in sub-Saharan Africa: implications for sexual health programming. Reprod Health. 2014;11 : 88. doi: 10.1186/1742-4755-11-88 25495605
83. Stockl H, Kalra N, Jacobi J, Watts C. Is early sexual debut a risk factor for HIV infection among women in sub-Saharan Africa? A systematic review. Am J Reprod Immunol. 2013;69 : 27–40. doi: 10.1111/aji.12043 23176109
84. Drame FM, Peitzmeier S, Lopes M, Ndaw M, Sow A, Diouf D, et al. Gay men and other men who have sex with men in West Africa: evidence from the field. Cult Health Sex. 2013;15 (Suppl):7–21. doi: 10.1080/13691058.2012.748935 23237193
85. Baral SD, Friedman MR, Geibel S, Rebe K, Bozhinov B, Diouf D, et al. Male sex workers: practices, contexts, and vulnerabilities for HIV acquisition and transmission. Lancet. 2015;385 : 260–273. doi: 10.1016/S0140-6736(14)60801-1 25059939
86. Harcourt C, Donovan B. The many faces of sex work. Sex Transm Infect. 2005;81 : 201–206. 15923285
87. Powers KA, Ghani AC, Miller WC, Hoffman IF, Pettifor AE, Kamanga G, et al. The role of acute and early HIV infection in the spread of HIV and implications for transmission prevention strategies in Lilongwe, Malawi: a modelling study. Lancet. 2011;378 : 256–268. doi: 10.1016/S0140-6736(11)60842-8 21684591
88. Cohen MS, Dye C, Fraser C, Miller WC, Powers KA, Williams BG. HIV treatment as prevention: debate and commentary—will early infection compromise treatment-as-prevention strategies? PLoS Med. 2012;9:e1001232. doi: 10.1371/journal.pmed.1001232 22802728
89. Gregson S, Donnelly CA, Parker CG, Anderson RM. Demographic approaches to the estimation of incidence of HIV-1 infection among adults from age-specific prevalence data in stable endemic conditions. AIDS. 1996;10 : 1689–1697. 8970690
90. Mishra S, Boily MC, Schwartz S, Beyrer C, Blanchard JF, Moses S, et al. Data and methods to characterize the role of sex work and to inform sex work programmes in generalized HIV epidemics: evidence to challenge assumptions. Ann Epidemiol. 2016. doi: 10.1016/j.annepidem.2016.06.004
91. Stahlman S, Johnston LG, Yah C, Ketende S, Maziya S, Trapence G, et al. Respondent-driven sampling as a recruitment method for men who have sex with men in southern sub-Saharan Africa: a cross-sectional analysis by wave. Sex Transm Infect. 2016;92 : 292–298. doi: 10.1136/sextrans-2015-052184 26424712
92. Baral S, Adams D, Lebona J, Kaibe B, Letsie P, Tshehlo R, et al. A cross-sectional assessment of population demographics, HIV risks and human rights contexts among men who have sex with men in Lesotho. J Int AIDS Soc. 2011;14 : 36. doi: 10.1186/1758-2652-14-36 21726457
93. Baral S, Burrell E, Scheibe A, Brown B, Beyrer C, Bekker LG. HIV risk and associations of HIV infection among men who have sex with men in peri-urban Cape Town, South Africa. BMC Public Health. 2011;11 : 766. doi: 10.1186/1471-2458-11-766 21975248
94. Baral S, Trapence G, Motimedi F, Umar E, Iipinge S, Dausab F, et al. HIV prevalence, risks for HIV infection, and human rights among men who have sex with men (MSM) in Malawi, Namibia, and Botswana. PLoS ONE. 2009;4:e4997. doi: 10.1371/journal.pone.0004997 19325707
95. Beyrer C, Trapence G, Motimedi F, Umar E, Iipinge S, Dausab F, et al. Bisexual concurrency, bisexual partnerships, and HIV among Southern African men who have sex with men. Sex Transm Infect. 2010;86 : 323–327. doi: 10.1136/sti.2009.040162 20410078
96. Mason K, Ketende S, Peitzmeier S, Ceesay N, Diouf D, Loum J, et al. A cross-sectional analysis of population demographics, HIV knowledge and risk behaviors, and prevalence and associations of HIV among men who have sex with men in the Gambia. AIDS Res Hum Retroviruses. 2013;29 : 1547–1552. doi: 10.1089/AID.2013.0092 23875674
97. Kerr CC, Stuart RM, Gray RT, Shattock AJ, Fraser-Hurt N, Benedikt C, et al. Optima: a model for HIV epidemic analysis, program prioritization, and resource optimization. J Acquir Immune Defic Syndr. 2015;69 : 365–376. doi: 10.1097/QAI.0000000000000605 25803164
Štítky
Interní lékařstvíČlánek vyšel v časopise
PLOS Medicine
2016 Číslo 9
- Omeprazol a mechanismus hojení krvácení z peptického vředu
- Diosmin a hesperidin: Co ukazuje farmakokinetika?
- Genetický výzkum potvrdil asociaci mezi autismem a střevními obtížemi
- Porovnání farmakologických vlastností mikronizovaného diosminu a hesperidinu v terapii chronické žilní insuficience a hemoroidů
- Aktualizovaná doporučení Evropské kardiologické společnosti pro léčbu HCM
Nejčtenější v tomto čísle
- Sex Differences in Tuberculosis Burden and Notifications in Low- and Middle-Income Countries: A Systematic Review and Meta-analysis
- International Criteria for Acute Kidney Injury: Advantages and Remaining Challenges
- Potential for Controlling Cholera Using a Ring Vaccination Strategy: Re-analysis of Data from a Cluster-Randomized Clinical Trial
- The Policy Dystopia Model: An Interpretive Analysis of Tobacco Industry Political Activity
Zvyšte si kvalifikaci online z pohodlí domova
Mazová zátka a její řešení
nový kurzVšechny kurzy