
Integrative Analysis of a Cross-Loci Regulation Network Identifies as a Gene Regulating Insulin Secretion from Pancreatic Islets
Complex diseases result from molecular changes induced by multiple genetic factors and the environment. To derive a systems view of how genetic loci interact in the context of tissue-specific molecular networks, we constructed an F2 intercross comprised of >500 mice from diabetes-resistant (B6) and diabetes-susceptible (BTBR) mouse strains made genetically obese by the Leptinob/ob mutation (Lepob). High-density genotypes, diabetes-related clinical traits, and whole-transcriptome expression profiling in five tissues (white adipose, liver, pancreatic islets, hypothalamus, and gastrocnemius muscle) were determined for all mice. We performed an integrative analysis to investigate the inter-relationship among genetic factors, expression traits, and plasma insulin, a hallmark diabetes trait. Among five tissues under study, there are extensive protein–protein interactions between genes responding to different loci in adipose and pancreatic islets that potentially jointly participated in the regulation of plasma insulin. We developed a novel ranking scheme based on cross-loci protein-protein network topology and gene expression to assess each gene's potential to regulate plasma insulin. Unique candidate genes were identified in adipose tissue and islets. In islets, the Alzheimer's gene App was identified as a top candidate regulator. Islets from 17-week-old, but not 10-week-old, App knockout mice showed increased insulin secretion in response to glucose or a membrane-permeant cAMP analog, in agreement with the predictions of the network model. Our result provides a novel hypothesis on the mechanism for the connection between two aging-related diseases: Alzheimer's disease and type 2 diabetes.
Published in the journal:
. PLoS Genet 8(12): e32767. doi:10.1371/journal.pgen.1003107
Category:
Research Article
doi:
https://doi.org/10.1371/journal.pgen.1003107
Summary
Complex diseases result from molecular changes induced by multiple genetic factors and the environment. To derive a systems view of how genetic loci interact in the context of tissue-specific molecular networks, we constructed an F2 intercross comprised of >500 mice from diabetes-resistant (B6) and diabetes-susceptible (BTBR) mouse strains made genetically obese by the Leptinob/ob mutation (Lepob). High-density genotypes, diabetes-related clinical traits, and whole-transcriptome expression profiling in five tissues (white adipose, liver, pancreatic islets, hypothalamus, and gastrocnemius muscle) were determined for all mice. We performed an integrative analysis to investigate the inter-relationship among genetic factors, expression traits, and plasma insulin, a hallmark diabetes trait. Among five tissues under study, there are extensive protein–protein interactions between genes responding to different loci in adipose and pancreatic islets that potentially jointly participated in the regulation of plasma insulin. We developed a novel ranking scheme based on cross-loci protein-protein network topology and gene expression to assess each gene's potential to regulate plasma insulin. Unique candidate genes were identified in adipose tissue and islets. In islets, the Alzheimer's gene App was identified as a top candidate regulator. Islets from 17-week-old, but not 10-week-old, App knockout mice showed increased insulin secretion in response to glucose or a membrane-permeant cAMP analog, in agreement with the predictions of the network model. Our result provides a novel hypothesis on the mechanism for the connection between two aging-related diseases: Alzheimer's disease and type 2 diabetes.
Introduction
Complex diseases, such as diabetes and obesity, result from the interaction of genetic and environmental factors [1]–[3]. Approximately 170 gene loci have been robustly implicated in diabetes through genome-wide association studies [4]. Studies with knockout mouse models have identified hundreds of genes that can act autonomously to regulate insulin levels (MP:0001560) [5]. However, it is still elusive to understand the underlying mechanisms of how these loci or genes contribute to diseases.
Network modeling methods have been developed based on the premise that complex diseases are often caused by perturbation to a sub-network of genes [1], [6]–[14]. We have applied these methods to identify causal genes for diabetes-related traits in multiple experimental mouse crosses [13]–[14] and human populations [1]. These analyses suggest that potentially many thousands of genes, under the right circumstances, can affect metabolic states.
With the advancement of high-throughput technologies, such as DNA and RNA sequencing, methods that integrate various high-volume data sources are providing for more comprehensive characterizations of biological systems [15]–[18]. New methods have been developed to utilize high-dimensional data sets to infer unknown pathways, untangle gene-based regulatory networks, and identify novel disease-causing genes [13], [19]–[23]. However, studying complex diseases at a systems level is still in its infancy. New technologies for data collection and novel methodologies of data interpretation are needed for a better resolution view of the system.
In this study, we developed a network-based model to identify key genes that regulate plasma insulin levels in a B6XBTBR obese F2 cross. By applying a causality test for genes whose expression trait is linked to two loci that overlap insulin QTLs (quantitative trait loci) and integrating protein-protein interactions, we constructed a network for each of five tissues under study. We predicted that multiple genes in the pancreatic islet network may be involved in modulating plasma insulin levels in the B6XBTBR F2 cross, including App, Gria3, Grb10, Calca, and Ins1. In particular, our pancreatic islet network predicts that the Alzheimer's disease gene, amyloid precursor protein App is a negative regulator of insulin abundance in the plasma. We therefore studied insulin secretion from islets of App knockout mice. Islets from 17-wk-old, but not 10-wk-old App −/− mice showed an increase in glucose and cAMP-stimulated insulin secretion, confirming that App acts as a negative regulator of insulin secretion. This result elucidates a possible mechanism connecting two common age-related diseases, Alzheimer's disease and type 2 diabetes.
Results
We generated an F2 inter-cross between diabetes-resistant (B6) and diabetes-susceptible (BTBR) mouse strains, made genetically obese in response to the Lepob mutation [24]. The cross consisted of >500 mice, evenly split between males and females. A comprehensive set of ∼5000 genotype markers were used to genotype each F2 mouse (∼2000 informative SNPs were used for analysis), and the expression levels of ∼40 K transcripts (corresponding to 25,901 unique genes) were monitored in five tissues (adipose, liver, pancreatic islets, hypothalamus, and gastroc (gastrocnemius muscle)) that were harvested from each mouse at 10 weeks of age. In addition to gene expression, several key T2D-related traits were determined for each mouse. The medians, and 1st and 3rd quartiles for the following traits: body weight, the number of islets harvested per pancreas, HOMA, plasma insulin, glucose, triglyceride, and C-peptide are listed in Table 1.

At a genome-wide p-value<0.05, plasma insulin shows significant linkage to multiple loci in male mice, including chromosomes 2 at 59.5–82.5 cM, 6 at 0–33.66 cM, and 19 at 25–35.38 cM with LOD scores of ∼6.5, 4.4, and 5.4, respectively (Figure 1). Using linear regression modeling, the loci on chromosomes 2, 6, and 19 explain 10.6%, 6.0%, and 8.4% of the variation of plasma insulin, respectively. The top two loci at chromosomes 2 and 19 jointly explain 16.8% of the variance (Figure S1). The top two loci are significant at genome-wide p-value<0.01, and are consistent with the results of another independent F2 cross from the same two strains Stoehr et al. [25].

To elucidate the gene-gene interactions underlying the heritability of plasma insulin, we examined gene expression profiles in several key tissues and extended the causality method to construct a protein interaction network for genes with expression quantitative trait loci, or eQTLs linked to insulin loci. To simplify the interaction models, we modeled the effects of two loci. Further analysis focused on interactions of genes with eQTLs linked to the top two plasma insulin loci, at chromosomes 2 and 19. We hypothesize that the joint regulation of plasma insulin at the two QTLs is mediated by gene-gene interactions whose expression variations are linked to the two loci. We further developed a novel ranking algorithm to infer candidate genes for regulation of plasma insulin.
Identifying genes with overlapping eQTLs with the insulin QTLs
Treating gene expression as a phenotypic trait, we computed eQTLs, for all genes expressed in pancreatic islets, white adipose tissue, liver, hypothalamus, and gastroc muscle of each male F2 mouse. We hypothesized that genes with eQTLs that co-localized with insulin QTLs are co-regulated by common genetic factors [13]. We identified eQTLs within each tissue that had LOD profile peaks on chromosomes 2 and 19, the same genomic regions containing the peak insulin linkages. Among genes physically located within the insulin QTLs on chromosome 2 or 19 (Table S1), 89 genes have cis-eQTLs (gene expression QTLs are mapped to within 10 Mb of the genomic location of the genes) in islet, 66 in white adipose tissue, 52 in liver, 51 in hypothalamus, and 5 in gastroc have cis-eQTLs. Clearly, genes with cis-eQTLs may play significant roles in modulating insulin and methods have been developed to identify the causal genes with cis-eQTLs for various phenotypic traits [14], [26]–[27]. However, each gene with a cis-eQTL can only explain the variance in the trait linked to its location. Here we considered a complementary strategy where we focused on genes with trans-eQTLs and interactions among them that integrate perturbations from multiple loci. As a greater number of genes showed trans-linkage, it is worth studying the potential mechanisms by which these genes jointly mediate the phenotypic variation.
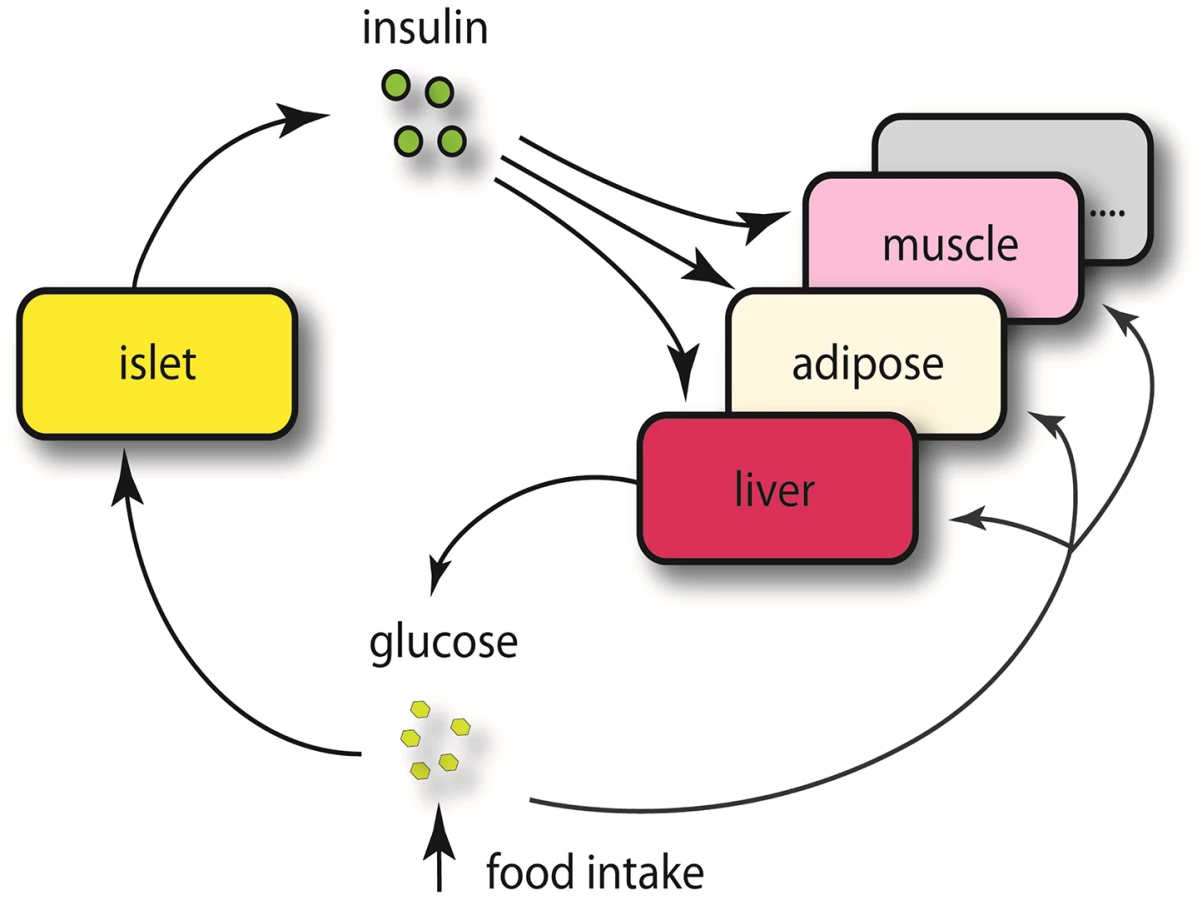
The expression traits that overlapped with the insulin QTLs were tissue-specific, and are enriched in different GO biological pathways (Table S2). The largest number of these traits was from pancreatic islets (Table 2, Figure 2). In addition, islets contained the largest proportion of eQTLs that showed linkage to both loci on chromosomes 2 and 19, indicating that similar to traditional complex traits (e.g. insulin), gene expression is also regulated by multiple genetic loci [28]. Co-localization of gene eQTLs and plasma insulin QTLs does not imply the gene is related to plasma insulin regulation. To filter out genes that, while linked to the same QTL region as insulin QTLs, are likely independent of plasma insulin regulation (described in Methods and Text S1), we applied a genetic causality test developed by Schadt et al. [13] to further narrow our list of candidate regulatory genes. Given the known feedback loop (shown in Figure 3) (islets – insulin levels – peripheral tissues, and – glucose levels), genes supported as either causal (QTL <$>\scale 80% \raster="rg1"<$> gene <$>\scale 80% \raster="rg1"<$> insulin), or reactive with respect to insulin levels (QTL <$>\scale 80% \raster="rg1"<$> insulin <$>\scale 80% \raster="rg1"<$> gene) were identified for consideration as insulin regulation genes.


Constructing protein–protein interaction network for genes with common eQTLs
A model considering the two loci, on chromosomes 2 and 19, accounts for a greater part of the variation in plasma insulin than a single locus model. Several models of various degrees of complexity could explain the joint regulation of a common trait by multiple loci. As plotted in Figure 4A, the simplest case (M1) would be that the two loci directly regulate the same gene and that such a gene is responsible for modulating the trait. A slightly more complex case (M2) would be each locus regulates a different gene, which could collaborate directly through protein-protein physical interaction to influence the trait. In model M3, genes regulated by different loci interact indirectly and multiple steps exist before the perturbation signals merge on the common trait. In model M4, multiple tissues and their interactions are involved in regulating the trait. Here, we developed an approach that seeks to combine the first two models to identify those components of the network underlying insulin regulation that are modulated by the chromosome 2 and 19 genetic loci and that may be physically interacting. The more complex models is not considered here but left for future work. As shown in Figure 4B, genetic variation at a single locus results in perturbations of biological functions that are reflected in the transcripts, or nodes, linked to that locus (orange or green nodes). Genetic variation at two loci could result in a larger functional influence on nodes showing linkage to both loci (yellow nodes) or nodes interacting across the two sub-networks (nodes connected by red edges).

Here we only consider the situation in which single genetic variations are synergistic, although antagonistic relationships may certainly occur. We hypothesize that nodes mediating the interaction between the two sub-networks are critical points for integrating the effects of multiple loci. To identify and rank these critical nodes, we developed an algorithm for assessing a gene's potential for being such an integrator in each of five tissues. We first collected a mouse protein-protein interactome by combining information from various databases as previously described [20], where most interactions were experimentally derived and manually curated. We then extract tissue-specific networks by mapping genes with eQTLs overlapping insulin QTLs on chromosome 2 or 19 onto this interactome and considering only interactions across the two eQTL gene groups. Islets contain the greatest number of genes involved in a cross group interaction (listed in Table S3) between the sub-networks showing linkage to chromosomes 2 or 19 (Table 3).

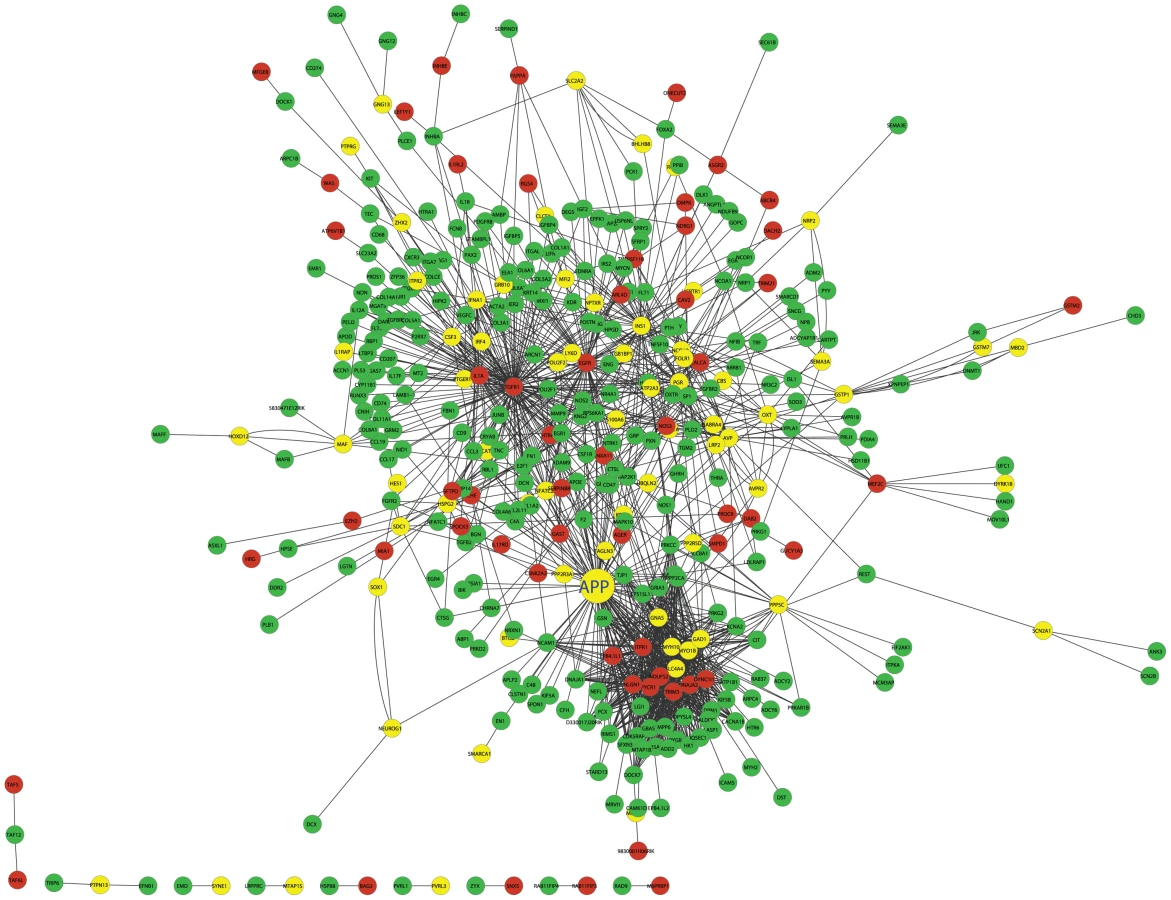
Figure 5 illustrates the islet protein-protein interaction network constructed from gene transcripts showing linkage to either chromosome 2, 19 or both loci. Genes contained within the islet network are significantly enriched for several gene ontology (GO) categories (Table S4), such as “neuron projection” ( p = 5.6×10⁻⁸), “extracellular space” (p = ), and “hormone activity” (p = 3.2×10⁻⁶). These results demonstrate that our network identifies gene sets with common biological functions and some of these functions appear to be related to insulin secretion.
Prioritization of genes based on cross-group interactions
As shown in Figure 5, many genes are supported as being involved in cross group interactions and could conceivable play a critical role in regulating plasma insulin levels. To assess their potential in mediating cross group interactions and regulating clinical traits, we designed a novel ranking algorithm that integrates Trait, protein-protein Interaction, and gene Expression (referred to as, TIE score) to identify those genes most likely to play a critical role in insulin regulation. Instead of focusing on the property of individual genes, the TIE score incorporates an Interaction Potential (IP) between a protein pair. Because PPI data are not assayed in a relevant physiological context, we leverage the expression data, which is assayed in a relevant context, to weigh whether a protein interaction pair is relevant to our context of interest (i.e., interactions between diabetes-relevant tissues in the cross population). There are many post-transcriptional and post-translational modifications that may impact protein-protein interactions and their resulting functional activities. However, these modifications cannot be inferred by gene expression profiling. For a pair of proteins known to interact, we make the simplifying assumption that their protein activities and binding affinity do not change. We further assume a strong interaction potential (IP) if both genes are highly expressed in a mouse relative to the two genes in other F2 mice (since protein-protein association rates depend on protein concentrations in a simple diffusion model); if one or the other gene has relatively low expression, the IP will be weaker. We then calculate the correlation between the IP and trait, yielding a Trait – IP Correlation (TIPC). The TIPC represents the potential of an interaction (instead of individual genes) in regulating a clinical trait. Using TIPC as a weight for each interaction in the protein-protein interaction network, the TIE score is then computed for each node based on the small sub-network formed by the node and its direct neighbors (see Method for details). A node receives a high TIE score if it has numerous interactions with large TIPC values. TIE scores are context dependent so that a given gene may have different TIE scores in different tissues, given that the levels of its own expression and that of its interaction partners' may be different between tissues. In contrast to other network-based approaches [29]–[31], the TIE score enables us to identify key nodes within a network that have multiple protein interactions with neighboring nodes, where such interactions are supported as exerting a strong influence on the particular clinical trait under investigation (in our case, plasma insulin levels).
For ranking purposes, we limit our calculation to genes with 5 or more interactions and set the TIE score to zero for the rest of the genes, given genes with too few interactions may spuriously influence the TIE score and thus lead to unreliable results. We also permutated gene expression for the nodes in the network a thousand times and calculated the empirical distribution of TIE scores to assess the significance of derived TIE scores (see supplementary methods in Text S1).
Pancreatic islets had the greatest number of genes with a significant non-zero TIE score (Table 4, and listed in Table S5). Adipose tissue had many fewer genes with a non-zero TIE-score (listed in Table S6) than islets, and the other three tissues had no genes with non-zero TIE scores, suggesting that protein-protein interactions in these tissues may not be the mechanism underlying the cross-locus regulation of plasma insulin involving chromosomes 2 or 19. The top 5 ranked genes for both adipose and islet tissues are given in Table 4. Our result suggests that pancreatic islets contribute the most to variation in plasma insulin in our F2 cross between B6 and BTBR mice. Circulating levels of plasma triglyceride, an indicator of insulin resistance, showed no significant genetic linkage (Figure S2), suggesting that factors controlling insulin resistance may be distinct from that controlling plasma insulin in our B6XBTBR-ob/ob F2 cross.

Top ranked genes in adipose tissue and islets
Cdkn1a (cyclin-dependent kinase inhibitor 1 A), the top ranking gene in adipose tissue, is a potent cyclin-dependent kinase inhibitor ( p-value = ). The protein binds to and inhibits the activity of cyclin-Cdk2 or –Cdk4 complexes, and thus functions as an inhibitor of cell cycle progression at G1. The expression of this gene is tightly controlled by the tumor suppressor protein p53, in response to a variety of stress stimuli [32]. Previous reports demonstrate that p53 expression in adipose tissue is crucially involved in the development of insulin resistance [33]. The p21 KO mouse (Cdkn1a−/−) showed 90% increase in fat pad weights, 70% increase of adipocyte numbers, and insulin resistance [34].
Compared to the top scores in adipose tissue, the top scores for genes in the islet network are much higher (Table 4), suggesting a greater number of genes in islet make a larger contribution to insulin variation. The top ranked gene in the islet network is App (Amyloid β Precursor Protein). Successive proteolytic processing of APP by β - and γ - secretase enzymes generates the amyloid-β peptide, a primary component of amyloid plaques, which are thought to be central to the etiology of Alzheimer's disease (AD) [35]. Although this gene has been heavily studied by AD researchers, its relevance in type 2 diabetes is much less known. In addition to App, several other genes with high TIE scores could potentially be involved in regulating plasma insulin. Wang et al. showed that peripheral-tissue-specific knockout of Grb10 results in enhanced insulin sensitivity in vivo [36] that could be due to the loss of Grb10-mediated degradation of the insulin receptor [37]. More recently, disrupting Grb10 is shown to increase pancreatic beta cell mass and reduce beta cell apoptosis in mice [38]. The enrichment of genes previously shown to participate in the regulation of circulating insulin in the top islet gene list, such as Grb10 and insulin Ins1, supports our use of TIE to identify novel regulators of insulin.
App negatively regulates insulin secretion from pancreatic islets
The expression of App in islets strongly negatively correlates with plasma insulin levels in the F2 cross (Pearson correlation R = −0.68, p-value≪0.01, Figure S3). We have previously characterized the difference in diabetes susceptibility between the two parental mouse strains [24]. At 10 weeks of age, BTBR-ob/ob mice are diabetic, whereas B6-ob/ob remain euglycemic. BTBR-ob/ob mice have lower plasma insulin and a higher level of App in islets than B6-ob/ob mice (difference in App expression p-value∼0.05, Figure S4), which is consistent with the negative correlation that we observed in the F2 cross. The distributions of the islet App expression levels as a function of genotype at the Chr. 2 and 19 loci (Figure S5) indicate that F2 mice with BTBR genotypes at the two loci have higher islet App expression, consistent with App gene expression negatively correlating with plasma insulin levels.
Previous work has shown that compared to wild-type mice, whole-body App knockout mice (App−/−) have reduced plasma glucose and elevated insulin secretion in response to an intravenous glucose injection [39]. Given that App is expressed in multiple tissues, including the brain where it may regulate neurogenesis [40], we sought to determine if the changes observed in App−/− mice reflect direct or indirect effects of App on islet function and/or health.
To assess whether the loss of App has a direct impact on islet function, we monitored insulin secretion ex vivo from pancreatic islets collected from either wild-type or App−/− mice (Figure 6). At 10 weeks of age, insulin secretion from wild-type versus App−/− mice was not different (Figure 6A). However, at 17 weeks of age insulin secretion was elevated ∼2–3-fold from App−/− islets in response to glucose (p-value<0.05), a depolarizing concentration of KCl (p-value<0.01), or a membrane-permeant analogue of cAMP (p<0.01) (Figure 6B). The amount of insulin per islet (insulin content) was not significantly different between wild-type and App−/− mice (Figure S6). Further, insulin secretion in response to basal glucose concentration (1.7 mM) at either 10 or 17 weeks of age was not significantly different between wild-type and App−/− mice (Figure 6, inserts). These results suggest that App directly functions as a negative regulator of insulin secretion in islets, and this only occurs in older mice.

Discussion
We developed a novel network model that integrates genetic, transcription and protein-protein interaction information to pinpoint App as a key insulin regulatory molecule in pancreatic islet tissue. The computational model we developed has several unique features.
Instead of pursuing cis-regulating genetic factors, it focused on networks of genes that were trans-regulated. The goal was not to identify the genetic factors whose variation at DNA level would lead to changes in circulating insulin. Instead, the model identifies networks of genes showing transcriptional changes as result of variation in the genetic factors. This is based on the assumption that the disease phenotype is at least partially mediated by these transcriptional changes. Genes identified by this approach could also have a more direct link to the disease phenotype compared to the upstream genetic factors. The model also simultaneously considered multiple loci, which enabled the study of the interactions between trans-regulated gene modules. As it is extremely common for complex disease phenotype traits to map to multiple loci, it is clear that we need models considering the joint effects of multiple loci. Ideally such models should not only be meaningful in the mathematical terms, but also provide biological insight to the possible mechanisms. Although the linear regression model indicated a joint regulation of the insulin trait, it did not generate any hypotheses on how the joint regulation occurred biologically.
Compared to other network models, such as co-expression network [41], ARACNE [9], and Bayesian network [22], [42], which focus on grouping co-expression of individual genes, our method focuses on dissecting potential mechanisms of integrating information from multiple co-expression modules. By considering the protein-protein interactions across the two groups of genes, it is possible to actually identify potential molecular mechanisms involved in joint regulation. Although currently the protein-protein interaction dataset we compiled may be rather incomplete, hundreds of genes were connected by these interactions. This makes prioritizing genes for experimental validation a more important task compared to finding out what could have been missed due to incomplete protein interaction information. To prioritize the key nodes in the disease network, we developed the novel scoring system in the context of the protein interaction network. As we posit that proteins their function by interacting with their neighbors in the network, the TIE score gives a weighted estimation on how strongly the intensity of these interactions correlates with the phenotype. A gene with high TIE score suggests that the intensity of its interactions strongly correlates with the phenotype based on large numbers of interactions. Therefore, the gene is likely to regulate the trait. By integrating genetic, gene expression, and phenotypic trait information, the ranking algorithm identified biologically meaningful candidate insulin regulators.
A previous publication has shown that, compared to wild-type mice, whole-body App knockout mice (App−/−) have elevated insulin secretion in response to an intravenous glucose injection [39]. A recent study of the cross of App transgenic mice and T2D predisposition mice shows that increased Aβ production impairs insulin signaling and accelerates insulin resistance [43]. To our knowledge, however, no other studies have demonstrated a direct effect of APP on islet function. Given that App is highly expressed in pancreatic islets [44]–[45], we sought to determine if the changes observed in App−/− mice reflect direct or indirect effects of App on islet function. Our measurements of glucose stimulated insulin secretion in isolated islets from App KO mice confirms our network analysis and is also consistent with the causality test [13] which also indicates App as a causal gene in pancreatic islet tissue (Figure S7). The model demonstrates that App is under the regulation of multiple genetic loci, and may function as an integrator for these perturbation signals, mediating interactions between two distinct gene sets that share a common genetic architecture with plasma insulin.
We have previously shown that Lepob/ob mutation exposes a strain-dependent difference in diabetes susceptibility between BTBR and B6 mice [25]. In the current study we exploited this difference and used it as a “sensitized screen” to genetically map genes and diabetes-related clinical traits that may underlie this difference. This approach allowed us to identify App as a key negative regulator of insulin secretion from pancreatic islets. In this study, we compared wild-type and App−/− mice to test for a direct role of App in insulin secretion in mice not expressing the Lepob/ob mutation. In these studies, the loss of App resulted in enhanced insulin secretion, consistent with the strong negative relationship between islet App and circulating insulin across the F2 samples. These results suggest that while leptin deficiency was critical in revealing the islet network involving App and circulating insulin, it was not required to demonstrate the direct role of App in insulin secretion.
Our results, which demonstrate a difference in insulin secretion between islets collected from wild-type and those collected from App−/− mice at 17 weeks, but not 10 weeks of age, implies an age-dependence for the role that App plays in the islet. However, studies in mouse [46] and human islets [47] have not reported an age-dependent change in App expression. It is possible that proteolytic processing of App mediated by the beta - and gamma-secretase enzymes, or other forms of post-translational modification, are necessary for App to regulate insulin secretion.
Mouse and rat beta cells are more sensitive to oxidative stress than human beta cells [48]–[49], due to the relatively higher expression of antioxidant enzymes in human beta cells [47], [50]. We showed that the sub-network regulating plasma insulin level variation (Figure 5) is enriched for GO categories “neuron projection” (p = 5.6×10⁻⁸), “extracellular space” (p = 4.03×10⁻⁷), and “hormone activity” (p = 3.2×10⁻⁶). Genes involved in the stress response process are not enriched in the subnetwork. Recent RNAseq data [47] suggests that APP robustly expresses in human islet cells. In addition, it has been shown that aggregated amyloid-β peptide as well as other proteins have been detected at higher levels in pancreatic islets of T2D patients comparing to healthy control people [51]. These suggest that the subnetwork and key regulators in mouse islet we identified in the F2 cross are expected to be relevant in human islets. Our findings support the hypothesis that APP contributes to the common pathogenesis of AD and T2D [52].
For the future development, (1) a generalized multi-way interaction model is needed to capture complex interaction networks underlying complex traits such as plasma insulin; (2) additional experiments are needed to systematically validate candidate genes (such as genes in Table S5 and genes connected to App in Figure 5) for their roles in affecting β-cell function which in turn affect insulin production and insulin secretion; (3) the molecular mechanism of age-dependent App regulating insulin secretion is warrant further study.
In conclusion, using an integrative analysis of gene expression, genotypes, and phenotypic traits of the B6xBTBR ob/ob F2 cross, we showed that plasma insulin is modulated by the variation of multiple genetic factors, presumably through expression changes of hundreds of genes in multiple tissues. Our approach focused on revealing the underlying disease network across loci and tissues. The model predicted that App acts in pancreatic islets to affect plasma insulin. This prediction was tested in isolated islets where the knockout of App was associated with increased insulin secretion. Considering App is known for Alzheimer's disease development and a strong association between T2D and AD, our findings point to a potential mechanism through which these two diseases are linked.
Materials and Methods
Animal husbandry, tissue collection, and molecular profiling
All animal studies were conducted at the University of Wisconsin in the Biochemistry Department in accordance with NIH guidelines and the University of Wisconsin Research Animals Resource Center. App−/− mice were purchased from the Jackson Labs (stock number 004133). C57BL/6J (B6) ob/+ male and BTBR ob/+ female mice were bred to obtain F1 ob/ob mice [24]. Leptin deficiency causes infertility [53]–[54]. To restore fertility to F1 ob/ob mice, at approximately 4 weeks of age the F1 ob/ob male and female mice each received subcutaneous transplants of white-adipose tissue from lean (leptin-competent) litter mate donor mice, resulting in the restoration of fertility in >90% of the F1 ob/ob mice. The F1 ob/ob mice were then bred to produce a panel of ∼550 F2 ob/ob mice. At 10 weeks of age, the F2 ob/ob mice were sacrificed and tissues collected (islet, white adipose, liver, gastroc muscle, and hypothalamus). Gene expression was profiled on an Agilent custom murine gene expression microarray consisting of 4,732 control probes and 39,558 non-control oligonucleotides extracted from mouse Unigene clusters and combined with RefSeq sequences and RIKEN full-length cDNA clones. All F2 mice were genotyped with the Affymetrix 5 K SNP array, which identified ∼2,000 SNPs that were polymorphic between B6 and BTBR mice that spread uniformly across genome. Various clinical traits were measured for each mouse just prior to sacrifice. See Supplementary materials (Text S1) for additional description of methods.
Isolation of pancreatic islets
Intact pancreatic islets were isolated from mice using a collagenase digestion procedure [55]. Briefly, the mice were sacrificed and the pancreases immediately inflated with 5 ml Hanks Buffered Salt Solution (HBSS) supplemented with 0.02% BSA and collagenase (0.5 mg/ml). After inflation, the pancreata were carefully dissected from the mice, placed in 25 ml of HBSS/BSA/collagenase, and incubated for 16 min at 37°C, with intermittent agitation. A ficoll gradient was used to partially purify islets from the digested pancreata, and further purified by hand-picking the islets viewed under a stereo-microscope. Media used for isolation and insulin secretion studies was a Krebs-Ringer Bicarbonate Buffer (KRB) containing (in mM): 118.41 NaCl, 4.69 KCl, 2.52 CaCl2, 1.18 MgSO4, 1.18 KH2PO4, 25 NaHCO3, and 5 HEPES.
Plasma insulin measurement
For the measurement of plasma insulin, all mice were fasted beginning at 8 AM, by transfer to a clean cage and provided water ad libitum. Approximately 4 hours later, ∼0.1 ml of blood was collected via retro-orbital draw, transferred to a tube containing 3 µl of 0.5 mM EDTA as the anti-coagulant, and then centrifuged (5 mins, 10,000×g, 4°C) to isolate plasma. The level of plasma insulin was measured as described previously [24]. Briefly, high-binding plates (Corning) were coated overnight with 3 µg/mL of an anti-insulin antibody (D6C4, Research Diagnostics), blocked with PBS containing 4% RIA-grade BSA (Sigma) for 1 h and then incubated for 1 h with insulin standards (Linco Research, 0.1–10 ng/mL) or 25 µl whole plasma. An anti-proinsulin antibody (1 µg/ml of D3E7-BT, Research Diagnostics) was added and incubated for an additional hour. After extensive washing (50 mM Tris, 0.2% Tween-20, pH 8.0), 1 µg/mL of streptavidin-HRP (Pierce) in PBS/0.1% BSA was added and incubated for 30 min. Following additional washes, 16 µmol/ml of o-phenylenediamine (Sigma), dissolved in citrate buffer (0.1 M citrate-phosphate, 0.03% H2O2 at pH 5.0), was added and incubated for 30 min; 0.18 M sulfuric acid was used to quench the reaction. Absorbance at 492 nm was determined by a plate reader (Ultra 384 TECAN). Insulin contents in plasma were calculated by comparison to known standards.
Insulin secretion
Three islets of equivalent size were placed in 12×75-mm glass tubes, where the bottom of the tube was formed by a 62-µm mesh (Elko Filtering Co.). The 12×75-mm tubes were transferred to 16×100-mm tubes containing 1 ml of KRB with 1.7 mM glucose and 0.5% BSA and pre-incubated at 37°C for 45 min. Following the pre-incubation, the 12×75-mm tubes were transferred to a fresh 16×100-mm tube containing 1 ml KRB supplemented with 1.7, 11.1 or 16.7 mM glucose, with or without additional KCl or 8-Br-cAMP as indicated. For studies where 40 mM KCl was added to the secretion medium, NaCl was reduced to 78.41 mM to maintain osmolarity. Following a 45-min incubation period at 37°C, the 12×75-mm tubes were transferred to a fresh tube containing 1 ml of HCl-ethanol-water (1∶50∶14) to extract cellular insulin from the islets. The incubation media was collected and frozen for insulin determination by ELISA.
cQTL/eQTL mapping and testing for causal versus reactive genes
Insulin trait cQTL and gene eQTL mapping were performed using scanone function in R package R/qtl [56]. The causality test was described previously [13] and a Bayesian network version was used to conduct the test.
Network construction and TIE scores for ranking genes involved in cross-group interaction
The global mouse protein-protein interaction network was collected as described previously [20]. For two interacting proteins and , we define an Interaction Potential (IP) for the protein pair in an individual mouse as


Supporting Information
Zdroje
1. EmilssonV, ThorleifssonG, ZhangB, LeonardsonAS, ZinkF, et al. (2008) Genetics of gene expression and its effect on disease. Nature 452 : 423–428.
2. ManolioTA (2010) Genomewide association studies and assessment of the risk of disease. N Engl J Med 363 : 166–176.
3. ManolioTA, CollinsFS, CoxNJ, GoldsteinDB, HindorffLA, et al. (2009) Finding the missing heritability of complex diseases. Nature 461 : 747–753.
4. HindorffL, SethupathyP, JunkinsH, RamosE, MehtaJ, et al. (2009) Potential etiologic and functional implications of genome-wide association loci for human diseases and traits. Proceedings of the National Academy of Sciences of the United States of America 106 : 9362–9369 (Available at: www.genome.gov/gwastudies. Accessed on Feb 1st, 2012).
5. EppigJT, BlakeJA, BultCJ, KadinJA, RichardsonJE, et al. (2007) The mouse genome database (MGD): new features facilitating a model system. Nucl Acids Res 35: D630–637.
6. GhazalpourA, DossS, ZhangB, WangS, PlaisierC, et al. (2006) Integrating genetic and network analysis to characterize genes related to mouse weight. PLoS Genet 2: e130 doi:10.1371/journal.pgen.0020130.
7. SiebertsS, SchadtE (2007) Moving toward a system genetics view of disease. Mammalian Genome 18 : 389–401.
8. SchadtEE, LumPY (2006) Thematic review series: Systems Biology Approaches to Metabolic and Cardiovascular Disorders. Reverse engineering gene networks to identify key drivers of complex disease phenotypes. J Lipid Res 47 : 2601–2613.
9. BassoK, MargolinAA, StolovitzkyG, KleinU, Dalla-FaveraR, et al. (2005) Reverse engineering of regulatory networks in human B cells. Nat Genet 37 : 382–390.
10. LeeSI, DudleyAM, DrubinD, SilverPA, KroganNJ, et al. (2009) Learning a prior on regulatory potential from eQTL data. PLoS Genet 5: e1000358 doi:10.1371/journal.pgen.1000358.
11. BandyopadhyayS, MehtaM, KuoD, SungMK, ChuangR, et al. (2010) Rewiring of genetic networks in response to DNA damage. Science 330 : 1385–1389.
12. LeeSI, Pe'erD, DudleyAM, ChurchGM, KollerD (2006) Identifying regulatory mechanisms using individual variation reveals key role for chromatin modification. Proc Natl Acad Sci U S A 103 : 14062–14067.
13. SchadtEE, LambJ, YangX, ZhuJ, EdwardsS, et al. (2005) An integrative genomics approach to infer causal associations between gene expression and disease. Nat Genet 37 : 710–717.
14. ChenY, ZhuJ, LumPY, YangX, PintoS, et al. (2008) Variations in DNA elucidate molecular networks that cause disease. Nature 452 : 429–435.
15. CheungVG, SpielmanRS, EwensKG, WeberTM, MorleyM, et al. (2005) Mapping determinants of human gene expression by regional and genome-wide association. Nature 437 : 1365–1369.
16. BremRB, KruglyakL (2005) The landscape of genetic complexity across 5,700 gene expression traits in yeast. Proc Natl Acad Sci USA 102 : 1572–1577.
17. ZhuJ, SovaP, XuQ, DombekK, XuE, et al. (2012) Stitching together Multiple Data Dimensions Reveals Interacting Metabolomic and Transcriptomic Networks That Modulate Cell Regulation. PLoS Biol 10: e1001301 doi:10.1371/journal.pbio.1001301.
18. SchadtEE, MonksSA, DrakeTA, LusisAJ, CheN, et al. (2003) Genetics of gene expression surveyed in maize, mouse and man. Nature 422 : 297–302.
19. SuthramS, BeyerA, KarpRM, EldarY, IdekerT (2008) eQED: an efficient method for interpreting eQTL associations using protein networks. Mol Syst Biol 4.
20. TuZ, ArgmannC, WongKK, MitnaulLJ, EdwardsS, et al. (2009) Integrating siRNA and protein-protein interaction data to identify an expanded insulin signaling network. Genome Research 19 : 1057–1067.
21. LefebvreC, RajbhandariP, AlvarezMJ, BandaruP, LimWK, et al. (2010) A human B-cell interactome identifies MYB and FOXM1 as master regulators of proliferation in germinal centers. Mol Syst Biol 6 : 377.
22. ZhuJ, ZhangB, SmithEN, DreesB, BremRB, et al. (2008) Integrating large-scale functional genomic data to dissect the complexity of yeast regulatory networks. Nat Genet 40 : 854–861.
23. ZhuJ, LumPY, LambJ, GuhaThakurtaD, EdwardsSW, et al. (2004) An integrative genomics approach to the reconstruction of gene networks in segregating populations. Cytogenet Genome Res 105 : 363–374.
24. KellerMP, ChoiY, WangP, DavisDB, RabagliaME, et al. (2008) A gene expression network model of type 2 diabetes links cell cycle regulation in islets with diabetes susceptibility. Genome Res 18 : 706–716.
25. StoehrJP, NadlerST, SchuelerKL, RabagliaME, YandellBS, et al. (2000) Genetic obesity unmasks nonlinear interactions between murine type 2 diabetes susceptibility loci. Diabetes 49 : 1946–1954.
26. DobrinR, GreenawaltD, HuG, KempD, KaplanL, et al. (2011) Dissecting cis regulation of gene expression in human metabolic tissues. PLoS ONE 6: e23480 doi:10.1371/journal.pone.0023480.
27. KilpeläinenT, ZillikensM, StančákovaA, FinucaneF, RiedJ, et al. (2011) Genetic variation near IRS1 associates with reduced adiposity and an impaired metabolic profile. Nature genetics 43 : 753–813.
28. BremRB, StoreyJD, WhittleJ, KruglyakL (2005) Genetic interactions between polymorphisms that affect gene expression in yeast. Nature 436 : 701–703.
29. DengM, TuZ, SunF, ChenT (2004) Mapping gene ontology to proteins based on protein-protein interaction data. Bioinformatics 20 : 895–902.
30. SharanR, UlitskyI, ShamirR (2007) Network-based prediction of protein function. Mol Syst Biol 3.
31. WuX, JiangR, ZhangMQ, LiS (2008) Network-based global inference of human disease genes. Mol Syst Biol 4.
32. GartelAL, RadhakrishnanSK (2005) Lost in Transcription: p21 Repression, Mechanisms, and Consequences. Cancer Research 65 : 3980–3985.
33. MinaminoT, OrimoM, ShimizuI, KuniedaT, YokoyamaM, et al. (2009) A crucial role for adipose tissue p53 in the regulation of insulin resistance. Nature medicine 15 : 1082–1089.
34. NaazA, HolsbergerD, IwamotoG, NelsonA, KiyokawaH, et al. (2004) Loss of cyclin-dependent kinase inhibitors produces adipocyte hyperplasia and obesity. The FASEB journal : official publication of the Federation of American Societies for Experimental Biology 18 : 1925–1932.
35. PalopJ, MuckeL (2010) Amyloid-beta-induced neuronal dysfunction in Alzheimer's disease: from synapses toward neural networks. Nature neuroscience 13 : 812–820.
36. WangL, BalasB, Christ-RobertsC, KimR, RamosF, et al. (2007) Peripheral disruption of the Grb10 gene enhances insulin signaling and sensitivity in vivo. Molecular and cellular biology 27 : 6497–7002.
37. RamosF, LanglaisP, HuD, DongL, LiuF (2006) Grb10 mediates insulin-stimulated degradation of the insulin receptor: a mechanism of negative regulation. American journal of physiology Endocrinology and metabolism 290 : 6.
38. ZhangJ, ZhangN, LiuM, LiX, ZhouL, et al. (2012) Disruption of Growth Factor Receptor-Binding Protein 10 in the Pancreas Enhances beta-Cell Proliferation and Protects Mice From Streptozotocin-Induced beta-Cell Apoptosis. Diabetes
39. NeedhamB, WlodekM, CiccotostoG, FamB, MastersC, et al. (2008) Identification of the Alzheimer's disease amyloid precursor protein (APP) and its homologue APLP2 as essential modulators of glucose and insulin homeostasis and growth. The Journal of Pathology 215 : 155–218.
40. ZhouZ-d, ChanC, MaQ-h, XuX-h, XiaoZ-c, et al. (2011) The roles of amyloid precursor protein (APP) in neurogenesis: Implications to pathogenesis and therapy of Alzheimer disease. Cell adhesion & migration 5 : 280–372.
41. ZhangB, HorvathS (2005) A general framework for weighted gene co-expression network analysis. Statistical applications in genetics and molecular biology 4.
42. SegalE, ShapiraM, RegevA, Pe'erD, BotsteinD, et al. (2003) Module networks: identifying regulatory modules and their condition-specific regulators from gene expression data. Nature genetics 34 : 166–242.
43. Jiménez-PalomaresM, Ramos-RodríguezJ, López-AcostaJ, Pacheco-HerreroM, Lechuga-SanchoA, et al. (2012) Increased Aβ production prompts the onset of glucose intolerance and insulin resistance. American journal of physiology Endocrinology and metabolism 302 : 80.
44. DuceJ, TsatsanisA, CaterM, JamesS, RobbE, et al. (2010) Iron-export ferroxidase activity of β-amyloid precursor protein is inhibited by zinc in Alzheimer's disease. Cell 142 : 857–924.
45. HakonenE, UstinovJ, MathijsI, PalgiJ, BouwensL, et al. (2011) Epidermal growth factor (EGF)-receptor signalling is needed for murine beta cell mass expansion in response to high-fat diet and pregnancy but not after pancreatic duct ligation. Diabetologia 54 : 1735–1778.
46. RankinM, KushnerJ (2010) Aging induces a distinct gene expression program in mouse islets. Islets 2 : 345–397.
47. EizirikDL, SammethM, BouckenoogheT, BottuG, SisinoG, et al. (2012) The human pancreatic islet transcriptome: expression of candidate genes for type 1 diabetes and the impact of pro-inflammatory cytokines. PLoS Genet 8: e1002552 doi:10.1371/journal.pgen.1002552.
48. TiedgeM, LortzS, DrinkgernJ, LenzenS (1997) Relation between antioxidant enzyme gene expression and antioxidative defense status of insulin-producing cells. Diabetes 46 : 1733–1775.
49. EizirikD, PipeleersD, LingZ, WelshN, HellerströmC, et al. (1994) Major species differences between humans and rodents in the susceptibility to pancreatic beta-cell injury. Proceedings of the National Academy of Sciences of the United States of America 91 : 9253–9259.
50. WelshN, MargulisB, BorgL, WiklundH, SaldeenJ, et al. (1995) Differences in the expression of heat-shock proteins and antioxidant enzymes between human and rodent pancreatic islets: implications for the pathogenesis of insulin-dependent diabetes mellitus. Molecular medicine (Cambridge, Mass) 1 : 806–826.
51. MiklossyJ, QingH, RadenovicA, KisA, VilenoB, et al. (2010) Beta amyloid and hyperphosphorylated tau deposits in the pancreas in type 2 diabetes. Neurobiol Aging 31 : 1503–1515.
52. JansonJ, LaedtkeT, ParisiJE, O'BrienP, PetersenRC, et al. (2004) Increased Risk of Type 2 Diabetes in Alzheimer Disease. Diabetes 53 : 474–481.
53. SwerdloffR, BattR, BrayG (1976) Reproductive hormonal function in the genetically obese (ob/ob) mouse. Endocrinology 98 : 1359–1423.
54. LindströmP (2007) The physiology of obese-hyperglycemic mice [ob/ob mice]. TheScientificWorldJournal 7 : 666–751.
55. RabagliaM, Gray-KellerM, FreyB, ShortreedM, SmithL, et al. (2005) Alpha-Ketoisocaproate-induced hypersecretion of insulin by islets from diabetes-susceptible mice. American journal of physiology Endocrinology and metabolism 289 : 24.
56. BromanK, WuH, SenS, ChurchillG (2003) R/qtl: QTL mapping in experimental crosses. Bioinformatics (Oxford, England) 19 : 889–979.
57. ClineMS, SmootM, CeramiE, KuchinskyA, LandysN, et al. (2007) Integration of biological networks and gene expression data using Cytoscape. Nat Protocols 2 : 2366–2382.
Štítky
Genetika Reprodukční medicínaČlánek vyšel v časopise
PLOS Genetics
2012 Číslo 12
- Kazuistika – Perspektivy využití precizované medicíny v rámci personalizované specifické terapie onkologických pacientů
- Nobelova cena za chemii pro genetické nůžky: Objev, který změní naši budoucnost?
- Technologie na bázi RNA v klinické praxi: od přebarvených petúnií k terapii vzácných a dosud jen obtížně léčitelných chorob u lidí
- „Nepředstavovali jsme si, že náš výzkum povede přímo ke vzniku nových léků, dokonce ještě za našeho života“
- Bezplatné služby pro diagnostiku ATTRv amyloidózy pro kardiology
Nejčtenější v tomto čísle
- Population Genomics of Sub-Saharan : African Diversity and Non-African Admixture
- Dnmt3a Protects Active Chromosome Domains against Cancer-Associated Hypomethylation
- Excessive Astrocyte-Derived Neurotrophin-3 Contributes to the Abnormal Neuronal Dendritic Development in a Mouse Model of Fragile X Syndrome
- Pre-Disposition and Epigenetics Govern Variation in Bacterial Survival upon Stress
Zvyšte si kvalifikaci online z pohodlí domova
Mazová zátka a její řešení
nový kurzVšechny kurzy