
Approaching the Functional Annotation of Fungal Virulence Factors Using Cross-Species Genetic Interaction Profiling
In many human fungal pathogens, genes required for disease remain largely unannotated, limiting the impact of virulence gene discovery efforts. We tested the utility of a cross-species genetic interaction profiling approach to obtain clues to the molecular function of unannotated pathogenicity factors in the human pathogen Cryptococcus neoformans. This approach involves expression of C. neoformans genes of interest in each member of the Saccharomyces cerevisiae gene deletion library, quantification of their impact on growth, and calculation of the cross-species genetic interaction profiles. To develop functional predictions, we computed and analyzed the correlations of these profiles with existing genetic interaction profiles of S. cerevisiae deletion mutants. For C. neoformans LIV7, which has no S. cerevisiae ortholog, this profiling approach predicted an unanticipated role in the Golgi apparatus. Validation studies in C. neoformans demonstrated that Liv7 is a functional Golgi factor where it promotes the suppression of the exposure of a specific immunostimulatory molecule, mannose, on the cell surface, thereby inhibiting phagocytosis. The genetic interaction profile of another pathogenicity gene that lacks an S. cerevisiae ortholog, LIV6, strongly predicted a role in endosome function. This prediction was also supported by studies of the corresponding C. neoformans null mutant. Our results demonstrate the utility of quantitative cross-species genetic interaction profiling for the functional annotation of fungal pathogenicity proteins of unknown function including, surprisingly, those that are not conserved in sequence across fungi.
Published in the journal:
. PLoS Genet 8(12): e32767. doi:10.1371/journal.pgen.1003168
Category:
Research Article
doi:
https://doi.org/10.1371/journal.pgen.1003168
Summary
In many human fungal pathogens, genes required for disease remain largely unannotated, limiting the impact of virulence gene discovery efforts. We tested the utility of a cross-species genetic interaction profiling approach to obtain clues to the molecular function of unannotated pathogenicity factors in the human pathogen Cryptococcus neoformans. This approach involves expression of C. neoformans genes of interest in each member of the Saccharomyces cerevisiae gene deletion library, quantification of their impact on growth, and calculation of the cross-species genetic interaction profiles. To develop functional predictions, we computed and analyzed the correlations of these profiles with existing genetic interaction profiles of S. cerevisiae deletion mutants. For C. neoformans LIV7, which has no S. cerevisiae ortholog, this profiling approach predicted an unanticipated role in the Golgi apparatus. Validation studies in C. neoformans demonstrated that Liv7 is a functional Golgi factor where it promotes the suppression of the exposure of a specific immunostimulatory molecule, mannose, on the cell surface, thereby inhibiting phagocytosis. The genetic interaction profile of another pathogenicity gene that lacks an S. cerevisiae ortholog, LIV6, strongly predicted a role in endosome function. This prediction was also supported by studies of the corresponding C. neoformans null mutant. Our results demonstrate the utility of quantitative cross-species genetic interaction profiling for the functional annotation of fungal pathogenicity proteins of unknown function including, surprisingly, those that are not conserved in sequence across fungi.
Introduction
Diseases produced by fungal infections are challenging to diagnose and treat, making these infections a major cause of morbidity and mortality worldwide [1], [2]. Genetics and genomics have led to the identification of numerous pathogen genes required for replication in the mammalian host [3]–[7]. Unfortunately, many, if not most, identified virulence genes lack in vitro phenotypes that could explain their effects in the host [3]–[8], and the predicted protein sequences often offer few clues to function. Thus, our power to identify pathogen genes required for disease far outstrips our ability to understand their molecular function in the host.
Historically, the expression of human genes in the model yeasts Saccharomyces cerevisiae and Schizosaccharomyces pombe has been used as a tool to identify specific genes and to determine their cellular function [9]–[14]. In a classic example, complementation of a fission yeast cdc2 mutant was used to identify human Cdk1 [11]. More recently, a number of groups have combined the expression of foreign genes with high-throughout tools available in S. cerevisiae to identify suppressor genes to obtain insights into the function of human proteins, ranging from those involved in neurodegeneration to cancer [9], [11], [14].
Likewise, expression of viral and bacterial proteins in yeast, coupled with subsequent genetic analysis, has proven to be informative. For example, the genes responsible for biosynthesis of the eEF2 modification diphthamide were identified in selections for resistance to the F2 fragment of diphtheria toxin [15]. Identification of S. cerevisiae gene deletion mutants hypersensitive to the expression of the Shigella virulence factor OspF, a type III secretion substrate, coupled with transcriptional profiling experiments, led to the identification of the cell wall integrity MAP kinase pathway as a likely target of OspF in yeast [10], [13]. Importantly, the latter study took advantage of phenotypic information for yeast deletion mutants available at that time to obtain clues to gene function [10].
The construction of a library of all nonessential gene deletions for S. cerevisiae [8] together with the development of genetic selections led to the development of the synthetic genetic array (SGA) method for quantitatively measuring genetic interactions on a genome scale [16], [17]. This approach has facilitated the systematic annotation of gene function in S. cerevisiae [18], [19]. Genetic interaction, or epistasis, measures the degree to which two genes affect each other [16], and is measured by comparing the phenotype of a double mutant to that of the two corresponding single mutants. Genes that act in the same pathway display similar patterns of genetic interactions with other genes [16]–[19]. Recently, the large-scale application of these methods led to production of a remarkable genome-scale genetic interaction map based on the analysis of ∼5.4 million gene pairs. Such a comprehensive genetic interaction dataset has only been described to date for the model yeast S. cerevisiae [19].
Below we test the utility a cross-species genetic interaction approach for fungal pathogen gene annotation that combines expression of pathogen genes in S. cerevisiae with genetic interaction profiling. We used genes from the human pathogen Cryptococcus neoformans, an opportunistic basidiomycete fungal pathogen that is very distantly related to the model yeasts S. cerevisiae and S. pombe. C. neoformans is the most common cause of fungal meningitis in humans, and among the most important causes of morbidity and mortality in AIDS patients, leading to ∼1 million infections and ∼600,000 deaths annually in sub-Saharan African alone [1]. Our laboratory previously generated a library of 1201 gene deletion strains and used a signature-tagged mutagenesis approach to identify genes required for pathogen fitness during experimental infection of mice [5]. In addition to identifying new genes required for the synthesis of known virulence factors, these studies identified several dozen genes required for virulence whose mutation failed to yield in vitro phenotypes that could explain its role in the host.
As a proof-of-principle, we expressed six C. neoformans genes of interest in each member of the S. cerevisiae deletion library and quantified their impact on fitness, thereby producing cross-species genetic interaction profiles. We exploited their similarities to existing S. cerevisiae knockout genetic profiles to predict possible functions for each C. neoformans protein. For two of these C. neoformans proteins, Liv6 and Liv7, we describe validation experiments that support the functional assignment. For Liv7, additional experiments connect its newly identified function to the evasion of phagocytosis, an important virulence trait. The cross-species genetic interaction profiling approach described here offers a generalizable avenue toward the functional annotation of pathogenicity factors of fungal agents of infectious disease.
Results
Cross-species genetic interaction approach
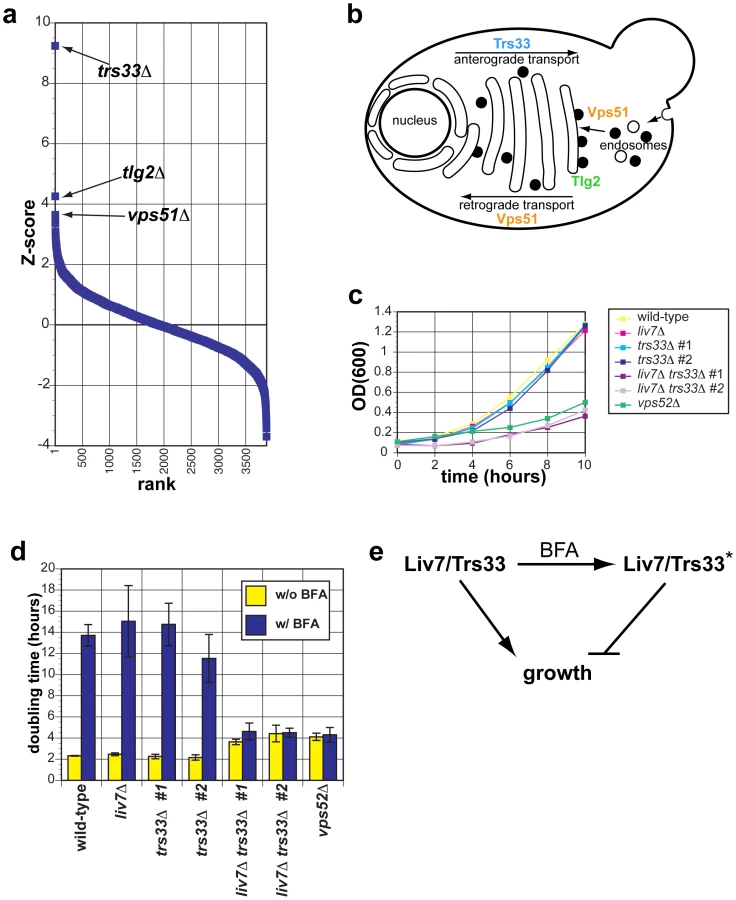
We sought to develop a generic approach for developing testable hypotheses for the function of novel C. neoformans virulence genes by taking advantage of the methods and datasets that exist in S. cerevisiae. We created S. cerevisiae strains that each expressed a C. neoformans gene of interest (described further below). We crossed these to the S. cerevisiae gene deletion library using automated SGA methods and measured fitness of the progeny strains using high-throughput colony imaging methods [16], [17] (Figure 1). Measurements (n = 8 per double mutant) were converted into significance scores (S-scores) [20] (See Methods). We refer to these data as a “cross-species genetic interaction profile” which is the set of quantitative genetic interactions between strains expressing a particular C. neoformans gene and each S. cerevisiae deletion mutant. We calculated correlations between these cross-species profiles and the available genetic interaction profiles of deletion mutants in S. cerevisiae [21]. We reasoned that the expression of a C. neoformans gene could, in some cases, produce dominant-negative effect and produce genetic interaction profiles that correlate positively with those of S. cerevisiae gene deletions that function in the homologous pathway. Alternatively, the expression C. neoformans gene might have a dominant-positive effect, producing a profile that anti-correlates with those of S. cerevisiae deletions mutants in the same pathway. Scenarios on which both behaviors occurred could also be imagined. We further expected that the expression of some, but not all, of C. neoformans genes would produce profiles that would allow us to develop experimentally testable hypothesis for gene function.

We focused on six C. neoformans genes (Figure 2 and Table S1), four of which (LIV5, LIV6, LIV7, and LIV13) our previously work identified as necessary for growth in a murine infection model [5]. Two others, BLP1 and MEP1, are targets of Gat201 [22], a master transcriptional regulator of virulence [5], [22]. Blp1 is important for C. neoformans to evade phagocytosis by macrophages. Four of these genes (LIV6, LIV7, MEP1, and BLP1) lack S. cerevisiae orthologs. Several contain conserved domains identified by BLAST [23], but the function of these domains are poorly understood (Figure 2 and Table S1). The application of PHYRE, a threading-based structure prediction algorithm, provided information for only Liv6, which it predicts to be structurally related to a lectin [24].

We generated cross-species genetic interaction profiles using S. cerevisiae strains carrying two control constructs and six different bait constructs: pGPD (promoter-only control), pGPD-GFP (nonspecific protein control), pGPD-LIV5, pGPD-LIV6, pGPD-LIV7, pGPD-LIV13, pGPD-MEP1, and pGPD-BLP1. To ensure reasonable expression levels (see Materials and Methods) used the strong GPD1 promoter because the C. neoformans genome is GC-rich [25] compared to S. cerevisiae [26], which is anticipated to inhibit protein translational efficiency due to differences in codon usage and an increased propensity to form inhibitor RNA structures [27]. We calculated Pearson correlations (correlation score) to compare cross-species genetic interaction profiles with the previously described genetic interaction profiles of produced by crosses of 1712×3885 S. cerevisiae gene deletions [19]. To avoid potentially spurious correlations, we filtered out correlations with S. cerevisiae deletions whose profiles yielded significant correlations with either of the two control baits. Significance testing revealed that correlations with a value of greater than 0.08 are highly significant (P<0.001, two-tailed test, Bonferroni-corrected for multiple hypothesis testing). Quantile-quantile plots of the correlations with S. cerevisiae deletions versus standard normal quantiles revealed outliers on one or both tails for all baits (Figure S1). We focused on correlations that departed from the mean by at least three standard deviations (|Z|>3). This conservative strategy yielded from 2–15 hits, depending on the bait (Table 1). The profile of LIV7 displays the largest number hits, and their identities strongly points to a role in Golgi transport, a prediction whose validation via experiments in C. neoformans is described below. The LIV6 profile correlates positively and negatively with two S. cerevisiae genetic profiles, those of deletions in SYN8 and ECM21, respectively. Strikingly, both genes play a role in endosome transport and/or fusion [28], [29], predicting a role for Liv6 in these processes in C. neoformans. Support for this prediction via experiments in C. neoformans is also described in this paper. Several other profile hits were obtained, but have yet to validated. The Liv5 profile correlates with those of deletions affecting the cell cycle and autophagy [30]–[32] and the Liv13 profile negatively correlates with the genetic profiles of knockouts involved in alleviating protein folding stress [33]–[35]. The profile of the MEP1 metalloprotease correlates with that of a knockout in a S. cerevisiae metalloprotease of a different family, YBR075W [23], as well as proteins involved in nucleotide and RNA metabolism. Finally, the genetic interaction profile of the S. cerevisiae strain expressing Blp1 positively correlates with that of the deletion of an S. cerevisiae gene, ETR1, that has a role in fatty acid synthesis. This observation may be related to the Rare Lipoprotein A (RlpA) domain prediction for Blp1 (Table S1).

LIV7 cross-species genetic interaction profile suggests a role in Golgi transport
Liv7 (Figure 2) is a 330-residue protein that contains a DUF3752 domain, which is annotated as a conserved domain of unknown function [36]. The profile of the S. cerevisiae strain expressing LIV7 displays the strongest three positive correlations with the published genetic interaction profiles of S. cerevisiae gene deletions trs33Δ, tlg2Δ, and vps51Δ (Figure 3A). Strikingly, all three of these genes function in transport events that involve the Golgi apparatus (Figure 3B). Trs33 is one of two nonessential subunits of the TRAPP complex, an essential vesicle tethering complex involved in ER-to-Golgi transport [37]. Vps51 is a member of the GARP complex, another vesicle tethering complex that promotes endosome-to-Golgi transport and retrograde transport within the Golgi [38]. Tlg2 is a t-SNARE that is important vesicle fusion within the Golgi [39]. These data make a strong prediction that the function of the unannotated Liv7 protein is in transport events involving the Golgi apparatus. Below we describe experiments in C. neoformans that support this prediction and additional follow-up experiments that led us to find that the Liv7 protein is required for the suppression mannose exposure on the cell surface and the suppression of mannose-dependent phagocytosis by mammalian macrophages.
LIV7 and TRS33 interact genetically in C. neoformans
Given that Trs33 is a nonessential subunit of TRAPP, we anticipated that if Liv7 functions to promote TRAPP function in C. neoformans, that its gene deletion mutation should display a synthetic lethal or synthetic sick phenotype with a deletion of TRS33 in C. neoformans. We tested this prediction by creating single and double targeted knockouts of LIV7 and an ortholog of TRS33 we identified in the C. neoformans genome. We found that wild-type, liv7Δ, and trs33Δ strains all grow at approximately the same rate, with a doubling time of two hours (Figure 3C. In contrast, the liv7Δ trs33Δ double mutant cells display a severe growth defect, having a doubling time of four hours (Figure 3C). These data demonstrate that LIV7 and TRS33 interact genetically in C. neoformans, as inferred from analysis of the cross-species genetic interaction profiles described above. We also constructed a deletion in the gene coding for a member of the C. neoformans GARP complex, Vps52 (we were unable to delete the C. neoformans VPS51 gene), and found that it displayed a growth phenotype similar to that of the liv7Δ trs33Δ double mutant.
Liv7 and Trs33 act redundantly in ER–Golgi function in C. neoformans
We next tested the hypothesis that LIV7 functions in the ER-Golgi system by using a chemical biology approach that takes advantage of the small molecule Brefeldin A (BFA). BFA is a fungal secondary metabolite that inhibits eukaryotic Sec7-family guanine nucleotide exchange factors that are involved in vesicle transport and themselves localize to the membranes of the ER and Golgi apparatus [40]–[42]. BFA blocks anterograde transport from the ER to the Golgi, fusion of ER and Golgi compartments, and loss of Golgi apparatus itself [40], [41]. We grew strains with and without a growth-inhibitory, sublethal concentration (40 µg/ml) of BFA (Figure 3D). Wild-type, liv7Δ, and trs33Δ show identical responses to BFA: a sharp increase in doubling time from two hours to over 12 hours (p≤0.01) (Figure 3D). liv7Δ trs33Δ mutants, which already exhibit slow growth (p≤0.01), do not show any further increase in their four-hour doubling time. The resistance to BFA exhibited by liv7Δ trs33Δ double mutants demonstrates that either Liv7 or Trs33 function is required for BFA to inhibit cell growth (Figure 3D). These data could be explained if Liv7 and Trs33 have a severe defect in the assembly and/or function of the Golgi apparatus (which we show to be the case below). In this scenario, the growth rate of such cells would thus not be affected by BFA since the have greatly reduced the target organelle most strongly affected by the drug. A more formal statement of such a model would be that in the absence of BFA, Liv7 and Trs33 redundantly promote growth (via a role in Golgi biogenesis), but in the presence of the drug, cells convert to a state in which either Liv7 or Trs33 inhibits growth (Figure 3E). This genetic behavior is analogous to that of the S. cerevisiae MAP kinase Kss1, which is converted from an inhibitor of filamentous growth to an activator via phosphorylation by the upstream MAP kinase Ste7 [43]. The vps52Δ mutant also displays resistance to BFA (Figure 3D).
To further test the hypothesis that Liv7 functions in the Golgi, we examined the colocalization of an mCherry-tagged version of Liv7 with compartment markers. The levels of Liv7 protein are low and we could not detect it by Western or microscopy under yeast culture conditions (data not shown). However, under the same tissue culture conditions we use to study pathogen phagocytosis (DMEM, 5% CO2, without shaking), we observed a punctate Liv7-mCherry signal that was well above background signal observed in an untagged control strain (Figure 4A–4C). To label the ER and Golgi, we briefly incubated cells with a fluorescent derivative of Brefeldin A (fBFA) [44] at sub-inhibitory concentrations (0.5 µg/ml for 40 min, 80-fold less than the minimal inhibitory concentration). To confirm that the compound was labeling the anticipated compartments, we stained a C. neoformans strain with fBFA carrying a mCherry-tagged version of the conserved Erd2 protein, which is found in both ER and Golgi compartments [45] and found that the fBFA signal colocalizes with the Erd2 signal (Figure S2). Importantly, the Liv7-mCherry colocalizes with the fBFA signal. The respective puncta co-localize in almost 100% cells that display signals for both fluorophores (Figure 4A–4C). As a control, we stained mitochondria with MitoTracker did not observe co-localization with Liv7-mCherry signal (Figure S3).

To test whether mutations LIV7 and TRS33 impact the formation of the ER and Golgi we stained single and double mutants with fBFA. Wild-type, liv7Δ, and trs33Δ strains showed similar cytoplasmic punctate staining (Figure 4D–4G). However, liv7Δ trs33Δ mutants did not exhibit detectable fBFA staining (Figure 4G), consistent with a severe defect in organelle formation. These data show that Liv7 is important in promoting organelle formation in cells lacking Trs33. Together with the impact of the mutants on BFA sensitivity and the colocalization of Liv7 with fBFA, these observations provide strong evidence for a role for Liv7 in Golgi function.
Liv7 and Trs33 suppress PAMP exposure in C. neoformans
Key functions of the Golgi include the sorting and modification of proteins and the biosynthesis of polysaccharides. The cell surface of microbes often contain pathogen-associated molecular patterns (PAMPs), molecular signatures that are recognized by the mammalian immune system [46]. Previous studies of the human fungal pathogen Candida albicans has shown that there are mechanisms by which this pathogen masks PAMPs to order to avoid recognition by neutrophils [47]. To test whether LIV7 or TRS33 are involved in PAMP exposure, we examined the cell surface exposure of two well-established fungal PAMPs, mannose and β-glucan. These experiments were performed in tissue culture conditions, which modestly induces production of the C. neoformans polysaccharide capsule. In addition, we stained cells for the glucuronoxylomannan (GXM) component of the capsule and as well as the cell wall polysaccharide chitin. We used an antibody to detect glucuronoxylomannan (GXM) component of C. neoformans polysaccharide capsule (Figure 5A), the lectin CBP to detect chitin (Figure 4A), an antibody to detect β-glucan (Figure 5B), and the lectin concanavalin A (conA) to detect exposure of mannose (Figure 5C). Wild-type, liv7Δ, and trs33Δ all showed similar PAMP exposure, with modest staining of β-glucan and mannose under tissue culture growth conditions (Figure 5A–5C). We also observed modest staining using reagents that detect chitin and GXM (Figure 5A–5C).

In contrast, we observed strikingly different results in liv7Δ trs33Δ double mutant cells and in the vps52Δ mutant. Most remarkably, we observed a dramatic increase in mannose exposure in these mutants as measured by conA staining (Figure 5C). In contrast, GXM or β-glucan staining is virtually eliminated (Figure 5A, 5B). The chitin signal is reduced in intensity and localizes to a focus at the cell pole. The increase in conA signal cannot be explained by the lack of capsular GXM in the double mutant, as GXM - and capsule-deficient mutant strains cap10Δ [48] and cap60Δ [48], [49] do not exhibit this phenotype (Figure 5C). These data suggest that LIV7 and TRS33 act redundantly in the transport of molecules required to suppress the exposure of mannose on the cell surface and that the integrity of the GARP complex is also required for this process.
Liv7 prevents mannose-dependent phagocytosis of C. neoformans by macrophages
Mannose and mannoproteins (mannan) are highly immunogenic [50], and, consequently, masking their exposure would be expected to be critical for pathogen evasion of the host immune system. It is well-established that C. neoformans evades phagocytosis by macrophages (anti-phagocytosis), the first line of host immune defense, and that this attribute is important for mammalian infection [5], [51]. In prior work, we demonstrated that C. neoformans evades phagocytosis by at least two pathways, one requiring capsule production and a second that is independent of capsule production and programmed by the transcriptional regulators Gat201 and Gat204 [5], [22]. Strikingly, mutations that abrogate capsule formation and mutations in the capsule-independent pathway do not result in detectable exposure of mannose or β-glucan on the cell surface, suggesting that these pathways do not act by masking these known PAMPs, even though their exposure would be anticipated to activate phagocytic receptors on macrophages.
Since we observed a dramatic increase in mannose exposure in the liv7Δ trs33Δ double mutant, we anticipated that it would display high levels of phagocytosis. To test this, we cultured wild-type, liv7Δ, trs33Δ, and liv7Δ trs33Δ C. neoformans cells with RAW 264.7 cells, a murine macrophage cell line. To test the potential impact of opsonization, C. neoformans strains were treated or not with fetal bovine serum prior to incubation (Figure 6A). Wild-type C. neoformans displays a low level of phagocytosis (4% macrophages with associated C. neoformans cells) that increased (∼17%) upon opsonization (p≤5×10⁻⁴). As anticipated from their mannose exposure, liv7Δ trs33Δ mutants and vps52Δ mutants show high levels (∼80%) of phagocytosis regardless of opsonization (p≤2×10⁻³). The lack of anti-phagocytosis activity by liv7Δ trs33Δ cells and vps52Δ cells is not solely due to lack of GXM, as GXM mutants cap10Δ and cap60Δ show increased association with macrophages (p≤3×10⁻³) but not to the same extent as liv7Δ trs33Δ cells, and are still sensitive to opsonization (p≤5×10⁻³).
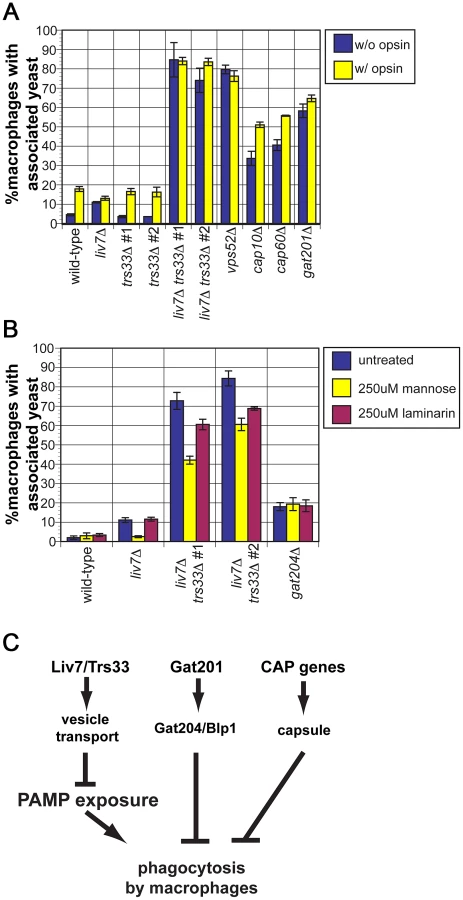
Surprisingly, even though there was no gross increase in mannose exposure in the liv7Δ single mutant, it displays a small (11%) but reproducible increase in phagocytosis without opsonization (p≤5×10⁻⁵) and no further increase with opsonization. In contrast, the trs33Δ mutant does not show this phenotype.
The single liv7Δ and trs33Δ mutants show distinct phagocytosis phenotypes yet the mannose exposure (as determined by conA staining) of both mutants is not distinguishable from wild-type. We hypothesized that liv7Δ cells might exhibit an increase in mannose or mannan on their surface not present in trs33Δ cells that is too subtle to detect by microscopy-based lectin staining assays. A functional prediction of this hypothesis is that the increase in phagocytosis of the liv7Δ mutant should be specifically blocked by an excess of free mannose. We performed phagocytosis assays using unopsonized C. neoformans cells and added either soluble mannose (to block recognition of mannose and mannans by macrophage mannose-recognition receptors) or laminarin (a control oligosaccharide that blocks recognition of beta-glucan) [52]. Strikingly mannose, but not laminarin, blocks the increased phagocytosis of liv7Δ mutants (p≤10−3) (Figure 6B). Mannose addition also partially rescues the anti-phagocytosis defect of liv7Δ trs33Δ cells (p≤10−3). Importantly, this treatment did not impact phagocytic index of gat204Δ cells (Figure 6B), a mutant we described previously that produces similar increase in phagocytosis, supporting the view that Liv7 and Gat204 function via distinct mechanisms [22].
Genetic support for the endosomal role for LIV6 predicted by its cross-species profile
The genetic interaction profile produced by the expression of LIV6 in S. cerevisiae shows positive and negative correlations with the corresponding profiles of the S. cerevisiae syn8Δ and ecm21Δ deletion mutants, respectively (Table 1 and Figure 7A). These genes act in endosome transport and/or fusion [28], [29], a process that mediates transport from either the plasma membrane or the late Golgi to the vacuole [53]. These correlations predict that Liv6 participates in endosomal functions in C. neoformans.

We first tested this prediction by assessing the impact of Liv6 on vacuole number. S. cerevisiae genes involved sorting to the vacuole include those that function in endosome biology and often impact vacuole number and morphology [54]–[56]. Vacuoles can be detected by staining with LysoTracker Green (Invitrogen), a dye that is taken up by the cell during endocytosis and fluoresces in acidified compartments, including endosomal vesicles, and typically strains the outer rims of vacuoles. Wild-type C. neoformans cells grown in yeast culture conditions and strained with LysoTracker show efficient uptake, many internal vesicles, and rim-stained vacuoles (Figure 7B). This pattern is remarkably similar to those reported for S. cerevisiae stained with LysoTracker or FM4-64 [56], [57], an older vital stain used to study protein sorting to the vacuole [57]. Strikingly, liv6Δ cells consistently exhibit a greater number of vacuoles than wild-type cells (p<0.005) (Figure 7C, 7D). Notably, the S. cerevisiae gene SYN8, whose deletion mutant's genetic interaction profile displays a positive correlation with the profile produced by LIV6 expression (Table 1), has been reported to function with another SNARE to promote normal vacuolar morphology [28]. The increase in vacuolar number seen in liv6Δ cells is highly specific, as knockout mutant in any of the bait genes did not exhibit a change in vacuole number (Figure 7D).
We next exploited the aminoglycoside antibiotic neomycin, which interferes with eukaryotic endosomal activity by binding phosphytidylinositol phosphates [58], [59] necessary for endosome function [60]. As a consequence, loss-of-function mutations in S. cerevisiae genes involved in endosome function [61], [62] are sensitive to neomycin [61]. Supporting a role for Liv6 in endosome function, we found that C. neoformans liv6Δ knockout mutants are sensitive to this drug (Figure 7E). Cells lacking LIV7 display a subtle reproducible neomycin resistance which could be due to altered cell permeability, a characteristic of neomycin-resistant S. cerevisiae strains [63], [64]. Knockout mutants in the other bait genes do not display a change in sensitivity to this compound. liv6Δ cells do not exhibit a growth defect on fluconazole, suggesting that their growth defect is specific to neomycin. Together, the changes in vacuole number and sensitivity to neomycin in produced by the liv6Δ mutation support the prediction from cross-species genetic profiles of a role for Liv6 in the endovacuolar system of C. neoformans.
Discussion
Genetic approaches to understanding mechanisms of virulence in human fungal pathogens can efficiently identify genes necessary for pathogens to cause disease. However, a key roadblock to progress is the lack of tools that can help define the function of a gene product when its predicted sequence offers few clues to its biochemical function, a common occurrence. We described here a case study of a cross-species genetic interaction profiling approach to develop testable hypotheses for the function of fungal virulence factors of unknown function. Notably, this proof-of-principle study shows that the approach can provide information on fungal pathogenicity factors that lack S. cerevisiae orthologs. Although many studies have used S. cerevisiae to investigate the function of foreign genes [9]–[11], [13], [14], the cross-species genetic interaction profile used here represents an application of quantitative genetic profiling of foreign proteins in S. cerevisiae coupled with comparison to recently described genetic map of S. cerevisiae [19] to the problem of annotation of fungal virulence factors. Because S. cerevisiae is a fungus, we anticipate that this approach may be particularly useful for fungal genes but that the method may also find utility in the study of bacterial and viral proteins that impact conserved intracellular processes in eukaryotic host cells.
Our approach involves expression in S. cerevisiae of cDNAs encoding Cryptococcus neoformans virulence factors identified in systematic genetic screens; the generation of genetic profiles by assessing the effect of C. neoformans gene expression in the context of each nonessential S. cerevisiae deletion mutants; and, correlation analysis with the existing database of genetic interactions to develop testable functional hypotheses. As mentioned above, one mechanism whereby expression of a C. neoformans gene could produce impact S. cerevisiae would be “dominant-negative” effect thereby inhibiting the activity of an S. cerevisiae pathway. Our results with LIV7 in both S. cerevisiae and C. neoformans are consistent with this scenario. The expression of LIV7 in S. cerevisiae produces a profile that correlates with that of the S. cerevisiae trs33Δ deletion mutant, but in C. neoformans, the liv7Δ mutation produces a synthetic phenotype with the trs33Δ mutation. Alternatively, expression of a C. neoformans gene product could act in a “dominant-active” fashion to increase the activity of a pathway which might result in a negative correlation with the profile of a gene deletion in the corresponding pathway. With Liv6, we observed both positive and negative correlations that led us to test a role in endosome function. Although we have focused on the extensive deletion mutant genetic interaction dataset [19], comparisons of the cross-species profiles generated here with genetic interaction profiles produced using chemicals [65], [66] and/or overexpressed genes [67], [68] will likely be equally useful as these approaches are applied on a larger scale. Thus, the analysis of correlations between cross-species genetic interaction profiles and existing “within-species” genetic interaction profiles offers a tool for generating testable predictions for pathways in which foreign genes operate.
The genetic profiling studies and validation experiments described in this paper provide new information on two C. neoformans pathogenicity factors identified previously, Liv7 and Liv6. These proteins lack orthologs in S. cerevisiae and lack orthologs of known function in other species. Our studies of Liv7 suggest it functions in Golgi transport in a process that suppresses the exposure of the PAMP mannose on the cell surface (Figure 6C). The increased phagocytosis phenotype of the liv7Δ single mutant and its specific suppression by soluble mannose appears specific to liv7Δ cells and is specific to mannose versus other carbohydrates (Figure 6B). The anti-phagocytic properties of C. neoformans are critical for mammalian infection [5], [22], [69] and the capsule is important for the anti-phagocytosis activity of opsonized C. neoformans cells [51]. Our previous work identified a capsule-independent pathway necessary for anti-phagocytosis under unopsonized conditions [22]. The suppression cell surface exposure of PAMP mannose appears to represent a third anti-phagocytosis pathway (Figure 6C) since mannose does not rescue the anti-phagocytic defect of gat204Δ cells (Figure 6B), which are defective in the capsule-independent anti-phagocytosis pathway [22]. This argument is supported by the observation that cap10Δ and cap60Δ cells, which lack GXM [48], [49], do not exhibit increased conA staining (Figure 5C). We suggest that Liv7 is important for mammalian infection [5] because it inhibits macrophage recognition of mannose-containing patterns on the C. neoformans cell surface (Figure 6C). Although our studies of Liv6 point to a role in endosome biology that impacts neomycin resistance and vacuole number, understanding how this function relates to its role in pathogen fitness in the host will require further investigation. One possibility is that Liv6 is involved in the endocytic uptake of limiting factors required for proliferation from the host milieu.
One anticipates that functional annotation of fungal virulence factors identified genetically will continue to be a major challenge for the future. The approach described here represents one generic tool that could be applied to this problem on a larger scale. We expect that a substantial number of virulence genes of unknown function in fungal pathogens will impinge on conserved cellular processes and that their genetic profiling in S. cerevisiae could therefore yield testable functional predictions in a significant number of cases. The cross-species interaction profiling could also be useful for studying genes from highly virulent pathogens that are difficult to work with due to the requirement for extensive containment.
Methods
Generation of S. cerevisiae strains
We inserted the GPD1 promoter region, our C. neoformans cDNA of interest, and a NAT resistance marker into the multicloning site of pRS316. For recombination into S. cerevisiae, we cut with a restriction enzyme that cleaved within the URA3 locus, the transformed the linearized vector into S. cerevisiae using standard lithium acetate-based transformation techniques. We verified expression of C. neoformans genes by extracting total RNA from log-phase S. cerevisiae cultures grown at 30°C in YNB, selecting for mRNA, and making cDNA as previously described [70]. Expression of C. neoformans genes was verified by qPCR performed as previously described [70].
Calculating C. neoformans gene expression level in S. cerevisiae strains
We expressed each C. neoformans gene under the GPD1 promoter and we measured RNA by qRT-PCR (Figure S4). We then measured the levels of BUD1 mRNA in the same RNA preparation. BUD1 is a small GTPase expressed at low levels [71]–[73] along with its two co-regulators BUD2 and BUD5 [74], [75]. We used published data on the molecules of BUD1 RNA per cell averaged with co-regulators BUD2 and BUD5 [71]–[73] to estimate the number of RNA molecules per cell for C. neoformans genes from the ratios in Figure S4, then calculated its rank position compared to other S. cerevisiae genes. BLP1 and LIV6 were in the lowest 10% of genes with detectable RNA (∼5090 of ∼6580 genes had detectable RNA [71]–[73]). LIV5 and LIV7 were in the 10–20th percentile, as were the BUD genes. MEP1 was the best expressed of the C. neoformans genes, (∼35th percentile). LIV13 was expressed based on the increase in LIV13 primer products with and without RT (data not shown) but not compared to BUD1.
Synthetic Genetic Analysis (SGA) screens
We performed SGA screens as described in Tong et al [16], [17] using a RoToR colony pinning robot (Singer Instruments). All screen plates were scanned on a flatbed scanner with autofocus. We extracted colony size data using the publicly available ScreenMill software [76]. We then adjusted the raw colony size data to control for plate position, edge effects, and slow growth of knockout mutants using the S-score method developed by Collins et al [20]. The final S-scores, one for each double mutant strain, indicate the strength of the genetic interaction (absolute value) and whether the interaction is synthetically sick (negative numbers) or buffered (positive numbers) [20]. We then adjusted S-scores so that they were on a scale between −1.0 and 1.0 and calculated the Pearson correlation between S-scores and ε-scores from Constanzo et al [19]. We calculated p-values of the Pearson correlations by calculating the Z-score of the Pearson correlation for each interaction, then using the Z-score to determine the p-value of each interaction.
C. neoformans genetic manipulations and growth conditions
C. neoformans was routinely grown in yeast culture conditions in either YPAD (1% yeast extract, 2% peptone, 2% glucose, 0.015% L-tryptophan, 0.004% adenine) or yeast nitrogen base (YNB) (Difco). Strain construction and genetic manipulation was previously described [5]. Whenever more than one knockout mutant for a single gene is shown, mutants were made by independent transformations. Growth curves (Figure 3A) were performed in YNB at 30°C by taking measurements of OD600 every two hours for 10 hrs. The growth curve was repeated three times and representative data are shown. When C. neoformans cells were grown in tissue culture conditions, they were first grown overnight to saturation in YNB, then washed once in 1× PBS and resuspended at a density of 1 OD600/ml (∼1.7×10⁷ cells/ml) in DMEM, then incubated for the specified amount of time in 5% CO2 at 37°C.
Treatment with Brefeldin A (BFA)
Samples were grown in overnight in YNB at 30°C, then subcultured to OD600 = 0.2. BFA or DMSO (-BFA control) was added to each culture and the OD600 taken every hour for 10 hr. Doubling time was calculated over the interval from 4–8 hr. The treatment curve was repeated three times and the data shown are averages of the three experiments.
Imaging of Liv7-mCherry and staining with fluorescent Brefeldin A (fBFA)
Samples were grown overnight in YNB at 30°C, then washed 3× in 1× PBS and resuspended at 1 OD/ml in DMEM, then incubated 16 hr under tissue culture conditions (5% CO2, 37°C). Samples were then either imaged (unstained samples) or fBFA (Life Technologies) was added to the medium to a final concentration of 0.5 µg/ml. fBFA samples were incubated 40 min, washed 1× in PBS, then imaged immediately.
LysoTracker staining
C. neoformans cells were grown overnight under yeast culture conditions (yeast nitrogen base (YNB), 30°C with rotation), then subcultured to OD600 of ∼0.2 and grown to midlog phase. LysoTracker Green was added to a final concentration of 500 nM and incubated for five minutes with shaking at 30°C. Cells were then harvested and immediately imaged.
MitoTracker staining
Strains were grown under tissue culture conditions for 12 hr. MitoTracker Green (Invitrogen) was added to a final concentration of 1 µM (from 1 mM stock in DMSO), incubated 30 min at 37°C, then imaged.
Lectin and antibody staining of cell surface residues
Samples were grown overnight in YNB at 30°C, then washed three times in 1× PBS and resuspended at 1 OD/ml in DMEM, then incubated 16 hr under tissue culture conditions (5% CO2, 37°C). Samples were then fixed for 15 min in 4% paraformaldehyde, washed three times in 1× PBS, and then used for staining. To stain with concanavalin A (conA) staining for mannose residues, cells were incubated 5 min in 50 µg/ml Alexa Fluor 594 (Invitrogen), washed once in 1× PBS, then imaged. Samples for staining for chitin and GXM were incubated with αGXM antibody mAb 339 (1∶1000) as previously described [5] and fluorescein-conjugated chitin binding domain (New England Biolabs) (1∶500) for 4 hr, then washed twice in 1× PBS and incubated with TRITC-conjugated donkey anti-mouse secondary antibody (Jackson ImmunoResearch) and fluorescein-conjugated chitin binding domain (1∶500) for 1 hr. Samples were then washed once and imaged using an Axiovert 200 M (Zeiss) microscope running Axiovision software. β-glucan staining was performed using the same procedure as GXM staining but with anti-β-glucan antibody (1∶1000) (Biosupplies Australia).
Phagocytosis assays
Phagocytosis assays were performed as previously described [5], [22]. RAW264.7 macrophages (2×10⁴ cells/well) were seeded into 96-well tissue-culture treated plates in DMEM medium and allowed to adhere overnight. C. neoformans cells grown in YPAD medium were washed three times with PBS, then resuspended to a density of 107 cells/ml in PBS. 200 µl fresh DMEM was added to RAW264.7 cells. 5 µl C. neoformans culture (5×10⁴ cells) were then added to each well for a multiplicity of infection of two yeast to one macrophage. Following 24 hr co-incubation, the macrophages were washed three times with PBS to remove unphagocytosed yeast and then fixed with 1% formaldehyde/PBS prior to visualization on an inverted light microscope. Percentage of yeast cell-associated macrophages was determined by counting the number of macrophages with yeast internalized or associated with their cell surface, divided by the number of macrophages counted. At least 200 macrophages were assayed per well, and each strain was tested in triplicate. If performing phagocytosis experiments under opsonizing conditions, C. neoformans cells were grown overnight in YNB, washed three times in 1× PBS, resuspended to a density of 107 cells/ml in either fetal bovine serum (opsonized samples; FBS) or 1× PBS (unopsonized samples), incubated for 30 min at 30°C on a shaking platform, washed once in 1× PBS, then resuspended at 107 cells/ml in 1× PBS and used to infect macrophages as above.
Supporting Information
Zdroje
1. ParkBJ, WannemuehlerKA, MarstonBJ, GovenderN, PappasPG, et al. (2009) Estimation of the current global burden of cryptococcal meningitis among persons living with HIV/AIDS. AIDS 23 : 525–530.
2. RichardsonMD (2005) Changing patterns and trends in systemic fungal infections. J Antimicrob Chemother 56: i5–i11.
3. GallagherLA, RamageE, JacobsMA, KaulR, BrittnacherM, et al. (2007) A comprehensive transposon mutant library of Francisella novicida, a bioweapon surrogate. Proc Natl Acad Sci U S A 104 : 1009–1014.
4. LiberatiNT, UrbachJM, MiyataS, LeeDG, DrenkardE, et al. (2006) An ordered, nonredundant library of Pseudomonas aeruginosa strain PA14 transposon insertion mutants. Proc Natl Acad Sci U S A 103 : 2833–2838.
5. LiuOW, ChunCD, ChowED, ChenC, MadhaniHD, et al. (2008) Systematic Genetic Analysis of Virulence in the Human Fungal Pathogen Cryptococcus neoformans. Cell 135 : 174–188.
6. MurrayGL, MorelV, CerqueiraGM, CrodaJ, SrikramA, et al. (2009) Genome-Wide Transposon Mutagenesis in Pathogenic Leptospira Species. Infect Immun 77 : 810–816.
7. NobleSM, FrenchS, KohnLA, ChenV, JohnsonAD (2010) Systematic screens of a Candida albicans homozygous deletion library decouple morphogenetic switching and pathogenicity. Nat Genet 42 : 590–598.
8. GiaeverG, ChuAM, NiL, ConnellyC, RilesL, et al. (2002) Functional profiling of the Saccharomyces cerevisiae genome. Nature 418 : 387–391.
9. CooperAA, GitlerAD, CashikarA, HaynesCM, HillKJ, et al. (2006) Alpha-Synuclein Blocks ER-Golgi Traffic and Rab1 Rescues Neuron Loss in Parkinson's Models. Science 313 : 324–328.
10. KramerRW, SlagowskiNL, EzeNA, GiddingsKS, MorrisonMF, et al. (2007) Yeast Functional Genomic Screens Lead to Identification of a Role for a Bacterial Effector in Innate Immunity Regulation. PLoS Pathog 3: e21 doi:10.1371/journal.ppat.0030021.
11. LeeMG, NurseP (1987) Complementation used to clone a human homologue of the fission yeast cell cycle control gene cdc2. Nature 327 : 31–35.
12. SiskoJL, SpaethK, KumarY, ValdiviaRH (2006) Multifunctional analysis of Chlamydia-specific genes in a yeast expression system. Mol Microbiol 60 : 51–66.
13. SlagowskiNL, KramerRW, MorrisonMF, LaBaerJ, LesserCF (2008) A Functional Genomic Yeast Screen to Identify Pathogenic Bacterial Proteins. PLoS Pathog 4: e9 doi:10.1371/journal.ppat.0040009.
14. TreuschS, HamamichiS, GoodmanJL, MatlackKES, ChungCY, et al. (2011) Functional Links Between AB Toxicity, Endocytic Trafficking, and Alzheimer's Disease Risk Factors in Yeast. Science 334 : 1241–1245.
15. TurgeonZ, WhiteD, JørgensenR, VisschedykD, FieldhouseRJ, et al. (2009) Yeast as a tool for characterizing mono-ADP-ribosyltransferase toxins. FEMS Microbiol Lett 300 : 97–106.
16. TongA, BooneC (2006) Synthetic genetic array analysis in Saccharomyces cerevisiae. Methods Mol Biol 313 : 171–192.
17. TongA, LesageG, BaderG, DingH, XuH, et al. (2004) Global mapping of the yeast genetic interaction network. Science 303 : 808–813.
18. CollinsSR, MillerKM, MaasNL, RoguevA, FillinghamJ, et al. (2007) Functional dissection of protein complexes involved in yeast chromosome biology using a genetic interaction map. Nature 446 : 806–810.
19. CostanzoM, BaryshnikovaA, BellayJ, KimY, SpearED, et al. (2010) The Genetic Landscape of a Cell. Science 327 : 425–431.
20. CollinsS, SchuldinerM, KroganN, WeissmanJ (2006) A strategy for extracting and analyzing large-scale quantitative epistatic interaction data. Genome Biol 7: R63.
21. GrefenC, LalondeS, ObrdlikP (2007) Split-Ubiquitin System for Identifying Protein-Protein Interactions in Membranes and Full-Length Proteins. Current Protocols in Neuroscience 5.27.
22. ChunCD, BrownJCS, MadhaniHD (2011) A Major Role for Capsule-Independent Phagocytosis-Inhibitory Mechanisms in Mammalian Infection by Cryptococcus neoformans. Cell Host Microbe 9 : 243–251.
23. AltschulSF, MaddenTL, SchaefferAA, ZhangJ, ZhangZ, et al. (1997) Gapped BLAST and PSI-BLAST: a new generation of protein database search programs. Nucleic Acids Res 25 : 3389–3402.
24. Bennett-LovseyRM, HerbertAD, SternbergMJE, KelleyLA (2008) Exploring the extremes of sequence/structure space with ensemble fold recognition in the program Phyre. Proteins 70 : 611–625.
25. LoftusBJ, FungE, RoncagliaP, RowleyD, AmedeoP, et al. (2005) The genome of the basidiomycetous yeast and human pathogen Cryptococcus neoformans. Science 307 : 1321–1324.
26. GoffeauA, BarrellBG, BusseyH, DavisRW, DujonB, et al. (1996) Life with 6000 genes. Science 274 : 563–567.
27. HershbergR, PetrovDA (2009) General Rules for Optimal Codon Choice. PLoS Genet 5: e1000556 doi:10.1371/journal.pcbi.1000556.
28. LewisMJ, PelhamHR (2002) A new yeast endosomal SNARE related to mammalian syntaxin 8. Traffic 3 : 922–929.
29. NikkoE, SullivanJA, PelhamHRB (2008) Arrestin-like proteins mediate ubiquitination and endocytosis of the yeast metal transporter Smf1. EMBO Rep 9 : 1216–1221.
30. DavisL, BarberaM, McDonnellA, McIntyreK, SternglanzR, et al. (2001) The Saccharomyces cerevisiae MUM2 Gene Interacts With the DNA Replication Machinery and Is Required for Meiotic Levels of Double Strand Breaks. Genetics 157 : 1179–1189.
31. EngebrechtJ, MasseS, DavisL, RoseK, KesselT (1998) Yeast Meiotic Mutants Proficient for the Induction of Ectopic Recombination. Genetics 148 : 581–598.
32. EnomotoS, BermanJ (1998) Chromatin assembly factor I contributes to the maintenance, but not the re-establishment, of silencing at the yeast silent mating loci. Genes Dev 12 : 219–232.
33. AshrafiK, FaraziTA, GordonJI (1998) A Role for Saccharomyces cerevisiae Fatty Acid Activation Protein 4 in Regulating ProteinN-Myristoylation during Entry into Stationary Phase. J Biol Chem 273 : 25864–25874.
34. MartinezMJ, RoyS, ArchulettaAB, WentzellPD, Anna-ArriolaSS, et al. (2004) Genomic Analysis of Stationary-Phase and Exit in Saccharomyces cerevisiae: Gene Expression and Identification of Novel Essential Genes. Mol Biol Cell 15 : 5295–5305.
35. MukaiH, KunoT, TanakaH, HirataD, MiyakawaT, et al. (1993) Isolation and characterization of SSE1 and SSE2, new members of the yeast HSP70 multigene family. Gene 132 : 57–66.
36. LetunicI, DoerksT, BorkP (2009) SMART 6: recent updates and new developments. Nucleic Acids Res 37: D229–232.
37. SacherM, KimY-G, LavieA, OhB-H, SegevN (2008) The TRAPP Complex: Insights into its Architecture and Function. Traffic 9 : 2032–2042.
38. OkaT, KriegerM (2005) Multi-Component Protein Complexes and Golgi Membrane Trafficking. J Biochem 137 : 109–114.
39. HolthuisJCM, NicholsBJ, DhruvakumarS, PelhamHRB (1998) Two syntaxin homologues in the TGN/endosomal system of yeast. EMBO J 17 : 113–126.
40. DonaldsonJG, FinazziD, KlausnerRD (1992) Brefeldin A inhibits Golgi membrane-catalysed exchange of guanine nucleotide onto ARF protein. Nature 360 : 350–352.
41. HelmsJB, RothmanJE (1992) Inhibition by brefeldin A of a Golgi membrane enzyme that catalyses exchange of guanine nucleotide bound to ARF. Nature 360 : 352–354.
42. SciakyN, PresleyJ, SmithC, ZaalKJM, ColeN, et al. (1997) Golgi Tubule Traffic and the Effects of Brefeldin A Visualized in Living Cells. J Cell Biol 139 : 1137–1155.
43. MadhaniHD, FinkGR (1998) The control of filamentous differentiation and virulence in fungi. Trends Cell Biol 8 : 348–353.
44. DengY, BenninkJR, KangHC, HauglandRP, YewdellJW (1995) Fluorescent conjugates of brefeldin A selectively stain the endoplasmic reticulum and Golgi complex of living cells. J Histochem Cytochem 43 : 907–915.
45. SemenzaJC, HardwickKG, DeanN, PelhamHRB (1990) ERD2, a yeast gene required for the receptor-mediated retrieval of luminal ER proteins from the secretory pathway. Cell 61 : 1349–1357.
46. KumarH, KawaiT, AkiraS (2011) Pathogen Recognition by the Innate Immune System. Int Rev Immunol 30 : 16–34.
47. WheelerRT, FinkGR (2006) A Drug-Sensitive Genetic Network Masks Fungi from the Immune System. PLoS Pathog 2: e35 doi:10.1371/journal.ppat.0020035.
48. ChangYC, Kwon-ChungKJ (1999) Isolation, characterization, and localization of a capsule-associated gene, CAP10, of Cryptococcus neoformans. J Bacteriol 181 : 5636–5643.
49. ChangYC, Kwon-ChungKJ (1998) Isolation of the Third Capsule-Associated Gene,CAP60, Required for Virulence in Cryptococcus neoformans. Infect Immun 66 : 2230–2236.
50. WillmentJA, BrownGD (2008) C-type lectin receptors in antifungal immunity. Trends Microbiol 16 : 27–32.
51. LevitzSM, DiBenedettoDJ (1989) Paradoxical role of capsule in murine bronchoalveolar macrophage-mediated killing of Cryptococcus neoformans. J Immunol 142 : 659–665.
52. CrossCE, BancroftGJ (1995) Ingestion of acapsular Cryptococcus neoformans occurs via mannose and beta-glucan receptors, resulting in cytokine production and increased phagocytosis of the encapsulated form. Infection and Immunity 63 : 2604–2611.
53. PelhamHRB (2002) Insights from yeast endosomes. Curr Opin Cell Biol 14 : 454–462.
54. BowersK, StevensTH (2005) Protein transport from the late Golgi to the vacuole in the yeast Saccharomyces cerevisiae. Biochim Biophys Acta 1744 : 438–454.
55. OstrowiczCW, MeiringerCTA, UngermannC (2008) Yeast vacuole fusion. Autophagy 4 : 5–19.
56. RaymondCK, Howald-StevensonI, VaterCA, StevensTH (1992) Morphological classification of the yeast vacuolar protein sorting mutants: evidence for a prevacuolar compartment in Class E vps mutants. Mol Biol Cell 3 : 1389–1402.
57. VidaTA, EmrSD (1995) A new vital stain for visualizing vacuolar membrane dynamics and endocytosis in yeast. J Cell Biol 128 : 779–792.
58. SchachtJ (1978) Purification of polyphosphoinositides by chromatography on immobilized neomycin. J Lipid Res 19 : 1063–1067.
59. LodhiS, WeinerND, SchachtJ (1979) Interactions of neomycin with monomolecular films of polyphosphoinositides. Biochim Biophys Acta 557 : 1–8.
60. MayerA, ScheglmannD, DoveS, GlatzA, WicknerW, et al. (2000) Phosphatidylinositol 4,5-bisphosphate regulates two steps of homotypic vacuole fusion. Mol Biol Cell 11 : 807–817.
61. HuaZ, GrahamTR (2003) Requirement for Neo1p in retrograde transport from the Golgi complex to the endoplasmic reticulum. Mol Biol Cell 14 : 4971–4983.
62. WickyS, SchwarzH, Singer-KruegerB (2004) Molecular Interactions of Yeast Neo1p, an Essential Member of the Drs2 Family of Aminophospholipid Translocases, and Its Role in Membrane Trafficking within the Endomembrane System. Mol Cell Biol 24 : 7402–7418.
63. CastroIM, CabralDB, TrópiaMJM, AlmeidaFM, BrandãoRL (2001) Yeast genes YOL002C and SUL1 are involved in neomycin resistance. World J Microbiol Biotechnol 17 : 399–402.
64. PrezantTR, ChaltrawWEj, Fischel-GhodsianN (1996) Identification of an overexpressed yeast gene which prevents aminoglycoside toxicity. Microbiology 142 : 3407–3414.
65. HillenmeyerME, FungE, WildenhainJ, PierceSE, HoonS, et al. (2008) The Chemical Genomic Portrait of Yeast: Uncovering a Phenotype for All Genes. Science 320 : 362–365.
66. ParsonsAB, BrostRL, DingH, LiZ, ZhangC, et al. (2004) Integration of chemical-genetic and genetic interaction data links bioactive compounds to cellular target pathways. Nature Biotechnology 22 : 62–69.
67. SharifpoorS, van DykD, CostanzoM, BaryshnikovaA, FriesenH, et al. (2012) Functional wiring of the yeast kinome revealed by global analysis of genetic network motifs. Genome Res 22 : 791–801.
68. SopkoR, PappB, OliverSG, AndrewsBJ (2006) Phenotypic activation to discover biological pathways and kinase substrates. Cell Cycle 15 : 1397–1402.
69. Del PoetaM (2004) Role of phagocytosis in the virulence of Cryptococcus neoformans. Eukaryot Cell 3 : 1067–1075.
70. MeneghiniMD, WuM, MadhaniHD (2003) Conserved Histone Variant H2A.Z Protects Euchromatin from the Ectopic Spread of Silent Heterochromatin. Cell 112 : 725–736.
71. NagalakshmiU, WangZ, WaernK, ShouC, RahaD, et al. (2008) The Transcriptional Landscape of the Yeast Genome Defined by RNA Sequencing. Science 320 : 1344–1349.
72. PelechanoV, ChávezS, Pérez-OrtínJE (2010) A Complete Set of Nascent Transcription Rates for Yeast Genes. PLoS ONE 5: e15442 doi:10.1371/journal.pone.0015442.
73. SteinmetzEJ, WarrenCL, KuehnerJN, PanbehiB, AnsariAZ, et al. (2006) Genome-Wide Distribution of Yeast RNA Polymerase II and Its Control by Sen1 Helicase. Mol Cell 24 : 735–746.
74. BenderA (1993) Genetic evidence for the roles of the bud-site-selection genes BUD5 and BUD2 in control of the Rsr1p (Bud1p) GTPase in yeast. Proc Natl Acad Sci U S A 90 : 9926–9929.
75. ChantJ, HerskowitzI (1991) Genetic control of bud site selection in yeast by a set of gene products that constitute a morphogenetic pathway. Cell 65 : 1203–1212.
76. DittmarJ, ReidR, RothsteinR (2010) ScreenMill: A freely available software suite for growth measurement, analysis and visualization of high-throughput screen data. BMC Bioinformatics 11 : 353–363.
77. AlbertynJ, HohmannS, TheveleinJM, PriorBA (1994) GPD1, which encodes glycerol-3-phosphate dehydrogenase, is essential for growth under osmotic stress in Saccharomyces cerevisiae, and its expression is regulated by the high-osmolarity glycerol response pathway. Mol Cell Biol 14 : 4135–4144.
78. CherryJM, HongEL, AmundsenC, BalakrishnanR, BinkleyG, et al. (2012) Saccharomyces Genome Database: the genomics resource of budding yeast. Nucleic Acids Res 40: D700–D705.
79. HuhW-K, FalvoJV, GerkeLC, CarrollAS, HowsonRW, et al. (2003) Global analysis of protein localization in budding yeast. Nature 425 : 686–691.
Štítky
Genetika Reprodukční medicínaČlánek vyšel v časopise
PLOS Genetics
2012 Číslo 12
- Kazuistika – Perspektivy využití precizované medicíny v rámci personalizované specifické terapie onkologických pacientů
- Nobelova cena za chemii pro genetické nůžky: Objev, který změní naši budoucnost?
- Technologie na bázi RNA v klinické praxi: od přebarvených petúnií k terapii vzácných a dosud jen obtížně léčitelných chorob u lidí
- „Nepředstavovali jsme si, že náš výzkum povede přímo ke vzniku nových léků, dokonce ještě za našeho života“
- Bezplatné služby pro diagnostiku ATTRv amyloidózy pro kardiology
Nejčtenější v tomto čísle
- Population Genomics of Sub-Saharan : African Diversity and Non-African Admixture
- Dnmt3a Protects Active Chromosome Domains against Cancer-Associated Hypomethylation
- Excessive Astrocyte-Derived Neurotrophin-3 Contributes to the Abnormal Neuronal Dendritic Development in a Mouse Model of Fragile X Syndrome
- Pre-Disposition and Epigenetics Govern Variation in Bacterial Survival upon Stress
Zvyšte si kvalifikaci online z pohodlí domova
Mazová zátka a její řešení
nový kurzVšechny kurzy