
Eight Common Genetic Variants Associated with Serum DHEAS Levels Suggest a Key Role in Ageing Mechanisms
Dehydroepiandrosterone sulphate (DHEAS) is the most abundant circulating steroid secreted by adrenal glands—yet its function is unknown. Its serum concentration declines significantly with increasing age, which has led to speculation that a relative DHEAS deficiency may contribute to the development of common age-related diseases or diminished longevity. We conducted a meta-analysis of genome-wide association data with 14,846 individuals and identified eight independent common SNPs associated with serum DHEAS concentrations. Genes at or near the identified loci include ZKSCAN5 (rs11761528; p = 3.15×10−36), SULT2A1 (rs2637125; p = 2.61×10⁻¹⁹), ARPC1A (rs740160; p = 1.56×10⁻¹⁶), TRIM4 (rs17277546; p = 4.50×10⁻¹¹), BMF (rs7181230; p = 5.44×10⁻¹¹), HHEX (rs2497306; p = 4.64×10⁻⁹), BCL2L11 (rs6738028; p = 1.72×10⁻⁸), and CYP2C9 (rs2185570; p = 2.29×10⁻⁸). These genes are associated with type 2 diabetes, lymphoma, actin filament assembly, drug and xenobiotic metabolism, and zinc finger proteins. Several SNPs were associated with changes in gene expression levels, and the related genes are connected to biological pathways linking DHEAS with ageing. This study provides much needed insight into the function of DHEAS.
Published in the journal:
. PLoS Genet 7(4): e32767. doi:10.1371/journal.pgen.1002025
Category:
Research Article
doi:
https://doi.org/10.1371/journal.pgen.1002025
Summary
Dehydroepiandrosterone sulphate (DHEAS) is the most abundant circulating steroid secreted by adrenal glands—yet its function is unknown. Its serum concentration declines significantly with increasing age, which has led to speculation that a relative DHEAS deficiency may contribute to the development of common age-related diseases or diminished longevity. We conducted a meta-analysis of genome-wide association data with 14,846 individuals and identified eight independent common SNPs associated with serum DHEAS concentrations. Genes at or near the identified loci include ZKSCAN5 (rs11761528; p = 3.15×10−36), SULT2A1 (rs2637125; p = 2.61×10⁻¹⁹), ARPC1A (rs740160; p = 1.56×10⁻¹⁶), TRIM4 (rs17277546; p = 4.50×10⁻¹¹), BMF (rs7181230; p = 5.44×10⁻¹¹), HHEX (rs2497306; p = 4.64×10⁻⁹), BCL2L11 (rs6738028; p = 1.72×10⁻⁸), and CYP2C9 (rs2185570; p = 2.29×10⁻⁸). These genes are associated with type 2 diabetes, lymphoma, actin filament assembly, drug and xenobiotic metabolism, and zinc finger proteins. Several SNPs were associated with changes in gene expression levels, and the related genes are connected to biological pathways linking DHEAS with ageing. This study provides much needed insight into the function of DHEAS.
Introduction
Dehydroepiandrosterone sulphate (DHEAS), mainly secreted by the adrenal gland, is the most abundant circulating steroid in humans. It acts as an inactive precursor which is converted initially into DHEA and thereafter into active androgens and estrogens in peripheral target tissues [1]. In humans the serum concentration of circulating DHEAS is 100 - to 500-fold or 1000 to 10,000 higher than that of testosterone and estradiol respectively. Unlike DHEA, which is swiftly cleared from the circulation and shows diurnal variation, serum DHEAS concentrations are stable and facilitate accurate measurement and diagnosis of pathology [2].
DHEAS is distinct from the other major adrenal steroids (cortisol and aldosterone) in showing a significant physiological decline after the age of 25 and diminishes about 95% by the age of 85 years [3]. This age-related decline has led to speculation that a relative DHEAS deficiency may contribute to the development of common age-related diseases or diminished longevity [4], [5]. Low DHEAS concentrations are possibly associated with increased insulin resistance [6], [7] and hypertension [8], but not with incident metabolic syndrome [9]. It is strongly associated with osteoporosis in women [10], [11] but not in men [12]. Concurrent change in DHEAS tracks with declines in gait speed, modified mini-mental state examination score (3MSE), and digit symbol substitution test (DSST) in very old women but not in men [13]. Low circulating DHEAS is also strongly associated with cardiovascular disease and mortality in men [14]–[18] but not in women [19]. A recent 15-year follow-up study showed that DHEAS was negatively related to all-cause, all cancers, and other medical mortality, whereas high DHEAS concentrations were protective [20]. This has led to its widespread and uncontrolled use as a controversial anti-ageing and sexual performance supplement in the USA and other western countries without any clear data about efficacy, potential risks or benefits [21].
Despite these observations, the physiological function of DHEAS and its importance in maintaining health are poorly understood. Although previous twin [22], [23] and family-based studies [24], [25] have shown that there is a substantial genetic effect with a heritability estimate of 60% [22], no specific genes regulating serum DHEAS concentration in healthy individuals have been identified to date. Therefore, the current study meta-analyzed the results of genome-wide association studies (GWAS) performed in a total of 14,846 individuals from seven cohorts to identify common genetic variants associated with serum DHEAS concentrations. The findings not only advance understanding of how serum DHEAS concentration is regulated by genes but also provide clues as to its mechanism of action as well as Mendelian randomisation principles [26].
Results
We carried out a meta-analysis of 8,565 women and 6,281 men of European origin from collaborating studies: TwinsUK (n = 4,906), Framingham Heart Study (FHS) (n = 3,183), SHIP (n = 1,832), Rotterdam Study (RS1) (n = 1,597), InCHIANTI (n = 1,182), Health ABC (n = 1,222), and GOOD (n = 924). Serum samples were collected either after overnight fasting or non-fasting in each cohort and DHEAS was measured by either immunoassay or liquid chromatography tandem mass spectrometry (LC-MS/MS) methods (Table 1). Mean age differed across the cohorts from 19 to 74 years in men and 50 to 74 years in women and corresponding mean DHEAS concentrations varied from 1.20 to 7.05 µmol/L (Table 1).

Each cohort performed GWA tests for log transformed DHEAS on ∼2.5 million imputed single nucleotide polymorphisms (SNPs) in men and women separately with adjustment for age, and additionally for age and sex for those cohorts who had data in both men and women. Then Z-scores from each cohort were pooled for the meta-analysis at each SNP.
In all our individual GWAS, λGC, which is defined as the median χ2 (1 degree of freedom) association statistic across SNPs divided by its theoretical median under the null distribution [27], ranged from 0.984 to 1.023, indicating that there was no population stratification or it was very minor. Further, we corrected for population stratification by applying the genomic control method [27]; the λGC in the meta-analysis is 1.017. In addition, the effect direction was consistent across all the cohorts and there is no between-study heterogeneity as indicated by I2 ranging between 0 and 0.12 (Table 2).
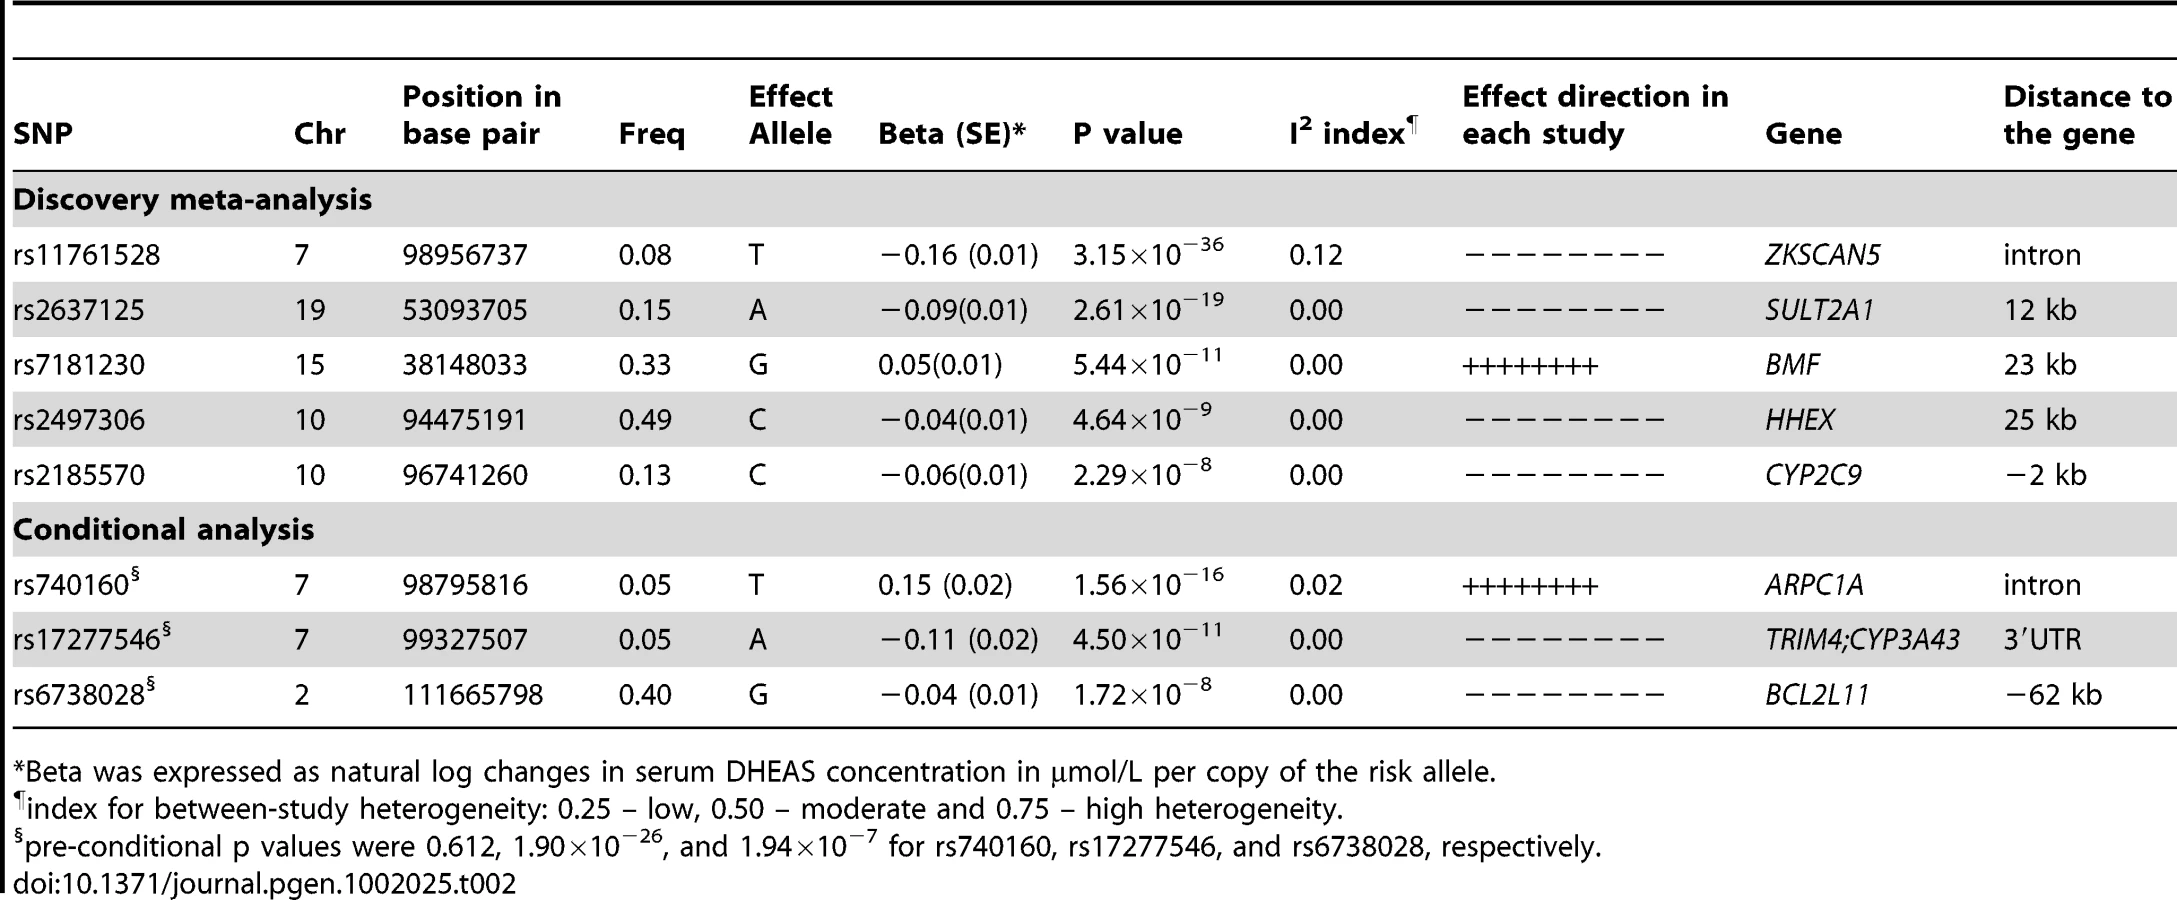
We found 44 SNPs were associated with serum DHEAS concentrations in men at conventional genome-wide significance (p<5×10⁻⁸), which are all located on chromosome 7q22.1 (Figure 1B; Table S1). All these SNPs except for three were significant in women (Figure 1A; Table S1). In addition, 19 SNPs located on chromosome 19q13.3 were found in women to be associated with serum DHEAS concentrations with p<5×10⁻⁸. In the sex-combined meta-analysis, the significance became stronger for all these SNPs (Figure 1C; Table S1). Further, we found 8 SNPs located on chromosome 10q23.33 which represents two regions more than 2 MB apart, 12 SNPs on chromosome 15q15.1, and in addition, 4 SNPs on chromosome 19q13.3 were associated with serum DHEAS concentrations with p<5×10⁻⁸. Together we found a total of 87 SNPs associated with serum DHEAS concentrations with p<5×10⁻⁸, representing five chromosomal regions of less than 1 Mb each (Table S1).
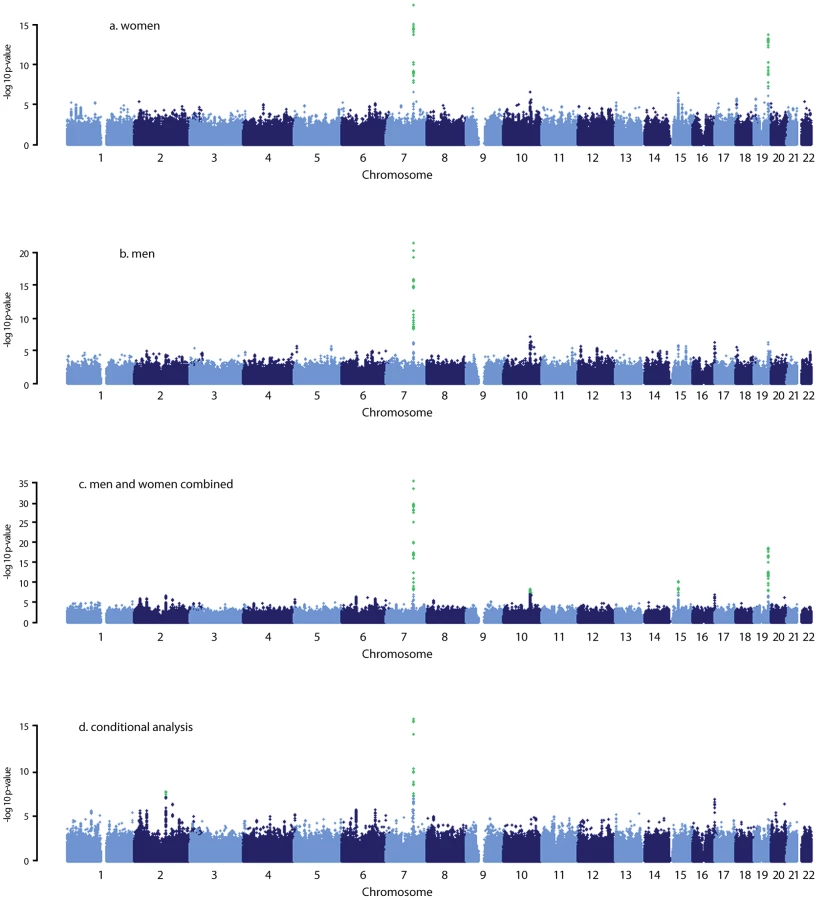
The most significantly associated SNPs in each of these five regions are presented in Table 2. The minor allele of rs11761528 (p = 3.15×10−36) on chromosome 7q22.1, rs2637125 (p = 2.61×10⁻¹⁹) on chromosome 19q13.3, and rs2497306 (p = 4.6×10⁻⁹) and rs2185570 (p = 2.29×10⁻⁸) on chromosome 10q22.33 (more than 2 Mb apart), were negatively associated with DHEAS concentrations. In comparison, the minor allele of rs7181230 (p = 5.44×10⁻¹¹) on chromosome 15q15.1 was positively associated with serum DHEAS concentrations. Based on the HapMap3 release2 CEU data, the significant 87 SNPs from within the five regions have low pair-wise r2, indicating potentially multiple independent signals. To verify this, we performed a conditional meta-analysis with adjustment for the five most significant SNPs plus age and sex in each cohort.
After this adjustment, all other SNPs on chromosome 10, 15, and 19 became non-significant (Figure 1D). However, on chromosome 7, we found two independent signals; one defined by rs11761528 and a second located 370 kb upstream in the 3′ UTR of the TRIM4 and CYP3A43 genes (rs17277546, p = 4.50×10⁻¹¹). Furthermore, we identified two additional significant loci associated with DHEAS, one on chromosome 2q13 (rs6738028, p = 1.72×10⁻⁸), and another on chromosome 7 within the ARPC1A gene (rs740160 located 161 kb downstream of rs11761528, p = 1.56×10⁻¹⁶) (Table 2; Figure 1D). In total, we found eight independent SNPs associated with serum DHEAS concentrations at conventional genome-wide significant level (p<5×10⁻⁸) (Table 2). The effect was consistently in the same direction across all cohorts (Table 2). No heterogeneity among cohorts was observed (Table 2). These SNPs together explained ∼4% of the total and ∼7% of genetic variance of serum DHEAS concentrations (based on TwinsUK data). To further look at whether the magnitude of these genetic association varies with age, we carried out an interaction analysis between age and each of these 8 SNPs on serum DHEAS concentrations by including an interaction term of age×SNP in the linear regression model in each cohort and then meta-analyzed the results. We found that there was no significant interaction between age and each of these SNPs (all p values≥0.05).
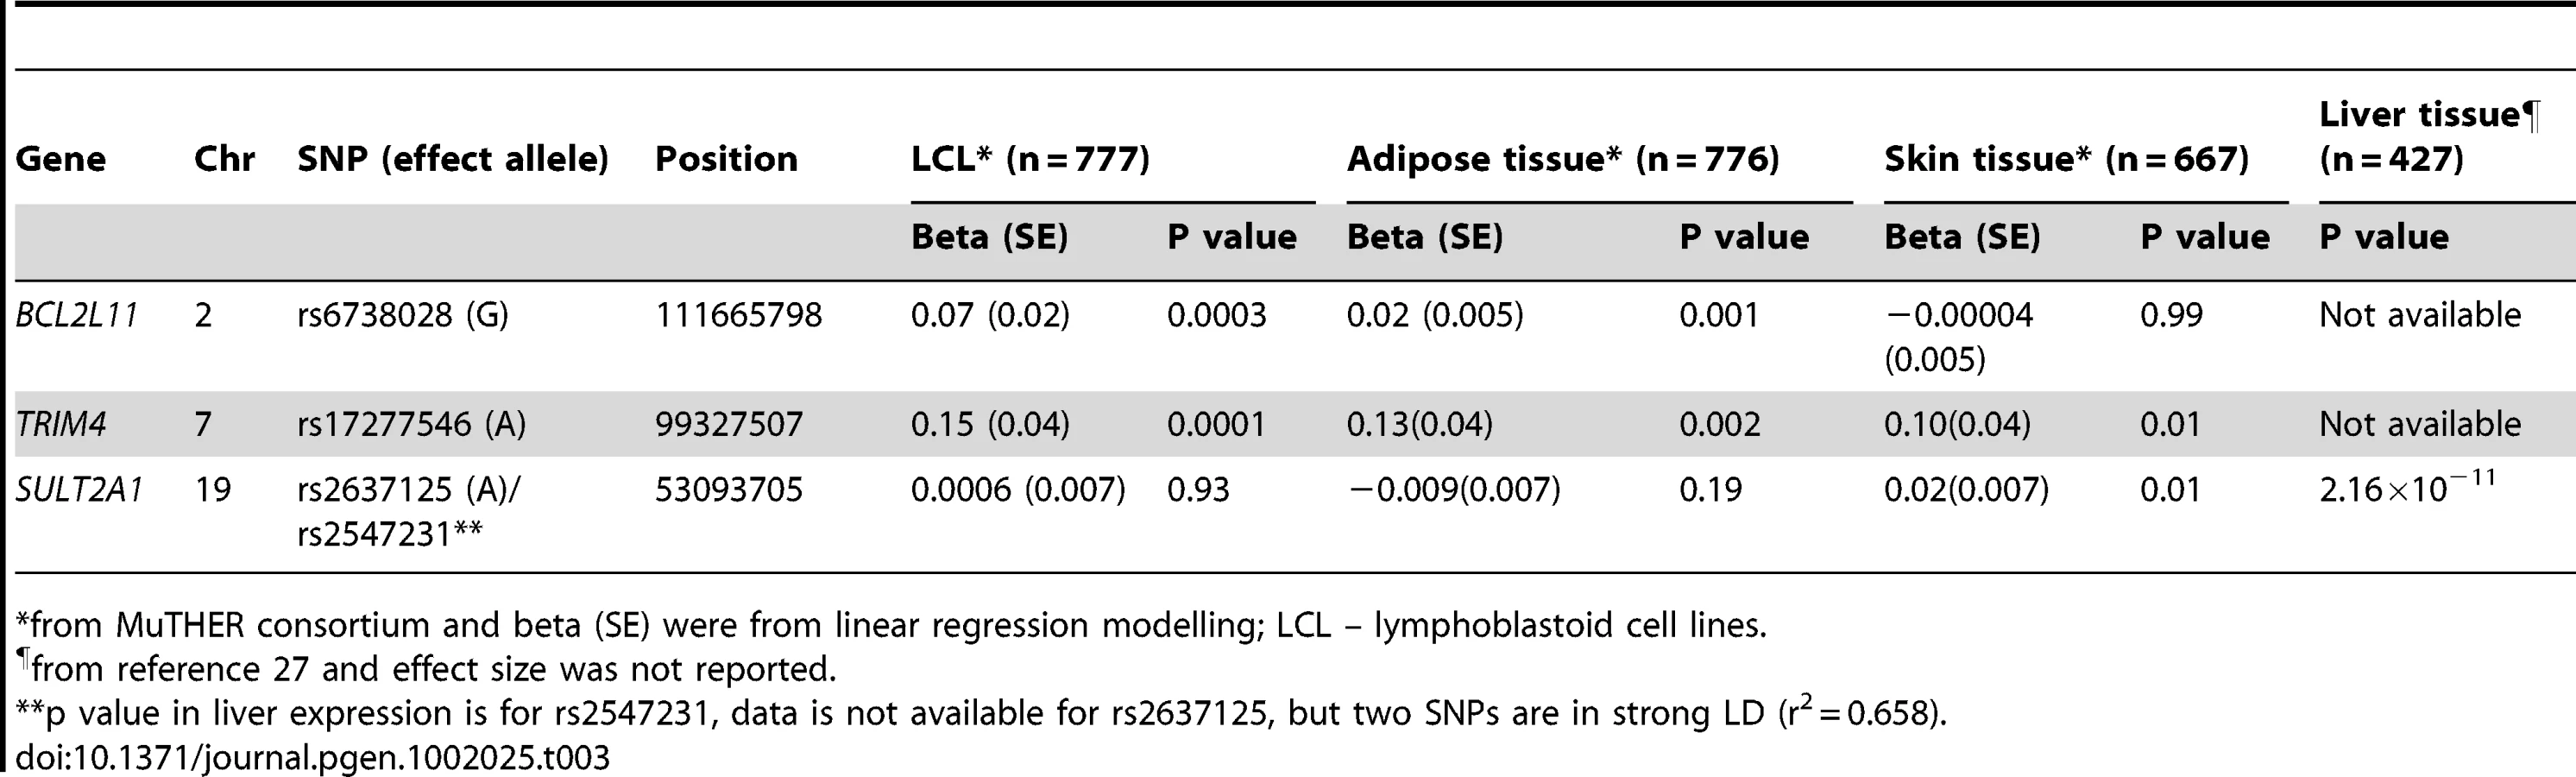
The genes at, or near the identified SNPs, include BCL2L11 on chromosome 2, ZKSCAN5, ARPC1A, TRIM4 and CYP3A43 on chromosome 7, HHEX and CYP2C9 on chromosome 10, BMF on chromosome 15, and SULT2A1 on chromosome 19 (Figure 2). To explore the potentially functional impacts and likely genetic mechanisms, we used two resources: Genome-wide expression data from the Multiple Tissue Human Expression Resource (MuTHER) [28] (http://www.muther.ac.uk/) based on ∼777 unselected UK twins sampled for skin, adipose tissue, and lymphoblastoid cell lines (LCLs) (more details in Text S1); and published gene expression data in human liver [29]. We found that 3 DHEAS-associated SNPs were clearly associated with the related gene expression levels in at least one tissue after accounting for multiple testing (Table 3). These specific transcript associations provide further evidence for the likely functional gene at each locus.

Further, we carried out gene ontology and pathway analyses using a gene set enrichment analysis (GSEA) approach in MAGENTA [30] which consists of four main steps: First, DNA variants, e.g. SNP, are mapped onto genes. Second, each gene is assigned a gene association score that is a function of its regional SNP association p-values. Third, confounding effects on gene association scores are identified and corrected for, without requiring genotype data. Fourth, a GSEA-like statistical test is applied to predefined biologically relevant gene sets to determine whether any of the gene sets are enriched for highly ranked gene association scores compared to randomly sampled gene sets of identical size from the genome. More details of these four steps are described in the method section. In this analysis, we identified three pathways which passed our significance threshold (false discovery rate (FDR)<0.05); xenobiotic metabolism with FDR = 0.001 (pathway database: KEGG and Ingenuity), retinoid X receptor (RXR) function with FDR = 0.003 (pathway database: Ingenuity), and linoleic acid metabolism with FDR = 0.02 (pathway database: KEGG) (Figure S1). The top significant genes with p<5.0×10⁻⁸ include CYP3A4, CYP3A43, CYP3A5, and CYP3A7 on chromosome 7, and CYP2C8 and CYP2C9 on chromosome 10 for all three pathways, and SULT2A1 for RXR pathway. The best index SNPs are rs17277546 for CYP3A4 and CYP3A43, rs4646450 for CYP3A5 and CYP3A7, rs2185570 for CYP2C9, rs11572169 for CYP2C8, and rs2637125 for SULT2A1. The full list of the genes in each of the three pathways and the best index SNPs for each gene are listed in Table S2. Three SNPs – rs17277546, rs2185570, and rs2637125 are the DHEAS-associated SNPs found in our meta-analysis. Both rs4646450 and rs11572169 were associated with DHEAS with p values of 8.8×10⁻¹⁷ and 4.8×10⁻⁸, respectively, but become non-significant in the conditional meta-analysis because rs4646450 is in linkage disequilibrium (LD, r2 = 0.429) with rs11761528 which is the most significant DHEAS-associated SNP while rs11572169 is in high LD (r2 = 0.778) with rs2185570. Intriguingly, two pathways - xenobiotic metabolism and linoleic acid metabolism, have been linked to ageing in model organisms [31]–[36].
Discussion
This is the first meta-analysis of GWA studies on serum DHEAS in 14,846 Caucasian subjects. We found 8 common SNPs that implicate nearby genes that are independently associated with serum DHEAS concentrations and provide clues to its role in ageing.
Among the genes identified, SULT2A1, a specialized sulpho-transferase which converts DHEA to DHEAS in the adrenal cortex, is an obvious candidate gene [3]. SULT2A1 has a broad substrate specificity, which includes conversion of pregnenolone, 17α-hydroxypregnenolone, and DHEA to their respective sulphated products [37]. Once sulphated by SULT2A1, pregnenolone and 17α-hydroxypregnenolone are no longer available as substrates for HSD3B2. Therefore, SULT2A1 sulphation of pregnenolone and 17α-hydroxypregnenolone removes these substrates from the mineralocorticoid and glucocorticoid biosynthetic pathways. This suggests that high levels of SULT2A1 would ensure the formation of DHEAS [3].
Variation in SULT2A1 expression has previously been associated with variation of DHEAS concentration [38]. The SULT2A1 gene is predominantly expressed in the adrenal cortex and to a lesser extent in the liver. We found that rs2547231 (p = 1.76×10⁻¹⁷), located 12 kb downstream of SULT2A1, was strongly associated with expression levels of SULT2A1 in human liver tissues. Although this SNP is not the most strongly associated with serum DHEAS, it is itself in strong LD with the most significant SNP rs2637125 (r2 = 0.658). However, we did not find a significant association with SULT2A1 expression levels in LCL, skin, and adipose tissues, suggesting a tissue specific effect. The SULT2B1b is also reported to play a role in sulphation of DHEA, but in comparison, the strongest signal from that genomic region was rs10417472 with a p = 0.06. In contrast, enzymatic removal of the sulphate group from DHEAS to form DHEA is performed by steroid sulphatase gene (STS), but that gene is on the X chromosome and so was not assessed in this meta-analysis.
CYP2C9 is an important cytochrome P450 enzyme, accounts for approximately 17–20% of the total P450 content in human liver, and catalyzes many reactions involved in drug metabolism as well as synthesis of cholesterol, steroids and other lipids [39]. We found that rs2185570 located in the CYP2C9 gene region is associated with serum DHEAS concentrations. This SNP is in strong LD with rs4086116 and rs4917639 (r2 = 0.67 for both) which were found to be associated with acenocoumarol [40] and warfarin maintenance dosage [41] respectively in recent GWAS.
Two other cytochrome P450 enzymes – CYP11A1 and CYP17A1, are two important enzymes which are required in the synthesis of DHEAS in the adrenal gland [3], however, the strongest signals in the genomic region were rs2930306 with p = 0.29 for CYP11A1 and rs4919686 with p = 0.04 for CYP17A1.
The decline in serum DHEAS concentrations with increasing age has been proposed as a putative biomarker of ageing [21]. We found that two putative ageing genes – BCL2L11 and BMF [42] are associated with serum DHEAS concentrations. Both of them encode proteins which belong to the BCL2 family and act as anti - or pro-apoptotic regulators that are involved in a wide variety of cellular activities. BCL2L11 has been implicated in chronic lymphocytic leukaemia (rs17483466, P = 2.36×10⁻¹⁰) [43] and follicular lymphoma (rs3789068, P for trend = 0.0004) [44]. The DHEAS-associated SNP rs6738028 is not however one of the same SNPs associated with lymphocytic leukaemia and follicular lymphoma nor is it in LD with them. Nevertheless, rs6738028 is strongly associated with BCL2L11 gene expression levels in both LCL and adipose tissues, suggesting its putative regulatory role. There is relatively little data on the human BMF gene or the protein product, but Bmf−/− mice show altered immune and hematopoietic phenotypes as well as defects in uterovaginal development. However, we were not able to detect any association between rs7181230 and the expression levels of BMF in the tissues we studied.
HHEX encodes a member of the homeobox family of transcription factors, many of which are involved in developmental processes. This gene has been found to be associated with type 2 diabetes by several recent GWAS [45]–[51]. The risk alleles of the diabetes-associated SNPs rs1111875 and rs5015480 are associated with low serum DHEAS concentrations although the p values (p = 0.0009 for both SNPs) didn't reach to the GWAS significance level. This is consistent with the observation in which the low serum DHEAS concentrations were associated with insulin resistance [6], [7]. The identified DHEAS-associated SNP rs2497306 is in moderate LD with rs1111875 and rs5015480 (r2 = 0.38). And the major allele of rs2497306 is associated with increasing serum DHEAS concentrations. The reason for the observed association is unknown. Studies showed that insulin infusion increases the metabolic clearance of DHEA and DHEAS [52], [53], resulting in decreased DHEA and DHEAS concentrations, and DHEA administration significantly enhances insulin sensitivity attenuating the age-related decline in glucose tolerance [54], partly explaining why the diabetes-associated gene is also associated with DHEAS. Interestingly, HHEX null mice show cardiovascular, endocrine, liver, muscle, nervous system, and metabolic phenotypes, suggesting extensive multisystem roles for the protein product of this gene. The findings could help dissect causal pathways for the observed associations between DHEAS, insulin resistance, age-related decline in glucose tolerance [54], and other age related phenotypes [55].
Three identified DHEAS-associated SNPs on chromosome 7 (Figure S2), which were independent, and 161 kb downstream (rs740160) and 370 kb upstream (rs17277546) apart from rs11761528 which is located in the middle of the region, are located in four genes - ZKSCAN5, ARPC1A, and TRIM4/CYP3A43. ZKSCAN5 encodes a zinc finger protein of the Kruppel family and is expressed ubiquitously in adult and fetal tissues with the strongest expression in testis [56]. rs11761528 is located in the intron of the ZKSCAN5 gene. It is the strongest signal we found and explains 1% of the total variance of serum DHEAS concentration alone. ARPC1A encodes one of seven subunits of the human Arp2/3 protein complex which has been implicated in actin polymerization and filament assembly in cells [57]. TRIM4 encodes a member of the tripartite motif (TRIM) family whereas CYP3A43 is another cytochrome P450 enzyme. The potential mechanisms for the association are unknown, but we found that rs17277546 is strongly associated with expression levels of TRIM4 not CYP3A43, suggesting TRIM4 is the possible candidate for DHEAS. However, rs17277546 is the best index SNP for both CYP3A43 and CYP3A4 genes in the pathway analysis, indicating a fine mapping in this region is needed to reveal the potential mechanism for the association. Further, the region harbours many other genes including CYP3A7 which has been reported to increase the clearance of DHEA and DHEAS [58] and a common haplotype polymorphism in the gene has been associated with DHEAS [59], [60]. However, none of the DHEAS-associated SNPs are associated with its expression levels in the tissues we studied, and the best index SNP rs4646450 for CYP3A7 found in our pathway analysis is in LD with rs11761528 and become non-significant in the conditional analysis.
In the pathway analysis, two DHEAS-associated SNPs (rs2185570 and rs17277546) were contained in all three pathways we found and one SNP (rs2637125) was contained in the RXR function pathway. Intriguingly, components of the xenobiotic metabolism pathway have been linked to ageing in model organisms, for example, age-associated changes in expression of genes involved in xenobiotic metabolism have been identified in rats [31], [32], up-regulation of xenobiotic detoxification genes has been observed in long-lived mutant mice [33], and adrenal xenobiotic-metabolizing activities increase with ageing in guinea pigs [34]. Furthermore, linoleic acid metabolism has also been linked to changes with ageing in rat cardiac muscle [35] and in human skin fibroblasts [36]. Taken together, these findings suggest that molecular pathways involved in ageing and longevity may also underlie DHEAS regulation, suggesting shared genetic components in both processes and corroborating a role for DHEAS as a marker of biological ageing.
In summary, this first GWAS identified eight independent SNPs associated with serum DHEAS concentrations. The related genes have various associations with steroid hormone metabolism, co-morbidities of ageing including type 2 diabetes, lymphoma, actin filament assembly, drug and xenobiotic metabolism, and zinc fingers - suggesting a wider functional role for DHEAS than previously thought.
Methods
Study population
Seven study samples contributed to this meta-analysis of GWA studies on serum DHEAS concentrations, comprising a total of 14,846 men and women of Caucasian origin. The consortium was made up of populations from TwinsUK (n = 4,906), Framingham Heart Study (FHS) (n = 3,183), SHIP (n = 1,832), Rotterdam Study (RS1) (n = 1,597), InCHIANTI (n = 1,182), Health ABC (n = 1,222), and GOOD (n = 924). Full details can be found in Text S1.
DHEAS methods
Blood samples were collected from each of the study participants either after overnight fasting or non-fasting and the serum levels of DHEAS were measured by either immunoassay or liquid chromatography tandem mass spectrometry (LC-MS/MS) methods (Text S1). Because the distribution of the serum DHEAS levels was skewed, we log transformed the concentrations and the transformed data used in the subsequent analysis.
Genotyping and imputation
Seven study populations were genotyped using a variety of genotyping platforms including Illumina (HumanHap 317k, 550k, 610k, 1M-Duo BeadChip) and Affymetrix (array 500K, 6.0). Each cohort followed a strict quality control on the genotyping data. More details on the quality control and filtering criteria can be found in Text S1. In order to increase genomic coverage and allow the evaluation of the same SNPs across as many study populations as possible, each study imputed genotype data based on the HapMap CEU Build 36. Algorithms were used to infer unobserved genotypes in a probabilistic manner in either MACH (http://www.sph.umich.edu/csg/abecasis/MACH), or IMPUTE [61]. We exclude non-genotyped SNPs with an imputation quality score <0.2 and SNPs with allele frequency <0.01 from meta-analysis.
Statistical method
Each study performed genome-wide association testing for serum concentrations of DHEAS across approximately 2.5 million SNPs under an additive genetic model separately in men and women (Text S1). The analyses were adjusted for age. In addition, the association testing was performed in the combined men and women data with adjustment for age and sex. Studies used PLINK, GenABEL, SNPTEST, QUICKTEST, or MERLIN for the association testing. The summary results from each cohort were meta-analyzed by Z-score pooling method implemented in Metal (http://www.sph.umich.edu/csg/abecasis/metal/). We chose this method to minimize the impact of the different assays used for serum DHEAS measurements. Specifically, for each study, we converted the two-sided P value after adjustment for population stratification by the genomic control method to a Z statistic that was signed to reflect the direction of the association given the reference allele. Each Z score was then weighted; the squared weights were chosen to sum to 1, and each sample-specific weight was proportional to the square root of the effective number of individuals in the sample. We summed the weighted Z statistics across studies and converted the summary Z score to a two-sided P value. We also used I2 index to assess between-study heterogeneity and the inverse variance weighted method to estimate the effect size. Genome-wide significance was defined as p<5×10⁻⁸. The association between the DHEAS-associated SNPs and the related gene expression levels in MuTHER data were examined by mixed linear regression modelling which takes both family structure and batch effects into account. The significance was defined as p<0.006 after accounting for multiple testing (Bonferroni method, correcting 9 independent tests).
Pathway analysis
Meta-Analysis Gene-set Enrichment of variaNT Associations (MAGENTA) was used to explore pathway-based associations in the full GWAS dataset. MAGENTA implements a gene set enrichment analysis (GSEA) based approach, the methodology of which is described in Segrè et al [30]. Briefly, each gene in the genome is mapped to a single index SNP with the lowest P-value within a 110 kb upstream, 40 kb downstream window. This P-value, representing a gene score, is then corrected for confounding factors such as gene size, SNP density and LD-related properties in a regression model. Genes within the HLA-region were excluded from analysis due to difficulties in accounting for gene density and LD patterns. Each mapped gene in the genome is then ranked by its adjusted gene score. At a given significance threshold (95th and 75th percentiles of all gene scores), the observed number of gene scores in a given pathway, with a ranked score above the specified threshold percentile, is calculated. This observed statistic is then compared to 1,000,000 randomly permuted pathways of identical size. This generates an empirical GSEA P-value for each pathway. Significance was determined when an individual pathway reached a false discovery rate (FDR)<0.05 in either analysis. In total, 2529 pathways from Gene Ontology, PANTHER, KEGG and Ingenuity were tested for enrichment of multiple modest associations with serum DHEAS levels.
Ethics statement
All studies were approved by local ethics committees and all participants provided written informed consent as stated in Text S1.
Supporting Information
Zdroje
1. LabrieF 1991 Intracrinology. Mol Cell Endocrinol 78 C113 118
2. ThomasGFrenoyNLegrainSSebag-LanoeRBaulieuEEDebuireB 1994 Serum dehydroepiandrosterone sulfate levels as an individual marker. J Clin Endocrinol Metab 79 1273 1276
3. RaineyWECarrBRSasanoHSuzukiTMasonJI 2002 Dissecting human adrenal androgen production. Trends Endocrinol Metab 13 234 239
4. LeowattanaW 2001 DHEA(S): the fountain of youth. J Med Assoc Thai 84 Suppl 2 S605 612
5. CelecPStarkaL 2003 Dehydroepiandrosterone - is the fountain of youth drying out? Physiol Res 52 397 407
6. MottlRCermanJ 2004 A relationship between dehydroepiandrosterone sulphate and insulin resistance in obese men and women. Vnitr Lek 50 923 929
7. BrennanKHuangAAzzizR 2009 Dehydroepiandrosterone sulfate and insulin resistance in patients with polycystic ovary syndrome. Fertil Steril 91 1848 1852
8. SuzukiMKanazawaAHasegawaMHattoriYHaranoY 1999 A close association between insulin resistance and dehydroepiandrosterone sulfate in subjects with essential hypertension. Endocr J 46 521 528
9. HaringRVolzkeHFelixSBSchipfSDorrMRosskopfDNauckMSchoflCWallaschofskiH 2009 Prediction of metabolic syndrome by low serum testosterone levels in men: results from the study of health in Pomerania. Diabetes 58 2027 2031
10. SzathmariMSzucsJFeherTHolloI 1994 Dehydroepiandrosterone sulphate and bone mineral density. Osteoporos Int 4 84 88
11. MiklosS 1995 Dehydroepiandrosterone sulphate in the diagnosis of osteoporosis. Acta Biomed Ateneo Parmense 66 139 146
12. SunAJJingTHeymsfieldSBPhillipsGB 2003 Relationship of leptin and sex hormones to bone mineral density in men. Acta Diabetol 40 Suppl 1 S101 105
13. SandersJLCappolaARArnoldAMBoudreauRMChavesPHRobbinsJCushmanMNewmanAB 2010 Concurrent Change in Dehydroepiandrosterone Sulfate and Functional Performance in the Oldest Old: Results From the Cardiovascular Health Study All Stars Study. J Gerontol A Biol Sci Med Sci
14. Barrett-ConnorEKhawKTYenSS 1986 A prospective study of dehydroepiandrosterone sulfate, mortality, and cardiovascular disease. N Engl J Med 315 1519 1524
15. JanssonJHNilssonTKJohnsonO 1998 von Willebrand factor, tissue plasminogen activator, and dehydroepiandrosterone sulphate predict cardiovascular death in a 10 year follow up of survivors of acute myocardial infarction. Heart 80 334 337
16. MazatLLafontSBerrCDebuireBTessierJFDartiguesJFBaulieuEE 2001 Prospective measurements of dehydroepiandrosterone sulfate in a cohort of elderly subjects: relationship to gender, subjective health, smoking habits, and 10-year mortality. Proc Natl Acad Sci U S A 98 8145 8150
17. CappolaARO'MearaESGuoWBartzTMFriedLPNewmanAB 2009 Trajectories of dehydroepiandrosterone sulfate predict mortality in older adults: the cardiovascular health study. J Gerontol A Biol Sci Med Sci 64 1268 1274
18. OhlssonCLabrieFBarrett-ConnorEKarlssonMKLjunggrenOVandenputLMellstromDTivestenA 2010 Low serum levels of dehydroepiandrosterone sulfate predict all-cause and cardiovascular mortality in elderly Swedish men. J Clin Endocrinol Metab 95 4406 4414
19. Barrett-ConnorEGoodman-GruenD 1995 The epidemiology of DHEAS and cardiovascular disease. Ann N Y Acad Sci 774 259 270
20. PhillipsACCarrollDGaleCRLordJMArltWBattyGD 2010 Cortisol, DHEAS, their ratio and the metabolic syndrome: evidence from the Vietnam Experience Study. Eur J Endocrinol 162 919 923
21. LeowattanaW 2004 DHEAS as a new diagnostic tool. Clin Chim Acta 341 1 15
22. NestlerJEWhitfieldJBWilliamsTYZhuGCondonJKirkKMHeathACMontgomeryGWMartinNG 2002 Genetics of serum dehydroepiandrosterone sulfate and its relationship to insulin in a population-based cohort of twin subjects. J Clin Endocrinol Metab 87 682 686
23. MeikleAWStringhamJDWoodwardMGBishopDT 1988 Heritability of variation of plasma cortisol levels. Metabolism 37 514 517
24. AnPRiceTGagnonJHongYLeonASSkinnerJSWilmoreJHBouchardCRaoDC 2001 Race differences in the pattern of familial aggregation for dehydroepiandrosterone sulfate and its responsiveness to training in the HERITAGE Family Study. Metabolism 50 916 920
25. RotterJIWongFLLifrakETParkerLN 1985 A genetic component to the variation of dehydroepiandrosterone sulfate. Metabolism 34 731 736
26. Davey SmithGEbrahimS 2003 ‘Mendelian randomization’: can genetic epidemiology contribute to understanding environmental determinants of disease? Int J Epidemiol 32 1 22
27. DevlinBRoederK 1999 Genomic control for association studies. Biometrics 55 997 1004
28. NicaACPartsLGlassDNisbetJBarrettA 2011 The Architecture of Gene Regulatory Variation across Multiple Human Tissues: The MuTHER Study. PLoS Genet 7 e1002003 doi:10.1371/journal.pgen.1002003
29. SchadtEEMolonyCChudinE 2008 Mapping the genetic architecture of gene expression in human liver. PLoS Biol 6 e107 doi:10.1371/journal.pbio.0060107
30. SegreAVGroopLMoothaVKDalyMJAltshulerD 2010 Common inherited variation in mitochondrial genes is not enriched for associations with type 2 diabetes or related glycemic traits. PLoS Genet 6 e1001058 doi:10.1371/journal.pgen.1001058
31. MoriKBlackshearPELobenhoferEK 2007 Hepatic transcript levels for genes coding for enzymes associated with xenobiotic metabolism are altered with age. Toxicol Pathol 35 242 251
32. LeeJHBanerjeeAUenoYRamaiahSK 2008 Potential relationship between hepatobiliary osteopontin and peroxisome proliferator-activated receptor alpha expression following ethanol-associated hepatic injury in vivo and in vitro. Toxicol Sci 106 290 299
33. Amador-NoguezDDeanAHuangWSetchellKMooreDDarlingtonG 2007 Alterations in xenobiotic metabolism in the long-lived Little mice. Aging Cell 6 453 470
34. YuanBBTchaoRVoigtJMColbyHD 2001 Maturational changes in CYP2D16 expression and xenobiotic metabolism in adrenal glands from male and female guinea pigs. Drug Metab Dispos 29 194 199
35. Lopez JimenezJABordoniALorenziniARossiCABiagiPLHreliaS 1997 Linoleic acid metabolism in primary cultures of adult rat cardiomyocytes is impaired by aging. Biochem Biophys Res Commun 237 142 145
36. RaederstorffDLoechleiterVMoserU 1995 Polyunsaturated fatty acid metabolism of human skin fibroblasts during cellular aging. Int J Vitam Nutr Res 65 51 55
37. WeinshilboumRMOtternessDMAksoyIAWoodTCHerCRaftogianisRB 1997 Sulfation and sulfotransferases 1: Sulfotransferase molecular biology: cDNAs and genes. Faseb J 11 3 14
38. SuzukiTSasanoHTakeyamaJKanekoCFreijeWACarrBRRaineyWE 2000 Developmental changes in steroidogenic enzymes in human postnatal adrenal cortex: immunohistochemical studies. Clin Endocrinol (Oxf) 53 739 747
39. OmiecinskiCJRemmelRPHosagraharaVP 1999 Concise review of the cytochrome P450s and their roles in toxicology. Toxicol Sci 48 151 156
40. TeichertMEijgelsheimMRivadeneiraFUitterlindenAGvan SchaikRHHofmanADe SmetPAvan GelderTVisserLEStrickerBH 2009 A genome-wide association study of acenocoumarol maintenance dosage. Human molecular genetics 18 3758 3768
41. TakeuchiFMcGinnisRBourgeoisS 2009 A genome-wide association study confirms VKORC1, CYP2C9, and CYP4F2 as principal genetic determinants of warfarin dose. PLoS Genet 5 e1000433 doi:10.1371/journal.pgen.1000433
42. LukiwWJBazanNG 2010 Inflammatory, apoptotic, and survival gene signaling in Alzheimer's disease. A review on the bioactivity of neuroprotectin D1 and apoptosis. Mol Neurobiol 42 10 16
43. Di BernardoMCCrowther-SwanepoelDBroderickP 2008 A genome-wide association study identifies six susceptibility loci for chronic lymphocytic leukemia. Nat Genet 40 1204 1210
44. MortonLMPurdueMPZhengT 2009 Risk of non-Hodgkin lymphoma associated with germline variation in genes that regulate the cell cycle, apoptosis, and lymphocyte development. Cancer Epidemiol Biomarkers Prev 18 1259 1270
45. VoightBFScottLJSteinthorsdottirV 2010 Twelve type 2 diabetes susceptibility loci identified through large-scale association analysis. Nat Genet 42 579 589
46. TakeuchiFSerizawaMYamamotoK 2009 Confirmation of multiple risk Loci and genetic impacts by a genome-wide association study of type 2 diabetes in the Japanese population. Diabetes 58 1690 1699
47. ZegginiEScottLJSaxenaR 2008 Meta-analysis of genome-wide association data and large-scale replication identifies additional susceptibility loci for type 2 diabetes. Nat Genet 40 638 645
48. SaxenaRVoightBFLyssenkoV 2007 Genome-wide association analysis identifies loci for type 2 diabetes and triglyceride levels. Science 316 1331 1336
49. ScottLJMohlkeKLBonnycastleLL 2007 A genome-wide association study of type 2 diabetes in Finns detects multiple susceptibility variants. Science 316 1341 1345
50. ZegginiEWeedonMNLindgrenCM 2007 Replication of genome-wide association signals in UK samples reveals risk loci for type 2 diabetes. Science 316 1336 1341
51. SladekRRocheleauGRungJ 2007 A genome-wide association study identifies novel risk loci for type 2 diabetes. Nature 445 881 885
52. LavalleeBProvostPRKahwashZNestlerJEBelangerA 1997 Effect of insulin on serum levels of dehydroepiandrosterone metabolites in men. Clin Endocrinol (Oxf) 46 93 100
53. NestlerJEBeerNAJakubowiczDJBeerRM 1994 Effects of a reduction in circulating insulin by metformin on serum dehydroepiandrosterone sulfate in nondiabetic men. J Clin Endocrinol Metab 78 549 554
54. BatesGWJrEgermanRSUmstotESBusterJECassonPR 1995 Dehydroepiandrosterone attenuates study-induced declines in insulin sensitivity in postmenopausal women. Ann N Y Acad Sci 774 291 293
55. BogueCWZhangPXMcGrathJJacobsHCFuleihanRL 2003 Impaired B cell development and function in mice with a targeted disruption of the homeobox gene Hex. Proc Natl Acad Sci U S A 100 556 561
56. DreyerSDZhengQZabelBWinterpachtALeeB 1999 Isolation, characterization, and mapping of a zinc finger gene, ZFP95, containing both a SCAN box and an alternatively spliced KRAB A domain. Genomics 62 119 122
57. WelchMDDePaceAHVermaSIwamatsuAMitchisonTJ 1997 The human Arp2/3 complex is composed of evolutionarily conserved subunits and is localized to cellular regions of dynamic actin filament assembly. J Cell Biol 138 375 384
58. MillerKKCaiJRippSLPierceWMJrRushmoreTHProughRA 2004 Stereo - and regioselectivity account for the diversity of dehydroepiandrosterone (DHEA) metabolites produced by liver microsomal cytochromes P450. Drug Metab Dispos 32 305 313
59. SmitPvan SchaikRHvan der WerfMvan den BeldAWKoperJWLindemansJPolsHABrinkmannAOde JongFHLambertsSW 2005 A common polymorphism in the CYP3A7 gene is associated with a nearly 50% reduction in serum dehydroepiandrosterone sulfate levels. J Clin Endocrinol Metab 90 5313 5316
60. GoodarziMOXuNAzzizR 2008 Association of CYP3A7*1C and serum dehydroepiandrosterone sulfate levels in women with polycystic ovary syndrome. J Clin Endocrinol Metab 93 2909 2912
61. MarchiniJHowieBMyersSMcVeanGDonnellyP 2007 A new multipoint method for genome-wide association studies by imputation of genotypes. Nat Genet 39 906 913
Štítky
Genetika Reprodukční medicínaČlánek vyšel v časopise
PLOS Genetics
2011 Číslo 4
- Kazuistika – Perspektivy využití precizované medicíny v rámci personalizované specifické terapie onkologických pacientů
- Nobelova cena za chemii pro genetické nůžky: Objev, který změní naši budoucnost?
- Technologie na bázi RNA v klinické praxi: od přebarvených petúnií k terapii vzácných a dosud jen obtížně léčitelných chorob u lidí
- „Nepředstavovali jsme si, že náš výzkum povede přímo ke vzniku nových léků, dokonce ještě za našeho života“
- Bezplatné služby pro diagnostiku ATTRv amyloidózy pro kardiology
Nejčtenější v tomto čísle
- Survival Motor Neuron Protein Regulates Stem Cell Division, Proliferation, and Differentiation in
- PTG Depletion Removes Lafora Bodies and Rescues the Fatal Epilepsy of Lafora Disease
- Evolution of Vertebrate Transient Receptor Potential Vanilloid 3 Channels: Opposite Temperature Sensitivity between Mammals and Western Clawed Frogs
- An Evolutionary Genomic Approach to Identify Genes Involved in Human Birth Timing
Zvyšte si kvalifikaci online z pohodlí domova
Mazová zátka a její řešení
nový kurzVšechny kurzy