
Epistatic Interaction Maps Relative to Multiple Metabolic Phenotypes
An epistatic interaction between two genes occurs when the phenotypic impact of one gene depends on another gene, often exposing a functional association between them. Due to experimental scalability and to evolutionary significance, abundant work has been focused on studying how epistasis affects cellular growth rate, most notably in yeast. However, epistasis likely influences many different phenotypes, affecting our capacity to understand cellular functions, biochemical networks adaptation, and genetic diseases. Despite its broad significance, the extent and nature of epistasis relative to different phenotypes remain fundamentally unexplored. Here we use genome-scale metabolic network modeling to investigate the extent and properties of epistatic interactions relative to multiple phenotypes. Specifically, using an experimentally refined stoichiometric model for Saccharomyces cerevisiae, we computed a three-dimensional matrix of epistatic interactions between any two enzyme gene deletions, with respect to all metabolic flux phenotypes. We found that the total number of epistatic interactions between enzymes increases rapidly as phenotypes are added, plateauing at approximately 80 phenotypes, to an overall connectivity that is roughly 8-fold larger than the one observed relative to growth alone. Looking at interactions across all phenotypes, we found that gene pairs interact incoherently relative to different phenotypes, i.e. antagonistically relative to some phenotypes and synergistically relative to others. Specific deletion-deletion-phenotype triplets can be explained metabolically, suggesting a highly informative role of multi-phenotype epistasis in mapping cellular functions. Finally, we found that genes involved in many interactions across multiple phenotypes are more highly expressed, evolve slower, and tend to be associated with diseases, indicating that the importance of genes is hidden in their total phenotypic impact. Our predictions indicate a pervasiveness of nonlinear effects in how genetic perturbations affect multiple metabolic phenotypes. The approaches and results reported could influence future efforts in understanding metabolic diseases and the role of biochemical regulation in the cell.
Published in the journal:
. PLoS Genet 7(2): e32767. doi:10.1371/journal.pgen.1001294
Category:
Research Article
doi:
https://doi.org/10.1371/journal.pgen.1001294
Summary
An epistatic interaction between two genes occurs when the phenotypic impact of one gene depends on another gene, often exposing a functional association between them. Due to experimental scalability and to evolutionary significance, abundant work has been focused on studying how epistasis affects cellular growth rate, most notably in yeast. However, epistasis likely influences many different phenotypes, affecting our capacity to understand cellular functions, biochemical networks adaptation, and genetic diseases. Despite its broad significance, the extent and nature of epistasis relative to different phenotypes remain fundamentally unexplored. Here we use genome-scale metabolic network modeling to investigate the extent and properties of epistatic interactions relative to multiple phenotypes. Specifically, using an experimentally refined stoichiometric model for Saccharomyces cerevisiae, we computed a three-dimensional matrix of epistatic interactions between any two enzyme gene deletions, with respect to all metabolic flux phenotypes. We found that the total number of epistatic interactions between enzymes increases rapidly as phenotypes are added, plateauing at approximately 80 phenotypes, to an overall connectivity that is roughly 8-fold larger than the one observed relative to growth alone. Looking at interactions across all phenotypes, we found that gene pairs interact incoherently relative to different phenotypes, i.e. antagonistically relative to some phenotypes and synergistically relative to others. Specific deletion-deletion-phenotype triplets can be explained metabolically, suggesting a highly informative role of multi-phenotype epistasis in mapping cellular functions. Finally, we found that genes involved in many interactions across multiple phenotypes are more highly expressed, evolve slower, and tend to be associated with diseases, indicating that the importance of genes is hidden in their total phenotypic impact. Our predictions indicate a pervasiveness of nonlinear effects in how genetic perturbations affect multiple metabolic phenotypes. The approaches and results reported could influence future efforts in understanding metabolic diseases and the role of biochemical regulation in the cell.
Introduction
An epistatic interaction between two genes occurs when the phenotypic impact of at least one of the genes is dependent on the other [1]. This dependence is often a consequence of an underlying functional relationship between the two genes [2], [3]. By extending the study of epistasis from individual interactions to networks of interactions, recent work in S. cerevisiae has demonstrated that genome-wide patterns of epistasis can be used to uncover the global organization of biological systems [4]–[7]. In such studies epistatic interactions are identified as instances where the effect of a double perturbation on growth differs from the expectation based on the observed effects of the corresponding single perturbations [8]. The choice of growth rate as a phenotype is motivated by the role of epistasis in the dynamics of selection [9], and by the fact that growth rate, a proxy for fitness, can be accurately measured in a high-throughput manner [10]. In parallel to the experimental efforts, large-scale studies of epistasis on growth phenotypes have also been pursued computationally, especially using the approach of flux balance analysis [6], [11], [12]. Such computational studies have offered preliminary novel insight before the availability of corresponding experimental data, e.g. in predicting a coherence principle (monochromaticity) in the organization of epistatic interaction networks [6], subsequently observed experimentally [7], [13]. Overall, large-scale studies of epistasis have become increasingly relevant to functional genomics [4], [7], [14], drug development [13], [15], [16] and evolutionary biology [17], [18].
Albeit important, growth rate is just one of many possible phenotypes relative to which genes can interact epistatically with each other. In contrast with the rapidly increasing understanding of the nature and scope of epistatic interactions relative to growth, many questions remain unresolved with respect to epistasis relative to non-growth phenotypes. Are interactions relative to non-growth phenotypes as widespread as interactions with respect to growth? Do genes tend to interact relative to more than one phenotype, and if so, is the type of epistasis consistent across phenotypes? How much more dense can an epistatic network become upon adding new phenotypes? Do interactions with respect to specific phenotypes provide biological insight than cannot be obtained from knowing interactions relative to growth rate? Most importantly, does the potential presence of multi-phenotype epistasis affect the way cells operate and evolve? While these questions have not, to our knowledge been asked before, epistasis relative to non-growth phenotypes is not in itself a new concept. Interactions between polymorphisms have been detected by using multiple mRNA transcript levels as phenotypes [19]. Another recent study searched for interactions among genes conferring resistance to a DNA-damaging agent and showed that a denser network was observed with respect to the capacity to cope with the damaging agent, than was found with respect to growth rate under standard conditions [20]. In addition, in the study of human genetic diseases, while epistasis relative to disease-related traits poses challenging technical problems, it is a potentially important component, especially in light of the relative paucity of explanatory power detected through the analysis of individual loci [21]–[23]. Hence interactions relative to diverse phenotypes are likely widespread and informative. However, the combinatorial complexity resulting from the large number of possible genetic perturbations and phenotypes has prevented so far a systematic analysis of the extent and biological implications of this phenomenon.
In this work we report the computational study of epistatic interactions in a flux balance model of metabolism that is simple enough to allow an exhaustive computation of all possible perturbations relative to all possible phenotypes, but at the same time realistic enough to provide meaningful biological insight. Specifically, we use an experimentally informed variant of the method of minimization of metabolic adjustment (MOMA) in a genome-scale metabolic network model of Saccharomyces cerevisiae [24] to predict all steady state metabolic reaction rates (fluxes) in response to all possible single and double enzyme gene deletions. By comparing single and double mutant values for all fluxes and defining appropriate metrics, we construct an epistatic map for each flux phenotype (Figure 1). This multi-phenotype genetic interaction map allows us to explore for the first time the properties and significance of epistasis across a combinatorial set of perturbations and phenotypes.

Results
Generalizing the study epistasis to multiple metabolic flux phenotypes
Quantifying epistasis relative to multiple metabolic flux phenotypes introduces three fundamental challenges, one specific to the use of flux balance models and two broadly relevant to any study of multi-phenotype epistasis.
The first issue is the reliability of flux predictions for deletion mutants. The availability of experimentally determined growth phenotypes for all gene deletion mutants in S. cerevisiae has allowed for extensive evaluation of the yeast model's capacity to predict mutant growth. These previous studies [25], [26], including a comparison of model predictions against experimental growth measurements for 465 gene deletion mutants under 16 metabolically diverse conditions [26], have demonstrated that the yeast model can predict deletion mutant viability with high accuracy. Furthermore, observed discordances between model predictions and experimentally determined mutant growth phenotypes have been used in refinements of the existing yeast model, further bolstering the ability of the model to accurately mimic the effect of different gene deletions [25], [27]. In addition to effectively predicting single mutant growth, flux balance models have also been shown to predict viabilities of double deletion mutants with high accuracy [28]. However, while model predictions of mutant growth have been evaluated extensively, comparisons between measured and predicted fluxes through the underlying metabolic reactions in different mutants are less readily available [29]. To address this need we recently evaluated the ability of the yeast model to predict the fluxes through central carbon metabolism in single gene deletion mutants by comparing model predictions to a previously released compendium of experimentally measured mutant fluxes [30]. An assessment of different approaches for mutant flux prediction revealed that an experimentally driven variant of the minimization of metabolic adjustment [31] gives the best correlation with measured fluxes (Spearman rank correlation greater than 0.90, Figure S1), and hence chose it for our calculations (See Materials and Methods). In essence, this method implements the hypothesis that the metabolic response to genetic perturbation will be a minimal rerouting of flux around the insult. A conceptual illustration of the methodology for predicting mutant fluxes is shown in Figure 2, with a detailed quantitative description provided in the Materials and Methods and Text S1.

A second issue, which is critical to any multi-phenotype study of epistasis, is the choice of a metric for quantifying epistasis. The quantification of epistasis requires an assumption as to how the phenotypic effects of non-interacting mutations combine: deviations from this expectation are inferred to be indicative of epistasis. While previous work has provided both theoretical and empirical evidence for how the effects of mutations on fitness combine [8], no comprehensive study has yet explored how the effects of mutations on metabolic fluxes combine. To this end we evaluated two standard metrics for computing epistasis (multiplicative and additive definitions), in addition to a novel metric. This novel metric was designed so as to avoid making any assumption on how the phenotypic effects of two mutations combine. Avoiding such assumptions is ideal for detecting epistasis across multiple phenotypes, relative to which the effects of mutations may combine differently (See Text S1 and Table S1). However, comparing these three different quantitative definitions (See Materials and Methods and Text S1), we found that epistasis relative to metabolic fluxes is overall robustly detectable independent of the metric used (Figure S2). In the following analyses, based on this result, a multiplicative model is used, and all main conclusions were verified to be robust relative to different metrics.
A third issue arising in a global analysis of epistatic effects with respect to metabolic fluxes is the partitioning of interactions into different classes of epistasis [32]. These different classes of epistasis represent different ways in which the combined effect of two mutations may defy expectation, and can be indicative of different types of underlying functional relationships between genes [2], [6]. In moving from growth to flux phenotypes, the classification of interactions becomes more complex, due to the fact that fluxes can increase or decrease upon genetic perturbation, while the growth rate typically only decreases. While the increased complexity present in our data allows for discrimination of many different classes of interactions (See Figure S3 and Text S1), for the current analysis we consolidate all sub-classes of interactions into two groups, synergistic and antagonistic (See Materials and Methods, Figure S3). A synergistic interaction between two genes indicates that the change in the observed flux (phenotype) caused by the simultaneous deletion of both genes is greater than expected based on the effects of the corresponding single deletions, while an antagonistic interaction indicates a flux change in the double mutant that is less than expected. Synergistic interactions are indicative of a compensatory relationship between two genes, such that the extreme phenotype of the double mutant is a consequence of this compensation being lost. Antagonistic interactions are indicative of two genes working together towards some function, such that the reduced phenotypic effect of the double mutant occurs because the common function is compromised by the loss of either of the genes individually.
Overview of a multi-phenotype epistatic map
These preparatory steps allowed us to compute and analyze a 3-dimensional epistatic map for the yeast metabolic network, as illustrated in Figure 1. The complete set of synergistic and antagonistic epistatic interactions were reduced to a high-confidence set by independently applying a standard deviation cutoff to the distributions of epistasis relative to each phenotype (See Materials and Methods and Figure S4). Considering only these high confidence interactions, it was found that 100 of the 672 genes in the model interact with respect to at least one of the 293 fluxes active under the modeled minimal glucose condition. To simplify the subsequent analysis of the epistatic map, we consolidated the 100 interacting genes into the 30 metabolic processes to which they are assigned in the model, and counted an interaction between two processes if any gene from one process interacts with any gene from the other. This consolidated epistatic map is represented in Figure 3A, where the total numbers of synergistic (red), antagonistic (blue) and mixed (yellow) interactions between pairs of biological processes, across all phenotypes, are displayed as a stacked histogram. Mixed interactions between two processes occur when some pairs of genes across the processes interact synergistically, while others antagonistically. Figure 3A indicates that such mixed process interactions are less frequent than process interactions that are purely synergistic or antagonistic, suggesting that the previously observed monochromaticity of epistatic interactions between biological processes [6] applies to diverse metabolic phenotypes. Monochromaticity is a consequence of the fact that genes in the same biological processes function cohesively, and hence share similar patterns of epistatic interactions [4], [5], [7]. Notably, however, in our multi-phenotype epistatic map, the “color” (synergistic or antagonistic) of the interaction between two processes depends on the phenotype observed. Figure 3B demonstrates that this dependence of process interaction colors on phenotype is due to the fact that individual gene pairs often interact synergistically relative to some phenotypes and antagonistically relative to others. This pattern reveals that the class of an epistatic interaction is not an absolute characteristic of a pair of genes, but rather a characteristic of the gene-gene-phenotype triad. This suggests that the functional relationship between two genes is not necessarily one dimensional, but may depend on the function (the phenotype) being probed.

The intuition that different phenotypes convey complementary insight into the functional associations between genes and processes was confirmed in a quantitative manner by determining how many unique interactions each phenotype contributes to the 3D epistatic map. Figure 4 shows that the total number of interactions identified when considering all phenotypes is ∼8 times larger than can be identified relative to any individual phenotype, although the exact increase in interaction coverage is dependent on the threshold for defining a significant interaction (See Materials and Methods). Figure 4 also shows that 83 of the 293 total metabolic flux phenotypes are required to identify all unique epistatic interactions in yeast metabolism. Examining the distribution of metabolic processes where these 83 phenotypes come from (Figure S6), reveals that they are spread across all metabolic processes. This suggests that a set of phenotypes that represents all metabolic functions is required to identify all epistatic interactions. Conversely, this implies that different phenotypes are providing insights into unique aspects of the functional relationships between genes.

Epistatic interactions with respect to secretion phenotypes reflect functional interconnectivity of metabolic processes
To solidify the observation that different flux phenotypes reveal unique aspects of the functional relationships between genes, we next focus on the epistatic networks relative to two secretion phenotypes (succinate, Figure 5B, and glycerol, Figure 5C). We chose to focus on secretion flux phenotypes because they are the most tractable fluxes to measure experimentally, and hence potentially the most relevant for future experimental studies. Both of these secretion flux epistatic networks contain several interactions that are not detected relative to the growth phenotype (Figure 5A). In particular, in the succinate secretion network, the genes that are part of complex II of the electron transport chain (ETC II) display synergistic interactions with several other biological processes (Figure 5B). Among these interactions, which are indicative of an unexpectedly large increase in succinate secretion in the double mutant, the one between serine biosynthesis and ETCII has been reported in previous experimental efforts to overproduce succinate [33]. This interaction occurs because the predicted alternate pathway for serine biosynthesis produces succinate as a byproduct, and ETC II is the primary route through which this succinate is metabolized in the wild-type (Figure 6A, Figure S7). Thus, interactions with respect to succinate may in general probe the way in which TCA cycle intermediates are produced and consumed.

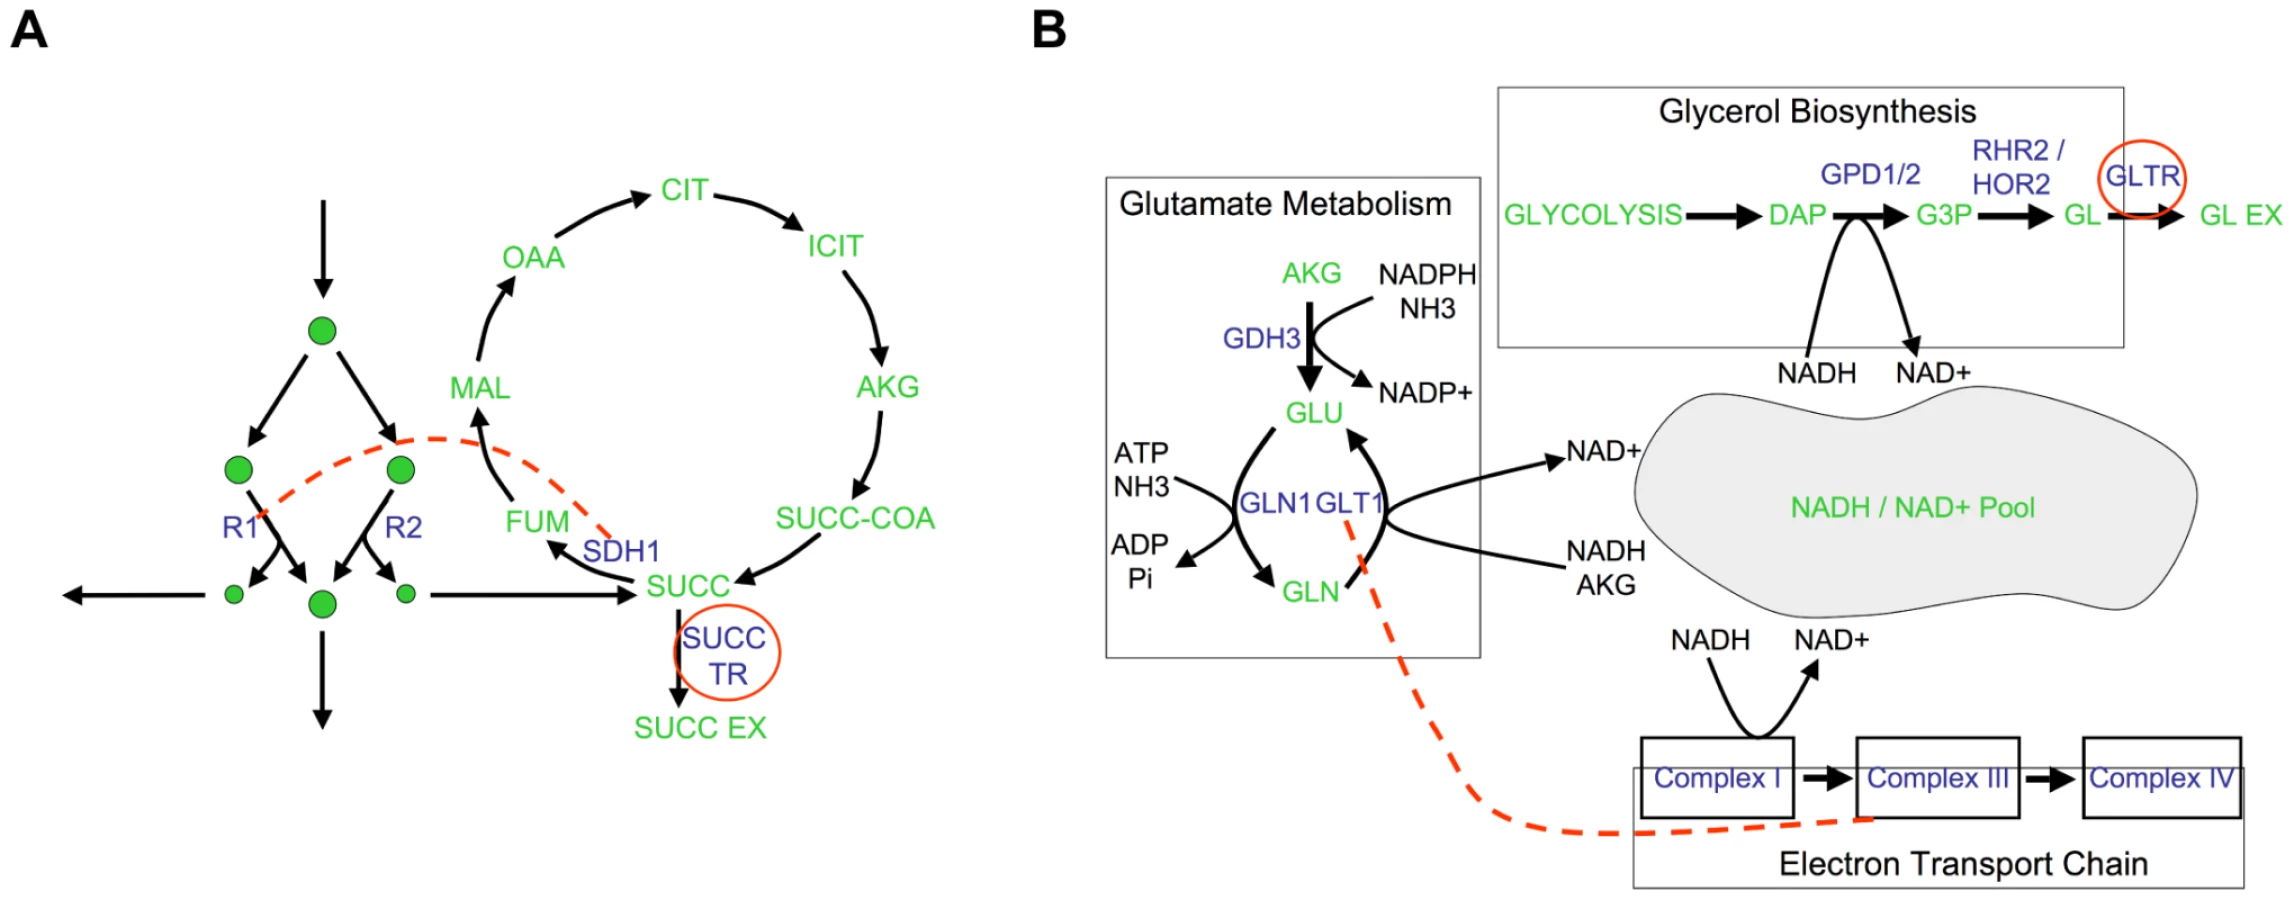
In the glycerol secretion phenotype network there is enrichment for synergistic interactions between glutamate biosynthesis and respiratory processes (Figure 5C). Among these interactions, the interaction between glutamate synthase and the electron transport chain is supported by experimental data gathered in the context of ethanol production optimization [34]. This epistatic interaction is a consequence of the fact that glutamate biosynthesis, the electron transport chain and glycerol biosynthesis correspond to three of the major routes for cytosolic NADH oxidation (Figure 6B, Figure S9). Thus, interactions with respect to glycerol secretion may reflect the way in which different processes contribute to cellular redox balance. These examples, and others in Text S1 and Figure S8, further demonstrate that interactions with respect to metabolic flux phenotypes can provide detailed insights into different aspects of the functional relationships between genes.
Properties of genes involved in many interactions across all metabolic phenotypes
So far, we have shown that epistatic interactions between gene deletions relative to metabolic flux phenotypes are ubiquitous, and can provide an understanding of the relationships between different processes in the cell. The ubiquity of epistasis relative to metabolic flux phenotypes brought to our attention the possibility that these complex network-level functional interdependencies might impose constraints on evolutionary trajectories. We hypothesized that this phenomenon might manifest itself in the form of increased evolutionary constraints on enzymes that are involved in many epistatic links with other genes. Such a relationship between epistatic connectivity and evolutionary rate has been recently observed in the experimentally constructed global genetic interaction network with respect to growth rate in yeast [7]. Thus, we set out to explore whether predicted connectivity with respect to metabolic phenotypes other than growth rate are also correlated with evolutionary constraint. To this end we calculated the Spearman rank correlation between the number of interactions in which different genes participate and the evolutionary rates of such genes, as measured by their non-synonymous to synonymous substitution ratios. This correlation was calculated separately for synergistic and antagonistic interactions relative to each of the 293 flux phenotypes, for a total of 586 correlations. The distributions of correlation coefficients for synergistic and antagonistic interactions across all phenotypes are shown in Figure 7A. Both distributions significantly deviate from zero, with an overall bias towards negative correlations (Sign test, p = 8.5×10⁻²⁵ (synergistic), 2.2×10−54 (antagonistic), n = 293). This trend towards negative correlations suggests that genes involved in many interactions with respect to metabolic flux phenotypes do indeed evolve slower.

While the negative skew of these distributions is robustly maintained upon removal of most potential confounding factors (see Figure S11) we found that it is significantly reduced when controlling for the codon bias of the genes (Figure 7B). Codon bias is a proxy for gene expression level, which previous research has shown to be the dominant correlate of evolutionary rate [35], [36]. Therefore, we cannot rule out that a portion of the apparent evolutionary importance of genes with a high degree of genetic interactions across different phenotypes may be explainable by the expression level of the genes. Yet, regardless of whether the interaction degree correlates with evolutionary rate or gene expression level, either result indicates the functional importance of these multi-phenotype hubs. The increased expression level of these hubs in fact supports their central role in metabolic function. Furthermore, in our model, epistatic interaction degree with respect to growth flux alone is not significantly anti-correlated with evolutionary rate, even without controlling for expression level (Figure S12). This indicates that the importance of genes is associated with their total phenotypic impact, not just their impact on growth.
While the distributions of correlations between evolutionary rate, and both synergistic and antagonistic interaction count, shift towards zero when controlling for codon bias, the distribution remains significantly different from zero only for antagonistic interactions (p = 0.07 (synergistic), p = 2.3×10⁻³¹ (antagonistic)). We believe that this observation can be understood by considering more closely the relationships between genes that interact antagonistically, versus synergistically. An antagonistic interaction implies that the phenotypic effect of deleting a gene is reduced in the absence of its interaction partner. A possible interpretation of this is that a gene's full function, as manifested in its associated phenotypic effect, is contingent on the presence of its antagonistic interaction partner. Therefore highly antagonistic genes are phenotypic hubs, whose evolutionary changes are constrained by the dependency of other genes upon them. Conversely, the reduced constraint on synergistic hubs can be understood by considering that a synergistic interaction between two genes implies that the phenotypic impact of deleting a gene is increased in the absence of its interaction partner. This can be interpreted as a gene's function being compensated for by its synergistic interaction partners. Therefore, the reduced correlation with evolutionary rate for synergistic hubs may reflect the fact that the phenotypic effect of changes in such hubs is dampened by the presence of their interaction partners.
Genes associated with human genetic disorders have higher epistatic connectivity
The implications of the current analysis are not limited to yeast. In fact, multi-phenotype epistatic interactions may be relevant to the manifestation and treatment of human disease. Given the previously discussed importance of multi-phenotype hub genes, it is likely that perturbations of these genes would have major effects in a biological network. Translating this observation to humans, we hypothesize that the disruption of more highly connected genes in the human metabolic network would be more likely to result in a disease state. We sought evidence for this by evaluating whether the epistatic connectivity of genes in the yeast model was predictive of the role of their human homologs in genetic diseases. Indeed, we observe a significant difference between the connectivity of yeast homologs of human genes that have been associated with a genetic disease, versus those that have not (Figure 8). While the statistical significance is limited due to the small sample size, this result provides support for the growing sentiment that majority of human genetic disorders are a consequence of complex interactions between numerous cellular components [1], [21].

Discussion
We described the systematic generation of epistatic interaction networks relative to all observable phenotypes in a genome-scale model of yeast metabolism. Analysis of these networks revealed that different metabolic flux phenotypes yield different sets of interactions, and that a large set of phenotypes is required to capture all interactions. The basis for these observations is that different metabolic flux phenotypes capture different aspects of gene function. This is likely a consequence of the complex wiring of metabolic networks, which include multiple branching pathways, shared pools of commonly used metabolites and a high level of interconnectedness between different metabolic processes: seemingly remote processes on the metabolic chart may nonlinearly affect a third readout process (the phenotype). Furthermore, because of this complexity, the relationships between different genes and processes may not be easily captured by straightforward patterns, as indicated by the observation that the same genes can interact synergistically relative to some phenotypes and antagonistically relative to others.
From a functional genomic perspective, the results imply that, in future studies of epistasis, the set of observed phenotypes could be selected so as to influence the set of interactions identified and to maximize insight into the functional organization of the biological process of interest. While the focus here has been on metabolism, this concept can be generalized to other types of biological networks. For instance, mRNA transcript levels may be the most appropriate phenotype to tease out the logic of transcriptional regulatory networks [37] and phosphorylation states the most relevant for signal transduction pathways. Furthermore, our results demonstrate that the particular mRNA levels or protein phosphorylation states monitored should depend on the particular regulatory module or transduction pathway of interest. An additional layer of complexity that has not yet been addressed here is the dependence of epistatic networks on environmental conditions. As hinted to before (Supplementary Figure 3 in [6]) epistatic networks will likely vary under different conditions. Hence, future extensions of the current work may explore the complexity and significance of environmental conditions as a fourth dimension in the epistatic matrix of Figure 1.
From an evolutionary perspective, we found that the number of epistatic interactions with respect to multiple metabolic flux phenotypes is strongly anti-correlated with the genes' evolutionary rates and expression levels. This anti-correlation is larger than found with the number of epistatic interactions relative to growth phenotype only. On the surface this result seems surprising, given that growth rate and fitness are often taken to be synonymous with one another, and genes that have a large impact on fitness would be expected to evolve slower. However, one must consider that growth in the model is based solely on the capacity to produce biomass components, while fitness in an organism's natural environment is assuredly more complex. An organism's success (in other words, its fitness) likely depends on the complex interplay of a multitude of biological properties, including the proportions and efficiency of resources utilized, the choice of secreted byproducts (which can influence the environment and the interactions with other species), and how fluxes are managed in the face of varying nutrient availability. Thus, the apparently reduced importance of the growth flux, and conversely, the increased importance of all metabolic phenotypes, may simply be reflective of the relative simplicity of growth in the model, when compared to the complexity of growth in the wild. More broadly, our results raise the possibility that the apparent robustness observed in the insulated environment of the laboratory may not translate to an organism's natural environment, where additional constraints exist with respect to not just how fast one grows, but the precise manner in which this is accomplished.
A potential limitation of past and present, computational and experimental studies of the evolutionary impact of epistasis may lie in the use of gene deletions as the mutation relative to which epistasis is detected. While gene deletion mutations have been effective in terms of uncovering functional dependencies and the evolutionary constraints imposed by these dependencies, left unanswered is the evolutionary impact of epistasis relative to smaller perturbations to gene function. It is these minor perturbations, such as those caused by amino acid substitutions or stochastic fluctuations in protein levels that the cell must constantly confront. If epistasis relative to these small perturbations is as ubiquitous as has been observed relative to gene deletions, this begs the question as to how the cell copes with the complexity of a large number of long-distance nonlinearities affecting virtually every metabolic function. While experimental studies have begun to address this question [38], perhaps computational frameworks such as flux balance analysis can be used to extend these analyses to the genome-scale. For flux balance analysis, or any computational framework, to adequately address this problem much work will have to be done to more fully understand the phenotypic consequences of small genetic perturbations.
While our current analysis is purely computational, we anticipate that xperimental measurements of interactions based on multiple metabolic phenotypes will be increasingly feasible and valuable in the near future. Our analysis provides predictions about the properties of multi-phenotype epistatic networks, in addition to a plethora of specific interaction predictions to which these future experiments can be compared (data downloadable at http://prelude.bu.edu/multi-phenotype-epistasis). Finally, being the first genome-scale analysis of multi-phenotype epistatic networks, we hope that the groundwork we have laid with respect to quantifying, discretizing and analyzing multi-phenotype epistatic interaction networks will aid future experimental and computational studies using similar approaches to help unravel the functional complexity of biological systems.
Materials and Methods
Flux balance analysis
To enable our study of multi-phenotype epistasis at a genome-scale we utilized flux balance models [24]. Specifically, to compute steady state reaction rates (the fluxes, vi) in deletion mutants, we used the iLL672 yeast stoichiometric reconstruction. Flux balance models take as input the stoichiometry of all known metabolic reactions in the modeled organism, along with possible constraints on flux ranges, and through a Linear Programming optimization step provide predictions of fluxes through each metabolic reaction. The complete stoichiometry of an organism is typically represented mathematically as the stoichiometric matrix, S. Each row i of the matrix S represents a metabolite, and each column j represents a reaction, with an entry Sij representing the stoichiometric coefficient of metabolite i in reaction j. The set of possible flux solutions is constrained by imposing a steady state assumption along with bounds on individual fluxes. The set of steady state solutions is described mathematically as the null space of the matrix S, and dictates that the production of each metabolite is equaled by its consumption. Bounds on individual fluxes are described by inequality constraints, and are used to model known limitations, such as nutrient availabilities, reaction reversibility and maintenance requirements. Constraints on nutrient limitation in the present study were set so as to mimic as closely as possible the media conditions from a recent study by Blank et al. [30]. This condition was selected since it allowed us to use experimental flux data from that study to perform more accurate flux predictions throughout our work (See below). Upon setting the linear constraints, a particular flux solution is typically computed by searching the optimal value of a given linear combination of the fluxes. Previously utilized optimization criteria are maximal ATP production [39], minimization of total flux [40], and the most commonly used maximization of biomass production [41]. Formally, this can be expressed as a Linear Programming (LP) problem:where cr is the coefficient of flux r in the objective function (r = 1, …, R, with R is the total number of reactions), and αj and βj are the upper and lower bounds on reaction j, respectively. Because of the nature of our study, accurate predictions for all individual fluxes are desirable. Hence, we wanted our flux predictions to match available experimental data as closely as possible. To this end we evaluated several optimization criteria for predicting fluxes in deletion mutants by comparing flux predictions to a previously released set of experimentally measured fluxes in yeast single deletion mutants [30] (see Text S1). Our evaluation demonstrated that the most accurate optimization criteria utilized the previously described Minimization of Metabolic Adjustment (MOMA) criteria [29], along with an experimentally constrained wild type solution [24]. In effect, this criterion assumes that upon a gene deletion, fluxes will undergo a minimal rearrangement, compatible with the flux constraints imposed by the gene deletion. We found that the performance of this approach is highly dependent on the accuracy of the wild-type solution from which the distance is minimized. Therefore the wild type fluxes were computed using the following LP optimization:where is the experimentally measured value for flux j, δ is a parameter that describes the stringency of the requirement (currently set to 0.10, as done previously [24]) and ε represents the error associated with the experimental measurement. This approach identifies, among all states compatible with the experimentally measured fluxes, the one with minimal overall flux. Mutant fluxes were computed by constraining to zero the flux through any reaction requiring the protein product of the deleted gene(s), and then identifying the flux solution with the minimal Manhattan distance from the wild type flux solution vWT. The optimization problem, which can be solved using LP, is formulated as follows:where represents the flux(es) requiring the protein product of gene gi. This approach for determining mutant fluxes has been described in detail elsewhere [24]. All LP calculations were performed using the software Xpress, under free academic license.
Filtering of genes used analyses
From the total set of genes present in the model, only a subset was used in our analyses. First, all essential genes were excluded, as by definition they cannot participate in any epistatic interactions when considering gene deletion mutations. Second, for genes assigned to complexes in the model, only a single representative gene from the complex was used. This was done because complexes are treated in a trivial way in the model, wherein removal of any gene in the complex is assumed to have the equivalent effect of disabling the complex. Finally, only genes whose deletion affected at least one metabolic flux relative to the wild-type were included. This filter was applied in response to the trivial way in which isozymes are treated in the model, wherein complete backup is assumed.
Calculation of epistatic interactions
The predicted fluxes for all single and double gene deletions can be represented as a three-dimensional matrix V, whose element Vijk indicates the normalized k-th flux for the deletion of genes i and j (single mutants being represented by the diagonal elements i = j). The three-dimensional matrix of epistatic interactions, E, is in turn defined by measuring how much the flux for each double mutant differs from expectation, based on the flux in the corresponding single mutants. Specifically, we define an element of E as Eijk = Vijk – F(Viik, Vjjk), where the specific shape of the function F is discussed in the next section. The element Eijk represents the interaction between genes i and j relative to the phenotype k. Two genes i and j were considered to have an epistatic interaction relative to phenotype k if |Eijk|>ssk, where sk denotes the standard deviation for the distribution Eijk values across all pairs (i,j). For assessing total interaction coverage and process interaction patterns a value of s = 1.0 was used, so as to provide a cleaner picture by retaining only the most high confidence interactions. For the evolutionary rate analysis, a value of s = 0.5 was used, as we deemed the inclusion of weaker interactions to be conceptually important here. Note that none of the major conclusions change with respect to varying of s (see Figures S5 and S10 for sensitivity analysis relative to s). Note that flux values were rounded to 5 digits after the decimal point, in order to avoid numerical errors associated with the optimization software.
Metrics of epistasis (shape of the function F)
To identify an appropriate metric for quantifying epistasis with respect to metabolic phenotypes, we evaluated two commonly used metrics, as well as a newly defined one. The two previously applied metrics correspond to a multiplicative definition and an additive definition of epistasis respectively. The multiplicative metric assumes that the expected wild-type-normalized phenotype (flux) change for the double mutant is the product of the corresponding changes for the two single mutants. The additive metric, on the other hand, assumes that the expected double mutant change is the sum of the two individual mutant changes (see Text S1 and reference [8] for details). The novel metric we developed is a Z-score based metric that quantifies the difference in the effect of a mutation in the wild type and mutant backgrounds (See Text S1 for details).
Classes of epistasis
All interactions were classified as either antagonistic or synergistic. In general, an interaction was deemed as antagonistic if the phenotype of the double mutant was less severe than expected based on a multiplicative definition and as synergistic if the double mutant phenotype was more severe than expected (See Text S1 for details).
Ka/Ks analysis
For our analysis of the relationship between the number of epistatic interactions associated with perturbed genes and the ratio of the rate of non-synonymous substitutions to the rate of synonymous substitutions (Ka/Ks), we computed the total number of synergistic and antagonistic interactions associated with 39 genes across 293 flux phenotypes. The 39 genes were selected on the basis of Ka/Ks data being available from a previous study [42]. Statistical tests were performed as described in figure legends. Partial correlation analysis was done to control for single mutant fitness defects, metabolic network connectivity and codon bias (See Figure S11).
Relationship between multi-phenotype epistasis and human disease
In order to assess the potential relevance of multi-phenotype epistasis to the manifestation of human disease the number of epistatic interactions was compared between yeast genes that have a human homolog in Online Mendelian Inheritance in Man (OMIM) database [43] and those genes that have a human homolog that is not in the OMIM database. Human homologs of yeast genes were determined based on the Kyoto Encyclopedia of Genes and Genomes [44]. The OMIM morbid map data set was downloaded on April 9th, 2009.
Supporting Information
Zdroje
1. PhillipsPC
2008 Epistasis - the essential role of gene interactions in the structure and evolution of genetic systems. Nat Rev Genet 9 855 867
2. GuarenteL
1993 Synthetic enhancement in gene interaction: a genetic tool come of age. Trends Genet 9 362 366
3. SteinA
AloyP
A molecular interpretation of genetic interactions in yeast. FEBS Lett. In Press, Uncorrected Proof. Available at: http://www.sciencedirect.com/science/article/B6T36-4RW9H0W-9/2/65bd6932e8a94989a5767a584ec5a47d. Accessed 25 February 2008
4. SchuldinerM
CollinsSR
ThompsonNJ
DenicV
BhamidipatiA
2005 Exploration of the Function and Organization of the Yeast Early Secretory Pathway through an Epistatic Miniarray Profile. Cell 123 507 519
5. YeP
PeyserBD
PanX
BoekeJD
SpencerFA
2005 Gene function prediction from congruent synthetic lethal interactions in yeast. Mol Syst Biol 1 Available at: http://dx.doi.org/10.1038/msb4100034. Accessed 4 December 2008
6. SegrèD
DelunaA
ChurchGM
KishonyR
2005 Modular epistasis in yeast metabolism. Nat Genet 37 77 83
7. CostanzoM
BaryshnikovaA
BellayJ
KimY
SpearED
2010 The Genetic Landscape of a Cell. Science 327 425 431
8. ManiR
St OngeRP
HartmanJL
GiaeverG
RothFP
2008 Defining genetic interaction. Proc Natl Acad Sci U S A 105 3461 3466
9. KondrashovAS
1994 Muller's ratchet under epistatic selection. Genetics 136 1469 73
10. MazurkiewiczP
TangCM
BooneC
HoldenDW
2006 Signature-tagged mutagenesis: barcoding mutants for genome-wide screens. Nat Rev Genet 7 929 939
11. DeutscherD
MeilijsonI
KupiecM
RuppinE
2006 Multiple knockout analysis of genetic robustness in the yeast metabolic network. Nat Genet 38 993 998
12. HarrisonR
PappB
PalC
OliverSG
DelneriD
2007 Plasticity of genetic interactions in metabolic networks of yeast. Proc Natl Acad Sci U S A 104 2307 12
13. YehP
TschumiAI
KishonyR
2006 Functional classification of drugs by properties of their pairwise interactions. Nat Genet 38 489 494
14. TongAHY
LesageG
BaderGD
DingH
XuH
2004 Global Mapping of the Yeast Genetic Interaction Network. Science 303 808 813
15. ParsonsAB
BrostRL
DingH
LiZ
ZhangC
2004 Integration of chemical-genetic and genetic interaction data links bioactive compounds to cellular target pathways. Nat Biotechnol 22 62 69
16. ChaitR
CraneyA
KishonyR
2007 Antibiotic interactions that select against resistance. Nature 446 668 671
17. ElenaSF
LenskiRE
1997 Test of synergistic interactions among deleterious mutations in bacteria. Nature 390 395 398
18. JasnosL
KoronaR
2007 Epistatic buffering of fitness loss in yeast double deletion strains. Nat Genet 39 550 554
19. BremRB
StoreyJD
WhittleJ
KruglyakL
2005 Genetic interactions between polymorphisms that affect gene expression in yeast. Nature 436 701 703
20. St. OngeRP
ManiR
OhJ
ProctorM
FungE
2007 Systematic pathway analysis using high-resolution fitness profiling of combinatorial gene deletions. Nat Genet 39 199 206
21. CarlborgO
HaleyCS
2004 Epistasis: too often neglected in complex trait studies? Nat Rev Genet 5 618 625
22. CordellHJ
2009 Detecting gene-gene interactions that underlie human diseases. Nat Rev Genet 10 392 404
23. MooreJH
WilliamsSM
2009 Epistasis and Its Implications for Personal Genetics. Am J Hum Genet 85 309 320
24. KuepferL
SauerU
BlankLM
2005 Metabolic functions of duplicate genes in Saccharomyces cerevisiae. Genome Res 15 1421 1430
25. FörsterJ
FamiliI
PalssonBO
NielsenJ
2003 Large-scale evaluation of in silico gene deletions in Saccharomyces cerevisiae. OMICS 7 193 202
26. SnitkinE
DudleyA
JanseD
WongK
ChurchG
2008 Model-driven analysis of experimentally determined growth phenotypes for 465 yeast gene deletion mutants under 16 different conditions. Genome Biol 9 R140
27. DuarteNC
HerrgardMJ
PalssonBO
2004 Reconstruction and Validation of Saccharomyces cerevisiae iND750, a Fully Compartmentalized Genome-Scale Metabolic Model. Genome Res 14 1298 1309
28. HarrisonR
PappB
PalC
OliverSG
DelneriD
2007 Plasticity of genetic interactions in metabolic networks of yeast. Proc Natl Acad Sci U S A 104 2307 2312
29. SegrèD
VitkupD
ChurchGM
2002 Analysis of optimality in natural and perturbed metabolic networks. Proc Natl Acad Sci U S A 99 15112 15117
30. BlankL
KuepferL
SauerU
2005 Large-scale 13C-flux analysis reveals mechanistic principles of metabolic network robustness to null mutations in yeast. Genome Biol 6 R49
31. SnitkinES
SegrèD
2008 Optimality criteria for the prediction of metabolic fluxes in yeast mutants. Genome Informatics 2008 - Proceedings of the 8th Annual International Workshop on Bioinformatics and Systems Biology (IBSB 2008). Zeuten Lake, Berlin, Germany: 123 134 Available at: http://eproceedings.worldscinet.com/9781848163003/9781848163003_0011.html. Accessed 13 January 2010
32. WolfJB
BrodieED
WadeMJ
2000 Epistasis and the Evolutionary Process
33. OteroJ
OlssonL
NielsenJ
2008 Industrial Systems Biology of Saccharomyces cerecisiae: Succinic Acid Production, International Conference on Systems Biology
34. NissenTL
Kielland-BrandtMC
NielsenJ
VilladsenJ
2000 Optimization of Ethanol Production in Saccharomyces cerevisiae by Metabolic Engineering of the Ammonium Assimilation. Metab Eng 2 69 77
35. DrummondDA
RavalA
WilkeCO
2006 A Single Determinant Dominates the Rate of Yeast Protein Evolution. Mol Biol Evol 23 327 337
36. DrummondDA
BloomJD
AdamiC
WilkeCO
ArnoldFH
2005 Why highly expressed proteins evolve slowly. Proc Natl Acad Sci U S A 102 14338 14343
37. BojSF
PetrovD
FerrerJ
2010 Epistasis of Transcriptomes Reveals Synergism between Transcriptional Activators Hnf1α and Hnf4α. PLoS Genet 6 e1000970 doi:10.1371/journal.pgen.1000970
38. LunzerM
GoldingGB
DeanAM
2010 Pervasive Cryptic Epistasis in Molecular Evolution. PLoS Genet 6 e1001162 doi:10.1371/journal.pgen.1001162
39. RamakrishnaR
EdwardsJS
McCullochA
PalssonBO
2001 Flux-balance analysis of mitochondrial energy metabolism: consequences of systemic stoichiometric constraints. Am J Physiol Regul Integr Comp Physiol 280 R695 704
40. HolzhütterH
2004 the Principle of Flux Minimization and Its Application to Estimate Stationary Fluxes in Metabolic Networks. Eur J Biochem 271 2905 2922
41. EdwardsJS
IbarraRU
PalssonBO
2001 In silico predictions of Escherichia coli metabolic capabilities are consistent with experimental data. Nat Biotechnol 19 125 130
42. WallDP
HirshAE
FraserHB
KummJ
GiaeverG
2005 Functional genomic analysis of the rates of protein evolution. Proc Natl Acad Sci U S A 102 5483 5488
43. McKusickVA
2007 Mendelian Inheritance in Man and Its Online Version, OMIM. Am J Hum Genet 80 588 604
44. KanehisaM
GotoS
2000 KEGG: kyoto encyclopedia of genes and genomes. Nucleic Acids Res 28 27 30
Štítky
Genetika Reprodukční medicínaČlánek vyšel v časopise
PLOS Genetics
2011 Číslo 2
- Kazuistika – Perspektivy využití precizované medicíny v rámci personalizované specifické terapie onkologických pacientů
- Nobelova cena za chemii pro genetické nůžky: Objev, který změní naši budoucnost?
- Technologie na bázi RNA v klinické praxi: od přebarvených petúnií k terapii vzácných a dosud jen obtížně léčitelných chorob u lidí
- „Nepředstavovali jsme si, že náš výzkum povede přímo ke vzniku nových léků, dokonce ještě za našeho života“
- Bezplatné služby pro diagnostiku ATTRv amyloidózy pro kardiology
Nejčtenější v tomto čísle
- Meta-Analysis of Genome-Wide Association Studies in Celiac Disease and Rheumatoid Arthritis Identifies Fourteen Non-HLA Shared Loci
- MiRNA Control of Vegetative Phase Change in Trees
- Risk Alleles for Systemic Lupus Erythematosus in a Large Case-Control Collection and Associations with Clinical Subphenotypes
- The Cardiac Transcription Network Modulated by Gata4, Mef2a, Nkx2.5, Srf, Histone Modifications, and MicroRNAs
Zvyšte si kvalifikaci online z pohodlí domova
Mazová zátka a její řešení
nový kurzVšechny kurzy