
Genome-Wide Association Study of Lp-PLA Activity and Mass in the Framingham Heart Study
Lipoprotein-associated phospholipase A2 (Lp-PLA2) is an emerging risk factor and therapeutic target for cardiovascular disease. The activity and mass of this enzyme are heritable traits, but major genetic determinants have not been explored in a systematic, genome-wide fashion. We carried out a genome-wide association study of Lp-PLA2 activity and mass in 6,668 Caucasian subjects from the population-based Framingham Heart Study. Clinical data and genotypes from the Affymetrix 550K SNP array were obtained from the open-access Framingham SHARe project. Each polymorphism that passed quality control was tested for associations with Lp-PLA2 activity and mass using linear mixed models implemented in the R statistical package, accounting for familial correlations, and controlling for age, sex, smoking, lipid-lowering-medication use, and cohort. For Lp-PLA2 activity, polymorphisms at four independent loci reached genome-wide significance, including the APOE/APOC1 region on chromosome 19 (p = 6×10⁻²⁴); CELSR2/PSRC1 on chromosome 1 (p = 3×10⁻¹⁵); SCARB1 on chromosome 12 (p = 1×10⁻⁸) and ZNF259/BUD13 in the APOA5/APOA1 gene region on chromosome 11 (p = 4×10⁻⁸). All of these remained significant after accounting for associations with LDL cholesterol, HDL cholesterol, or triglycerides. For Lp-PLA2 mass, 12 SNPs achieved genome-wide significance, all clustering in a region on chromosome 6p12.3 near the PLA2G7 gene. Our analyses demonstrate that genetic polymorphisms may contribute to inter-individual variation in Lp-PLA2 activity and mass.
Published in the journal:
. PLoS Genet 6(4): e32767. doi:10.1371/journal.pgen.1000928
Category:
Research Article
doi:
https://doi.org/10.1371/journal.pgen.1000928
Summary
Lipoprotein-associated phospholipase A2 (Lp-PLA2) is an emerging risk factor and therapeutic target for cardiovascular disease. The activity and mass of this enzyme are heritable traits, but major genetic determinants have not been explored in a systematic, genome-wide fashion. We carried out a genome-wide association study of Lp-PLA2 activity and mass in 6,668 Caucasian subjects from the population-based Framingham Heart Study. Clinical data and genotypes from the Affymetrix 550K SNP array were obtained from the open-access Framingham SHARe project. Each polymorphism that passed quality control was tested for associations with Lp-PLA2 activity and mass using linear mixed models implemented in the R statistical package, accounting for familial correlations, and controlling for age, sex, smoking, lipid-lowering-medication use, and cohort. For Lp-PLA2 activity, polymorphisms at four independent loci reached genome-wide significance, including the APOE/APOC1 region on chromosome 19 (p = 6×10⁻²⁴); CELSR2/PSRC1 on chromosome 1 (p = 3×10⁻¹⁵); SCARB1 on chromosome 12 (p = 1×10⁻⁸) and ZNF259/BUD13 in the APOA5/APOA1 gene region on chromosome 11 (p = 4×10⁻⁸). All of these remained significant after accounting for associations with LDL cholesterol, HDL cholesterol, or triglycerides. For Lp-PLA2 mass, 12 SNPs achieved genome-wide significance, all clustering in a region on chromosome 6p12.3 near the PLA2G7 gene. Our analyses demonstrate that genetic polymorphisms may contribute to inter-individual variation in Lp-PLA2 activity and mass.
Introduction
It is increasingly recognized that inflammation plays an important role in the development of atherosclerotic cardiovascular disease. Among the most studied circulating biomarkers of inflammation in this setting is lipoprotein-associated phospholipase A2 (Lp-PLA2). Studies in animal models with human-like lipoprotein metabolism have suggested that Lp-PLA2 activity contributes to atherosclerosis development, and epidemiological studies have presented evidence that circulating concentrations of Lp-PLA2 or elevated activity of the enzyme are associated with cardiovascular disease after adjusting for established risk factors [1]–[3]. This has led to the recent development of an orally active Lp-PLA2 inhibitor currently in clinical trials for cardiovascular prevention [3].
Lp-PLA2, also known as platelet-activating factor acetylhydrolase (PAF-AH), is produced by cells of hematopoietic lineage (monocytes/macrophages, T-lymphocytes, mast cells, megakaryocytes and platelets). The enzyme reacts with oxidized phospholipids to generate the pro-inflammatory lipids lysophosphatidylcholine and oxidized free fatty acids. The relationship between Lp-PLA2 and atherosclerosis is complex. Lp-PLA2 is non-covalently bound to human plasma lipoproteins; the binding site on the Lp-PLA2 molecule differs according to whether the carrier lipoprotein is LDL or HDL [4]. Most Lp-PLA2 is bound to LDL, and subjects with elevated plasma LDL levels also have high Lp-PLA2 activity [5]. In epidemiologic studies, Lp-PLA2 activity and mass reflect predominantly LDL-associated Lp-PLA2 [6]. Importantly, Lp-PLA2 is highly associated with the smallest LDL and HDL subclasses [7] and with electronegative LDL, which overlaps with small dense LDL [8]. Lp-PLA2 bound to HDL has a much lower specific activity than that bound to LDL [6]. Despite the fact that HDL carries some of the Lp-PLA2 activity in plasma, we and others have found an inverse relationship between Lp-PLA2 activity and HDL levels [9]. This is likely explained by the fact that small dense LDL (with high Lp-PLA2 activity) are more abundant in subjects with lower levels of HDL. Small dense LDL are also found in the metabolic syndrome, which is associated with high Lp-PLA2 activity [10].
Given the importance of Lp-PLA2 as a biomarker of cardiovascular disease pathogenesis and the development of therapeutics directed at Lp-PLA2, a better understanding of how genetic variation controls Lp-PLA2 activity and mass is warranted. Pursuant to this goal, Schnabel et al. estimated the heritabilities of Lp-PLA2 activity and mass to be 0.41 and 0.25, respectively, in the Framingham Heart Study, which is consistent with estimates from other cohorts [11], [12]. They also conducted a large-scale analysis of candidate genes, focusing on variants in PLA2G7, the gene that encodes Lp-PLA2, and other SNPs in inflammatory genes [11]. Their study identified variants of potential interest, but they noted that no SNPs achieved experiment-wide statistical significance. In the present study, we conducted a genome-wide association study (GWAS) to identify additional candidate genes that emerge on a genome-wide scale. Using genotype and clinical data available on participants in the Framingham Heart Study, we carried out an analysis of common genetic variants across the genome to identify loci associated with Lp-PLA2 activity and mass. For Lp-PLA2 activity, our study revealed four genomic regions reaching genome-wide significance, all harboring genes involved in lipid metabolism. For Lp-PLA2 mass, the only associated locus was a region harboring PLA2G7, the gene that encodes Lp-PLA2.
Results
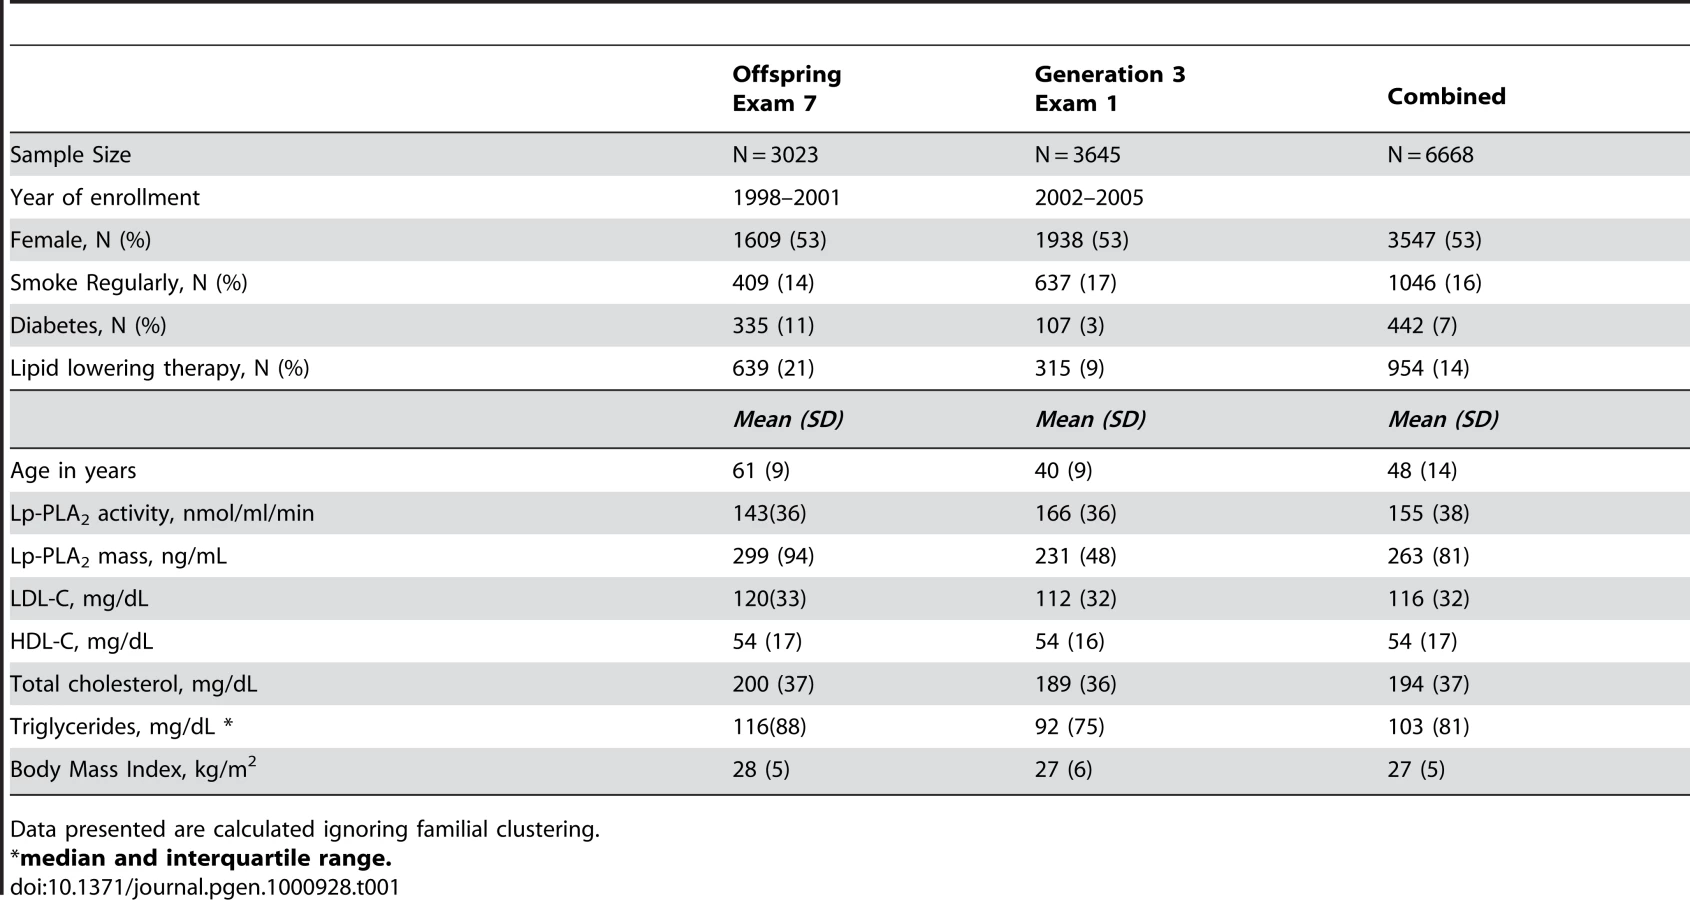
Table 1 displays clinical characteristics of the population under study. The Third Generation cohort is younger and has a more favorable lipid profile as compared to the Offspring cohort. It also has higher Lp-PLA2 activity, but the variance within each cohort is similar. Graphical summaries of the genome-wide associations with Lp-PLA2 activity (Figure 1 and Figure 2) and mass (Figure 3 and Figure 4) are displayed using a quantile-quantile (Q-Q) plot and a Manhattan plot. The Q-Q plot for each phenotype reveals a clear departure from the overall-null hypothesis of no associations. The corresponding Manhattan plots present an alternative view showing the separation of top hits among the genome-wide associations. The test statistics that generated these summaries do not display evidence of inflation (inflation factors = 1.007 and 0.998) and hence, we did not adjust for population structure. Results for all SNPs tested can be found in Table S1 (activity) and Table S2 (mass).

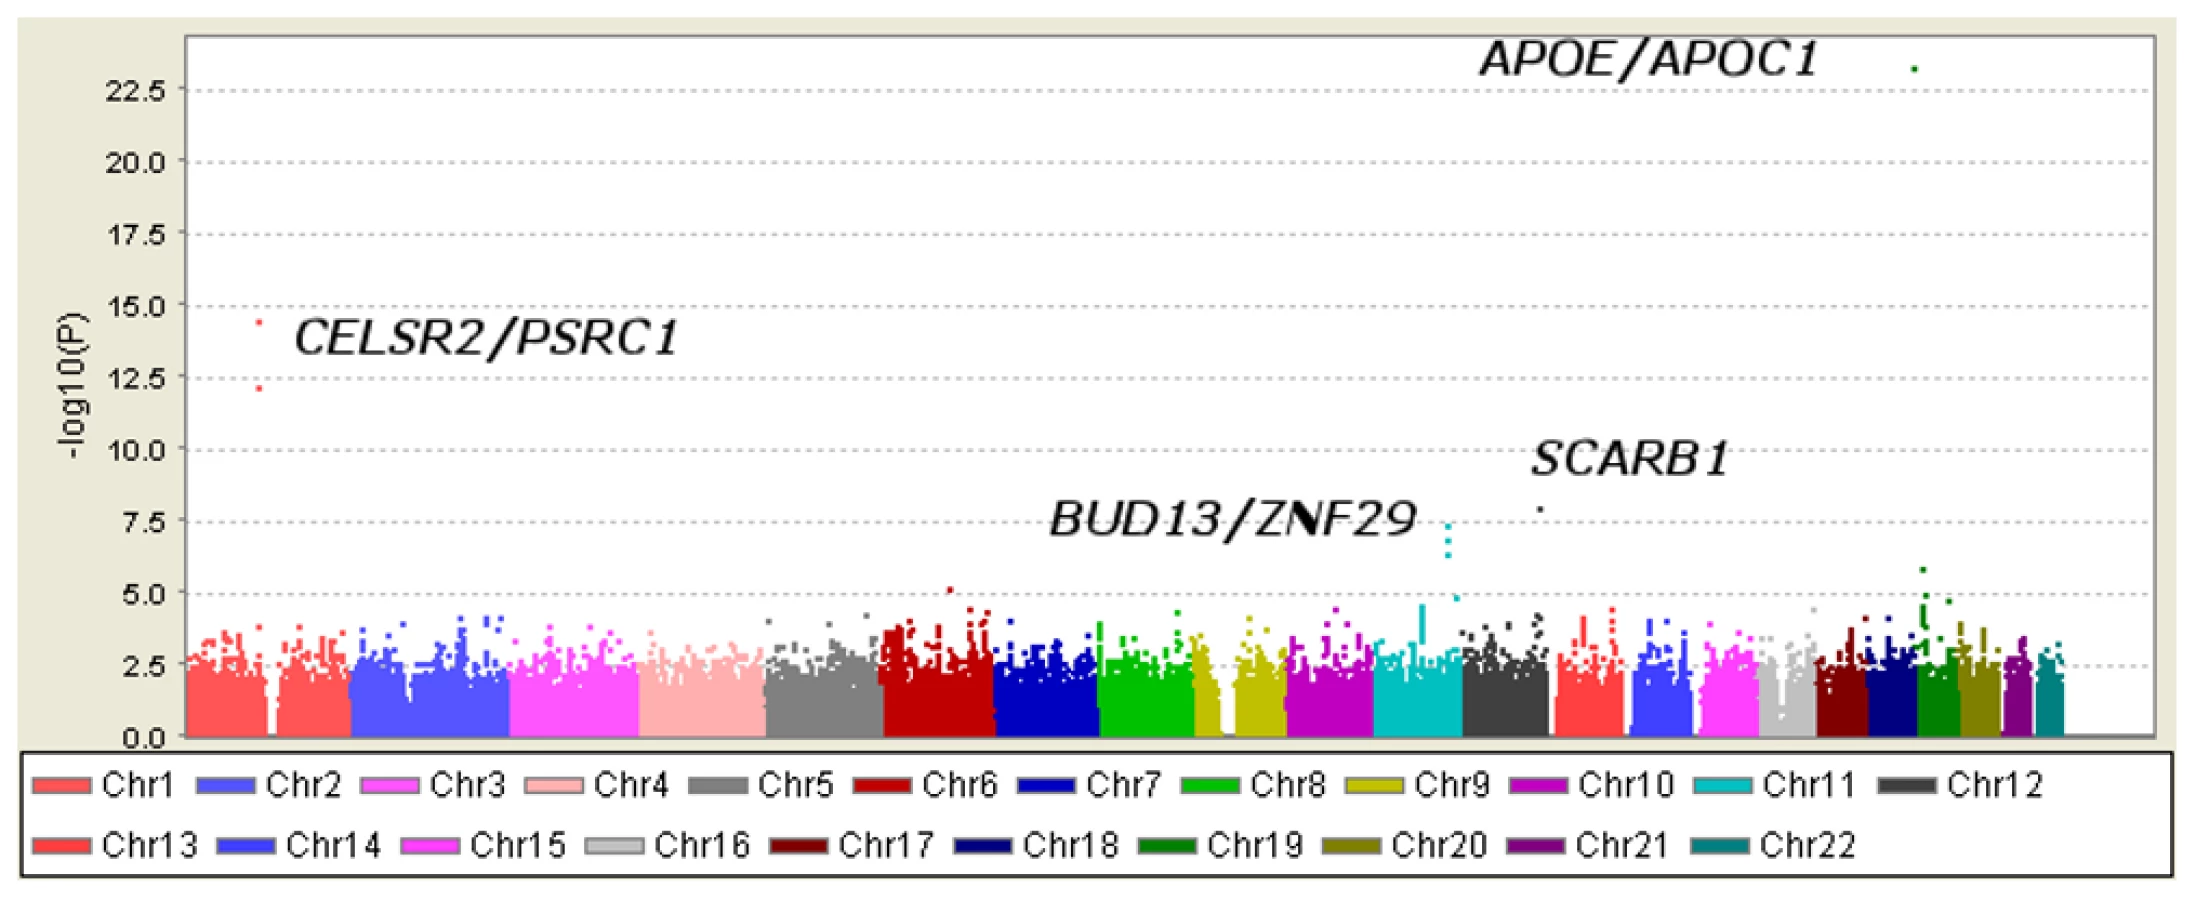


Loci achieving genome-wide significance for association with Lp-PLA2 activity
Six SNPs in four distinct loci were associated with Lp-PLA2 activity at a genome-wide level of significance in a model controlling for age, age2, sex, cohort, lipid-lowering-medication use, and smoking (Table 2). The top hit was the SNP ss66185226 (rs41377151), which is identical to the SNP rs4420638. This SNP is located approximately 340 bp from the 3′ end of the apolipoprotein C-I (APOC1) gene within the APOE/APOC1 gene cluster on chromosome 19q13.32 (Figure 5). Two other SNPs – rs599839, located 10 bp downstream of PSRC1 and rs4970834, located in an intron of CELSR2 – are in moderate linkage disequilibrium (r2 = 0.63) with each other and represent a second locus that maps to chromosome 1p13.3, which includes the genes PSRC1, CELSR2, and SORT1. The fourth hit, rs10846744, lies within an intron of SCARB1 on chromosome 12q24.31. The final two hits, rs12286037 and rs11820589, are in high linkage disequilibrium (r2 = 0.85), and map to 11q23.3. rs12286037 lies within an intron of the gene ZNF259, and rs11820589 resides within the BUD13 gene. Both SNPs are nearby an apolipoprotein gene cluster containing APOA5, APOA4, APOC3 and APOA1. All tested SNPs and their p-values can be found in Table S1.


In considering how much phenotypic variation can be explained by the top hits, the mixed model presents some challenges. A measure equivalent to R2 does not exist because phenotypic variation is partitioned into two variance components: an additive polygenic component and residual error. To estimate the impact that the top activity loci had on explaining the variance of this trait, we compared models with and without our top SNPs and found that adding the associated SNPs decreased the polygenic variance by 4.7% and the residual variance by 3.1%.
Loci achieving genome-wide significance for association with Lp-PLA2 mass
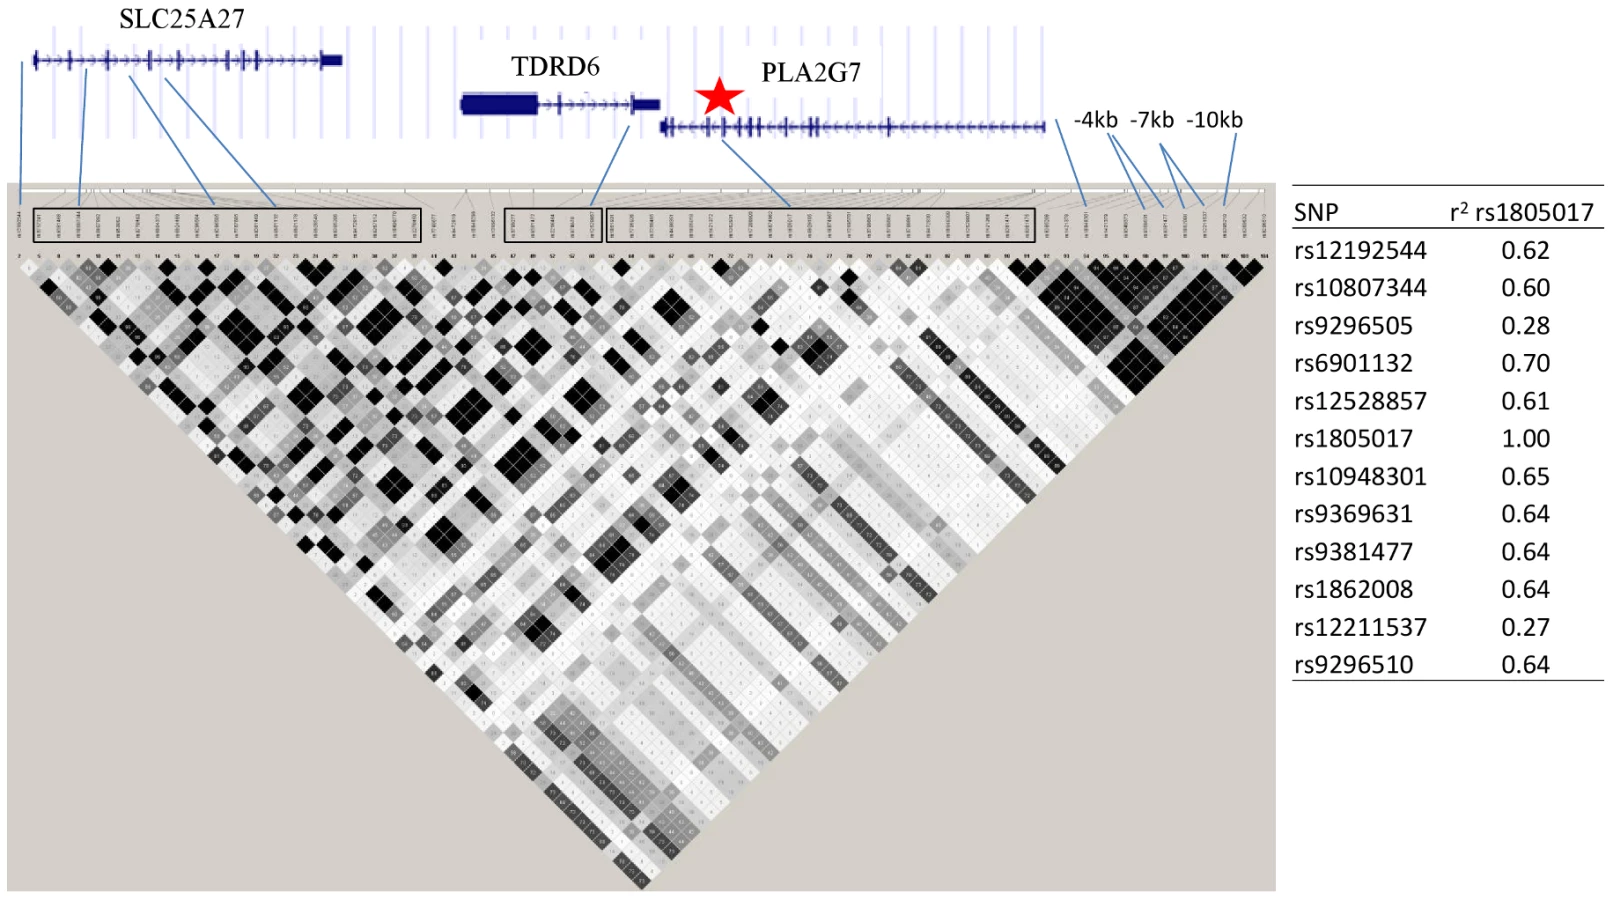
Twelve SNPs clustered in a region of chromosome 6p12.3 were associated with Lp-PLA2 mass at a genome-wide level of significance (Figure 6). The top hit, rs1805017, is a non-synonymous change (H92R) within the PLA2G7 gene, encoding lipoprotein-associated phospholipase A2. The T allele (corresponding to the amino acid histidine) was associated with higher Lp-PLA2 mass. A closer evaluation of this region suggests that linkage disequilibrium with the top SNP, rs1805017, is driving the remaining associations in this region.
Analyses of Lp-PLA2 activity, conditioning on mass, and vice versa
We observed that the top hits for Lp-PLA2 activity and mass did not overlap. The correlation between activity and mass in the sample (ignoring familial clustering) was 0.27, so these phenotypes are not expected to carry the same information. However, the top mass SNP, rs1805017, was weakly associated with Lp-PLA2 activity (p = 1.5×10⁻³), so we investigated whether the activity association could be explained by this SNP's association with Lp-PLA2 mass by including mass as a covariate. Instead, including Lp-PLA2 mass in the model considerably strengthened the association of this SNP with activity (Table 3, p = 2.1×10⁻¹²).

Because we observed this notable shift in p-values, we repeated our genome-wide association analyses, modeling SNP associations with Lp-PLA2 activity while controlling for Lp-PLA2 mass, and vice versa (Table 3). For Lp-PLA2 mass, the top hits in the PLA2G7 gene region remained the same, but all p-values became more significant. In addition, two other SNPs in this region, rs1421378 (p = 1×10⁻¹¹) and rs6458511 (p = 8×10⁻⁹), became significant. We also noted that SNPs near the APOB gene at 2p24.1 now approached genome-wide significance (p∼4×10⁻⁷) for their association with mass.
For analysis of Lp-PLA2 activity, controlling for mass uncovered significant associations with two SNPs in linkage disequilibrium with each other (r2 = 0.70) at the PLA2G7 locus: rs1805017(estimated effect: −4.2, p = 1×10⁻¹²) and rs6901132 (p = 5×10⁻⁹). The T allele of rs1805017 (histidine), associated with increased mass in our analysis, was associated with decreased activity. Controlling for mass also strengthened the association at the APOE/APOC1 locus (p = 1.5×10⁻²⁸) and weakened the association at the SCARB1 locus (p = 1.5×10⁻⁵). We quantified the amount of variance in activity explained by the rs1805017 SNP along with the SNPs previously associated with activity, in a model that included mass as well. As before, we compared models with and without the genetic variants and found that adding these six SNPs decreased the polygenic variance by 9.4% and the residual variance by 1.7%. For Lp-PLA2 mass, including rs1805017 decreases the polygenic variance by 12.2% and increases the residual variance by 0.28%.
Relationship between top Lp-PLA2 activity loci and serum lipid/lipoprotein levels
All four loci associated with Lp-PLA2 activity have generated strong signals in previous association studies for lipid phenotypes and include genes with established roles in lipid metabolism. Therefore, interpreting the results requires understanding the relationship between Lp-PLA2 activity and lipid/lipoprotein levels. Figure 7 displays scatter plots (ignoring familial clustering) of Lp-PLA2 activity with LDL-C (r = 0.44), HDL-C (r = −0.48), and triglycerides (log-transformed, r = 0.13). The linear trend and moderate sample correlations with LDL-C and HDL-C imply that markers associated with these lipoproteins may also be associated with Lp-PLA2 activity to some extent. Indeed, both the APOE/APOC1 locus and the CELSR2/PSRC1 locus have demonstrated strong signals in genome-wide association studies of LDL-C [13]. Both loci were significantly associated with LDL-C in the present study as well (Table 2), as previously reported [14]. In addition, the APOE/APOC1 locus was weakly associated with HDL-C. We also confirmed the ZNF259/BUD13 locus association with HDL-C and triglyceride levels as reported in genome-wide association studies, including the Framingham Heart Study [14]. SCARB1 polymorphisms have been associated with HDL-C, triglycerides, and LDL-C in candidate-gene studies [15]–[22], but not in genome-wide association studies. In the current study, however, the SCARB1 SNP was not associated with any of these lipids/lipoproteins.

Analysis of top SNP effects on Lp-PLA2 activity controlling for lipids/lipoproteins
Because the top SNPs for Lp-PLA2 activity were in gene regions known to associate with lipoprotein levels, we next asked whether these SNPs remained significantly associated with Lp-PLA2 activity beyond their reported association with serum lipids/lipoproteins. For each SNP, we added LDL-C, HDL-C, or triglycerides as a covariate to the original regression model. The association between SNPs at the CELSR2/PSRC1 locus and Lp-PLA2 activity was substantially reduced in a model accounting for their association with LDL-C, but not eliminated (Table 4). In contrast, the APOE/APOC1 locus remained strongly associated with Lp-PLA2 activity, even after accounting for its association with LDL-C and HDL-C. Similarly, when modeling the association between Lp-PLA2 activity and the SNPs at the ZNF259/BUD13 locus, including triglycerides or HDL-C as covariates did not appreciably reduce the association. SCARB1 was not evaluated since the SNP showed no association with lipoproteins in this study. Similarly, we did not further evaluate the PLA2G7 SNP, with respect to mass or activity, because it was not associated with any lipoproteins.

Analysis of top activity SNPs associated with apolipoprotein levels
Because our top loci all encompassed genes related to lipid metabolism, and yet their association with lipid or lipoprotein levels could not account for their association with Lp-PLA2 activity, we considered whether the effect of the SNPs was mediated through some other factor. Some of our top hits are in regions harboring apolipoprotein genes, so we examined the association of our top loci with levels of apolipoproteins A1, B, and E (measured only in the Offspring cohort). In addition, we expect Lp-PLA2 activity to correlate with apolipoprotein B levels. The CELSR2/PSRC1 and APOE/APOC1 SNPs were strongly associated with apolipoprotein B levels, and the APOE/APOC1 SNP was also very strongly associated with apolipoprotein E levels (Table 2). None of our top SNPs were associated with apolipoprotein A1 levels. We were unable to further investigate the relationships between associated SNPs, apolipoprotein levels, and Lp-PLA2 activity because the apolipoproteins were measured at different exams than Lp-PLA2 activity.
Discussion
To gain insight into genetic variants that control Lp-PLA2 activity and mass, we conducted a genome-wide association study using data from the Framingham Heart Study released through the SHARe Project. We identified different loci associated with each trait: four loci associated with Lp-PLA2 activity and one associated with Lp-PLA2 mass. Variants in the region of PLA2G7, encoding lipoprotein-associated phospholipase A2, were associated with Lp-PLA2 mass, the strongest association being with a common non-synonymous change, H92R. The four loci associated with Lp-PLA2 activity all harbor genes previously associated with lipoprotein levels and known to be involved in lipid metabolism. However, all of these loci remained significantly associated with Lp-PLA2 activity after accounting for their association with serum lipid and lipoprotein levels. Interestingly, a fifth activity locus, PLA2G7, emerges as significant only after controlling for mass.
Ours is not the first study to examine genetic variants associated with Lp-PLA2 activity and mass; however, it is the first to do so on a genome-wide level. A limited number of SNPs in PLA2G7, encoding lipoprotein-associated phospholipase A2, have been examined for association with Lp-PLA2 activity or mass. A common non-synonymous change, rs1051931 (A379V), was examined in several studies and found to be associated with activity [11], [23]–[25]. Abuzeid et al. [26] reported this same SNP associated with mass. According to Hapmap data, this SNP is not in linkage disequilibrium with our top SNP, rs1805017 (r2 = 0.07). A second common, non-synonymous European variant, rs1805018 (I198T), was associated with activity in Chinese population [27]. rs1805018 is not in linkage disequilibrium with either rs1051931 or rs1805017 (r2 = 0.02 for both). Neither the A379V nor I198T locus was associated with Lp-PLA2 activity (p = 1×10⁻⁴ and p = 0.8, respectively) or mass (p = 0.2 and p = 0.007) at a genome-wide level of significance in our study. Our top SNP associated with mass was also a common non-synonymous variant (H92R) in PLA2G7, and has not previously been associated with Lp-PLA2 activity or mass, but has been associated with coronary artery disease [28]. It is not clear whether the H92R change is the causal variant at this locus, or a marker of the causal variant. However, taken together with the other literature, our results suggest that the non-synonymous variants at this locus deserve further attention.
Our top locus for Lp-PLA2 activity, the APOE/APOC1 region, has been previously reported by others. A candidate-gene study conducted by Drenos and colleagues examined the APOE/APOC1 gene cluster for associations with multiple markers of cardiovascular disease and found a strong association with Lp-PLA2 activity as well as total cholesterol, LDL cholesterol, apolipoprotein B, and C-reactive protein [29]. Thus, our study provides further evidence for this candidate-region association and also implicates the APOE/APOC1 gene cluster as the strongest locus associated with Lp-PLA2 activity on a genome-wide level. Interestingly, the rs4420638 SNP associated with Lp-PLA2 activity in our study has also been associated with LDL-C, Alzheimer's disease, and C-reactive protein in other genome-wide association studies [13], [30]–[32]. Each copy of the rs4420638 minor allele, G, was associated with increasing Lp-PLA2 Activity. Based on patterns of linkage disequilibrium with the APOE e2/e3/e4 genotypes, we would expect that carriers of the APOE e4 allele would have increased Lp-PLA2 activity compared to those with either the e2 or e3 alleles. In addition, we found a highly significant association between the rs4420638 SNP and apolipoprotein E levels. Whether these associations are causally related or represent pleiotropic effects of this locus remains to be determined. Early work on Lp-PLA2 suggested that it may be carried specifically on apolipoprotein E-containing HDL, and this may bear further investigation [33].
This is the first reported association between SNPs in the gene regions of SCARB1, ZNF259/BUD13, and CELSR2/PSRC1 with Lp-PLA2 activity. Although the identity of each causal genetic variant and its target gene remains to be discovered, plausible candidates can be found at each locus. SCARB1 encodes the scavenger receptor class B type 1 (SR-BI), and is well-recognized as an HDL receptor involved in reverse cholesterol transport. Despite the well-established role of this gene in lipid metabolism, to date genome-wide association studies, including those conducted with the Framingham Study, have not identified any genetic variants of SCARB1 significantly associated with serum lipid levels (http://genome.gov/gwastudies/). However, recent studies have ascribed additional function to this receptor in regulating inflammatory responses. In particular, in a mouse model of sepsis, macrophages from SR-BI-null mice have been shown to produce significantly higher levels of inflammatory cytokines than those of wild type controls in response to LPS [34]. A recent study found that SCARB1 rs10846744, associated with Lp-PLA2 activity in our study, was associated with subclinical atherosclerosis in the Multi-ethnic Study of Atherosclerosis [35]. The association was independent of lipoprotein levels and other metabolic risk factors. Given our findings, it is plausible that the association of SCARB1 SNPs with cardiovascular disease in their study could be mediated through the inflammatory effects of SCARB1. The second locus associated with Lp-PLA2 activity in our study is in the ZNF259/BUD13 region, which includes the apolipoprotein genes APOA5, APOA4, APOC3, and APOA1. This locus has been implicated in the control of serum triglyceride levels and increased coronary artery disease risk in a genome-wide association study [36]. APOA1 encodes apolipoprotein A1, which resides on HDL, interacts with SR-BI, and has anti-inflammatory properties [37], [38] The last locus contains three genes, SORT1, PSRC1 and CELSR2, which are relatively unexplored aside from their association with LDL cholesterol in numerous genome-wide association studies [13], [14], [36], [39]–[42]. Recent studies suggest that the associated SNP at this locus controls mRNA expression of the SORT1 gene encoding sortilin 1 [13], [43].
Lp-PLA2 is noncovalently bound to human plasma LDL and HDL and the interaction with these lipoproteins largely determines its physiological activity [4], [44]. The majority of Lp-PLA2 in humans is bound to LDL, and subjects with elevated plasma LDL cholesterol levels also have high Lp-PLA2 activity [5]. Thus, the finding in our study that SNPs associated with serum lipoprotein levels (specifically those associated with LDL cholesterol levels) are also associated with Lp-PLA2 activity is not surprising. However, the associations between these SNPs and Lp-PLA2 activity could not be entirely accounted for by their associations with serum lipid/lipoprotein levels. Moreover, it is interesting to note that other known genetic determinants of LDL cholesterol levels, such as SNPs at the APOB locus are not significantly associated with Lp-PLA2 activity in our study. The ZNF259/BUD13 locus is more strongly associated with triglycerides than LDL cholesterol in prior genome-wide association studies and in the present study. This result is consistent with the high Lp-PLA2 activity found associated with small dense LDL, since hypertriglyceridemia shifts the distribution of LDL toward smaller particle sizes [45]. Finally, SCARB1 has not been associated with serum lipoprotein levels in any genome-wide association study or in the present study. Therefore, while lipid metabolism genes in general are rational candidates due to the physical association of Lp-PLA2 with LDL and HDL, the exact loci contributing to variation in Lp-PLA2 activity found in our study may provide further insight into the relationship between Lp-PLA2 activity and lipoproteins.
Our study was carried out in the population-based Framingham Heart Study, considered by some to be the gold standard for cardiovascular-disease-related biomarker discovery and validation [46]. Nonetheless, there are some caveats to note. First, quality-control procedures for the genotype data removed a large number of SNPs. It is possible that additional loci influencing Lp-PLA2 activity and mass exist, but were not evaluated in our analysis. Second, it is possible that the reported associations arise from confounding by lipoprotein subspecies or inflammatory indices not measured in the current study. We were able to explore this systematically for HDL-C, LDL-C, and triglycerides. However, within the Offspring cohort, Lp-PLA2 activity was measured at a different exam than apolipoprotein levels, limiting our ability to properly assess potential confounding by apolipoproteins. Finally, it would also have been informative to examine not just total Lp-PLA2 measures, but Lp-PLA2 by lipoprotein class and subclass, or indices of production by specific cell types, but these data were not available.
In summary, we report the first genome-wide analysis for SNPs associated with Lp-PLA2 activity and mass. For Lp-PLA2 activity, SNPs in the APOE/APOC1 region, a region previously reported in a candidate-gene study, emerged as the top hit on a genome-wide scale. This same locus has been associated with apolipoprotein E levels, LDL cholesterol levels, inflammatory traits, and cardiovascular-disease outcomes. Future studies should be carried out to determine if this locus is pleiotropic, or if it controls a mediator related to both apolipoprotein E levels and Lp-PLA2 activity. Three other loci associated with lipoprotein phenotypes were also highly associated with Lp-PLA2 activity beyond their association with serum lipid levels. Our study also confirmed the importance of variants of the PLA2G7 gene in determining Lp-PLA2 mass. Lp-PLA2 is an inflammatory marker that has been implicated in the progression of atherosclerosis, and clinical trials of Lp-PLA2 inhibitors are currently in progress. Knowledge of genetic variation that influences activity of Lp-PLA2 could have implications for therapeutic intervention in this pathway.
Materials and Methods
Ethics statement
This research was approved by the Duke University institutional review board and all clinical investigation was conducted according to the principles expressed in the Declaration of Helsinki.
Study population
We conducted this research using data from the Framingham Heart Study (FHS), a population-based, longitudinal study of families living in the town of Framingham, Massachusetts collected over three-generations beginning in 1948. An overview of the FHS is provided at the dbGap website (http://www.ncbi.nlm.nih.gov/sites/entrez?db=gap) and detailed descriptions are available elsewhere [47], [48]. Briefly, the original study enrolled 5209 individuals, primarily Caucasian, and it later added the offspring of the original cohort (Offspring), and the grandchildren (Generation 3) of the original cohort.
All lipid-related traits were measured on fasting, plasma samples stored at −80°C. Lp-PLA2 activity was measured during the seventh exam of the Offspring cohort and first exam of the Third Generation cohort using a colorimetric method (diaDexus CAM Kit, Inc., San Francisco, CA). Apolipoprotein E concentrations were measured during the fifth Offspring exam using an immunochemical technique. Apolipoproteins A1 and B were measured at the fourth exam by noncompetitive ELISA with the use of affinity-purified polyclonal antibodies [49]. Triglycerides, total cholesterol, and HDL-C were measured using standard enzymatic methods, and LDL-C was calculated using the Friedewald formula [50] if triglycerides levels were less than 400 mg/dL. Smokers were defined as individuals who indicated that they smoked regularly within the past year of the exam.
Genotype data and quality control
Genome-wide genotypes and detailed clinical data on subjects from all three generations have been made accessible to the research community through the SHARe project (SNP-Health Association Resource). The study protocol was approved by Duke University's Institutional Review Board and the Framingham SHARe Data Access Committee. The unfiltered genotype data contained 9215 individuals (all generations) genotyped for 549782 SNPs. This included 500568 SNPs from the Affymetrix 500K mapping array and 49214 SNPs from the Affymetrix 50K supplemental array (Affymetrix, Santa Clara, CA, USA). We used the toolset PLINK to perform quality control [51]. Individuals were excluded if genotyping rates were less than 97%. Markers were excluded if genotyping rates were less than 97%, minor allele frequencies were less than 0.05, or if Hardy-Weinberg p-values were less than 0.001. All SNP exclusions were made sequentially in the preceding order. Using this filtered data, we checked for Mendel errors using a 5% cutoff per family, and a 10% cutoff per SNP (as defined in PLINK), but none were detected. Individuals were also excluded if the predicted sex based on X-chromosome genotypes did not match the recorded sex. Pair wise identity-by-descent measures were calculated to detect replicated samples and unknown inter-familial relationships. We detected four sets of identical twins and randomly selected one member of each pair for the analytic sample. After quality controls, the remaining sample consisted of 8493 individuals genotyped on 360811 SNPs, attaining a genotyping rate of 99.5%. We also removed individuals who had missing values for any covariates.
Statistical analysis
The primary analytic sample included 6668 individuals who had both genotypes and Lp-PLA2 measurements available. We tested SNPs for their association with Lp-PLA2 activity and mass in an additive genetic model. To account for relatedness, we used linear mixed models implemented in the kinship package of the R statistical language. This allowed fitting an individual random effect that was correlated according to the degree of relatedness within a family [52]. Regression models included the covariates age, age2, sex, smoking status, a variable indicating the use of cholesterol-lowering drugs, and a cohort variable corresponding to the generation within the FHS. Subsequent analyses also included serum lipoproteins in the regression model. We also tested for evidence that population stratification was inflating test statistics. To do this, we estimated the inflation factor by dividing the median of the observed χ2 statistics by the expected median in the absence of stratification (0.456) [53]. We defined genome-wide significance using a Bonferroni cutoff of 1.4×10⁻⁷, which corrects for 360811 tests. Following genome-wide analysis, we annotated results using the WGAViewer package, Ensembl, and the UCSC genome browser [54]–[56]. We generated plots using the ggplot2 package [57] and Haploview software [58].
Supporting Information
Zdroje
1. PerssonM
NilssonJA
NelsonJJ
HedbladB
BerglundG
2007 The epidemiology of Lp-PLA(2): distribution and correlation with cardiovascular risk factors in a population-based cohort. Atherosclerosis 190 388 396
2. KoenigW
KhuseyinovaN
2009 Lipoprotein-Associated and Secretory Phospholipase A2 in Cardiovascular Disease: The Epidemiological Evidence. Cardiovasc Drugs Ther 23 85 92
3. WilenskyRL
MacpheeCH
2009 Lipoprotein-associated phospholipase A(2) and atherosclerosis. Curr Opin Lipidol 20 415 420
4. StafforiniDM
2009 Biology of platelet-activating factor acetylhydrolase (PAF-AH, lipoprotein associated phospholipase A2). Cardiovasc Drugs Ther 23 73 83
5. TsimihodimosV
KarabinaSA
TambakiAP
BairaktariE
MiltiadousG
2002 Altered distribution of platelet-activating factor - acetylhydrolase activity between LDL and HDL as a function of the severity of hypercholesterolemia. J Lipid Res 43 256 263
6. TellisCC
TselepisAD
2009 The role of lipoprotein-associated phospholipase A2 in atherosclerosis may depend on its lipoprotein carrier in plasma. Biochim Biophys Acta 1791 327 338
7. TselepisAD
DentanC
KarabinaSA
ChapmanMJ
NinioE
1995 PAF-degrading acetylhydrolase is preferentially associated with dense LDL and VHDL-1 in human plasma. Catalytic characteristics and relation to the monocyte-derived enzyme. Arterioscler Thromb Vasc Biol 15 1764 1773
8. BenitezS
Sanchez-QuesadaJL
RibasV
JorbaO
Blanco-VacaF
2003 Platelet-activating factor acetylhydrolase is mainly associated with electronegative low-density lipoprotein subfraction. Circulation 108 92 96
9. TsimikasS
WilleitJ
KnoflachM
MayrM
EggerG
2009 Lipoprotein-associated phospholipase A2 activity, ferritin levels, metabolic syndrome, and 10-year cardiovascular and non-cardiovascular mortality: results from the Bruneck study. Eur Heart J 30 107 115
10. PerssonM
HedbladB
NelsonJJ
BerglundG
2007 Elevated Lp-PLA2 levels add prognostic information to the metabolic syndrome on incidence of cardiovascular events among middle-aged nondiabetic subjects. Arterioscler Thromb Vasc Biol 27 1411 1416
11. SchnabelR
DupuisJ
LarsonMG
LunettaKL
RobinsSJ
2009 Clinical and genetic factors associated with lipoprotein-associated phospholipase A2 in the Framingham Heart Study. Atherosclerosis 204 601 607
12. LenziniL
AntezzaK
CarocciaB
WolfertRL
SzczechR
2009 A twin study of heritability of plasma lipoprotein-associated phospholipase A2 (Lp-PLA2) mass and activity. Atherosclerosis 205 181 185
13. KathiresanS
MelanderO
GuiducciC
SurtiA
BurttNP
2008 Six new loci associated with blood low-density lipoprotein cholesterol, high-density lipoprotein cholesterol or triglycerides in humans. Nat Genet 40 189 197
14. KathiresanS
WillerCJ
PelosoGM
DemissieS
MusunuruK
2009 Common variants at 30 loci contribute to polygenic dyslipidemia. Nat Genet 41 56 65
15. ActonS
OsgoodD
DonoghueM
CorellaD
PocoviM
1999 Association of polymorphisms at the SR-BI gene locus with plasma lipid levels and body mass index in a white population. Arterioscler Thromb Vasc Biol 19 1734 1743
16. TaiES
AdiconisX
OrdovasJM
Carmena-RamonR
RealJ
2003 Polymorphisms at the SRBI locus are associated with lipoprotein levels in subjects with heterozygous familial hypercholesterolemia. Clin Genet 63 53 58
17. McCarthyJJ
LehnerT
ReevesC
MoliternoDJ
NewbyLK
2003 Association of genetic variants in the HDL receptor, SR-B1, with abnormal lipids in women with coronary artery disease. J Med Genet 40 453 458
18. McCarthyJJ
LewitzkyS
ReevesC
PermuttA
GlaserB
2003 Polymorphisms of the HDL receptor gene associated with HDL cholesterol levels in diabetic kindred from three populations. Hum Hered 55 163 170
19. HongSH
KimYR
YoonYM
MinWK
ChunSI
2002 Association between HaeIII polymorphism of scavenger receptor class B type I gene and plasma HDL-cholesterol concentration. Ann Clin Biochem 39 478 481
20. HsuLA
KoYL
WuS
TengMS
PengTY
2003 Association between a novel 11-base pair deletion mutation in the promoter region of the scavenger receptor class B type I gene and plasma HDL cholesterol levels in Taiwanese Chinese. Arterioscler Thromb Vasc Biol 23 1869 1874
21. MorabiaA
RossBM
CostanzaMC
CayanisE
FlahertyMS
2004 Population-based study of SR-BI genetic variation and lipid profile. Atherosclerosis 175 159 168
22. RobertsCG
ShenH
MitchellBD
DamcottCM
ShuldinerAR
2007 Variants in scavenger receptor class B type I gene are associated with HDL cholesterol levels in younger women. Hum Hered 64 107 113
23. LiuPY
LiYH
WuHL
ChaoTH
TsaiLM
2006 Platelet-activating factor-acetylhydrolase A379V (exon 11) gene polymorphism is an independent and functional risk factor for premature myocardial infarction. J Thromb Haemost 4 1023 1028
24. WoottonPT
StephensJW
HurelSJ
DurandH
CooperJ
2006 Lp-PLA2 activity and PLA2G7 A379V genotype in patients with diabetes mellitus. Atherosclerosis 189 149 156
25. NinioE
TregouetD
CarrierJL
StengelD
BickelC
2004 Platelet-activating factor-acetylhydrolase and PAF-receptor gene haplotypes in relation to future cardiovascular event in patients with coronary artery disease. Hum Mol Genet 13 1341 1351
26. AbuzeidAM
HaweE
HumphriesSE
TalmudPJ
2003 Association between the Ala379Val variant of the lipoprotein associated phospholipase A2 and risk of myocardial infarction in the north and south of Europe. Atherosclerosis 168 283 288
27. HouL
ChenS
YuH
LuX
ChenJ
2009 Associations of PLA2G7 gene polymorphisms with plasma lipoprotein-associated phospholipase A2 activity and coronary heart disease in a Chinese Han population: the Beijing atherosclerosis study. Hum Genet 125 11 20
28. SuttonBS
CrosslinDR
ShahSH
NelsonSC
BassilA
2008 Comprehensive genetic analysis of the platelet activating factor acetylhydrolase (PLA2G7) gene and cardiovascular disease in case-control and family datasets. Hum Mol Genet 17 1318 1328
29. DrenosF
TalmudPJ
CasasJP
SmeethL
PalmenJ
2009 Integrated associations of genotypes with multiple blood biomarkers linked to coronary heart disease risk. Hum Mol Genet 18 2305 2316
30. BertramL
LangeC
MullinK
ParkinsonM
HsiaoM
2008 Genome-wide association analysis reveals putative Alzheimer's disease susceptibility loci in addition to APOE. Am J Hum Genet 83 623 632
31. ElliottP
ChambersJC
ZhangW
ClarkeR
HopewellJC
2009 Genetic Loci associated with C-reactive protein levels and risk of coronary heart disease. JAMA 302 37 48
32. HindorffLA
JunkinsHA
MehtaJP
ManolioTA
A Catalog of Published Genome-Wide Association Studies. Available at: www.genome.gov/gwastudies <http://www.genome.gov/gwastudies>. Accessed October 10, 2009
33. StafforiniDM
McIntyreTM
CarterME
PrescottSM
1987 Human plasma platelet-activating factor acetylhydrolase. Association with lipoprotein particles and role in the degradation of platelet-activating factor. J Biol Chem 262 4215 4222
34. GuoL
SongZ
LiM
WuQ
WangD
2009 Scavenger Receptor BI Protects against Septic Death through Its Role in Modulating Inflammatory Response. J Biol Chem 284 19826 19834
35. NajAC
WestM
RichSS
PostW
KaoL
2009 Association of Scavenger Receptor Class B Type I Polymorphisms with Subclinical Atherosclerosis: The Multi-Ethnic Study of Atherosclerosis. Circulation Cardiovascular Genetics
36. WillerCJ
SannaS
JacksonAU
ScuteriA
BonnycastleLL
2008 Newly identified loci that influence lipid concentrations and risk of coronary artery disease. Nat Genet 40 161 169
37. ScanuAM
EdelsteinC
2008 HDL: bridging past and present with a look at the future. FASEB J 22 4044 4054
38. BarterPJ
PuranikR
RyeKA
2007 New insights into the role of HDL as an anti-inflammatory agent in the prevention of cardiovascular disease. Curr Cardiol Rep 9 493 498
39. AulchenkoYS
de KoningDJ
HaleyC
2007 Genomewide rapid association using mixed model and regression: a fast and simple method for genomewide pedigree-based quantitative trait loci association analysis. Genetics 177 577 585
40. WallaceC
NewhouseSJ
BraundP
ZhangF
TobinM
2008 Genome-wide association study identifies genes for biomarkers of cardiovascular disease: serum urate and dyslipidemia. Am J Hum Genet 82 139 149
41. SandhuMS
WaterworthDM
DebenhamSL
WheelerE
PapadakisK
2008 LDL-cholesterol concentrations: a genome-wide association study. Lancet 371 483 491
42. SabattiC
ServiceSK
HartikainenAL
PoutaA
RipattiS
2009 Genome-wide association analysis of metabolic traits in a birth cohort from a founder population. Nat Genet 41 35 46
43. Linsel-NitschkeP
HeerenJ
AherrahrouZ
BruseP
GiegerC
2009 Genetic variation at chromosome 1p13.3 affects sortilin mRNA expression, cellular LDL-uptake and serum LDL levels which translates to the risk of coronary artery disease. Atherosclerosis
44. GardnerAA
ReichertEC
TophamMK
StafforiniDM
2008 Identification of a domain that mediates association of platelet-activating factor acetylhydrolase with high density lipoprotein. J Biol Chem 283 17099 17106
45. EisenbergS
GavishD
OschryY
FainaruM
DeckelbaumRJ
1984 Abnormalities in very low, low and high density lipoproteins in hypertriglyceridemia. Reversal toward normal with bezafibrate treatment. J Clin Invest 74 470 482
46. JaquishCE
2007 The Framingham Heart Study, on its way to becoming the gold standard for Cardiovascular Genetic Epidemiology? BMC Med Genet 8 63
47. GovindarajuDR
CupplesLA
KannelWB
O'DonnellCJ
AtwoodLD
2008 Genetics of the Framingham Heart Study population. Adv Genet 62 33 65
48. CupplesLA
ArrudaHT
BenjaminEJ
D'AgostinoRBSr
DemissieS
2007 The Framingham Heart Study 100K SNP genome-wide association study resource: overview of 17 phenotype working group reports. BMC Med Genet 8 Suppl 1 S1
49. OrdovasJM
PetersonJP
SantanielloP
CohnJS
WilsonPW
1987 Enzyme-linked immunosorbent assay for human plasma apolipoprotein B. J Lipid Res 28 1216 1224
50. FriedewaldWT
LevyRI
FredricksonDS
1972 Estimation of the concentration of low-density lipoprotein cholesterol in plasma, without use of the preparative ultracentrifuge. Clin Chem 18 499 502
51. PurcellS
NealeB
Todd-BrownK
ThomasL
FerreiraMA
2007 PLINK: a tool set for whole-genome association and population-based linkage analyses. Am J Hum Genet 81 559 575
52. TherneauT
2009 kinship: mixed-effects Cox models, sparse matricies and modeling data from large pedigrees. R package version 1.1.0-23. http://CRAN.R-project.org/package=kinship
53. DevlinB
RoederK
1999 Genomic control for association studies. Biometrics 55 997 1004
54. HubbardTJ
AkenBL
AylingS
BallesterB
BealK
2009 Ensembl 2009. Nucleic Acids Res 37 D690 697
55. GeD
ZhangK
NeedAC
MartinO
FellayJ
2008 WGAViewer: software for genomic annotation of whole genome association studies. Genome Res 18 640 643
56. KentWJ
SugnetCW
FureyTS
RoskinKM
PringleTH
2002 The human genome browser at UCSC. Genome Res 12 996 1006
57. WickhamH
2009 ggplot2: An implementation of the Grammar of Graphics. R package version 0.8.3. http://CRAN.R-project.org/package=ggplot2
58. BarrettJC
FryB
MallerJ
DalyMJ
2005 Haploview: analysis and visualization of LD and haplotype maps. Bioinformatics 21 263 265
Štítky
Genetika Reprodukční medicínaČlánek vyšel v časopise
PLOS Genetics
2010 Číslo 4
- Kazuistika – Perspektivy využití precizované medicíny v rámci personalizované specifické terapie onkologických pacientů
- Nobelova cena za chemii pro genetické nůžky: Objev, který změní naši budoucnost?
- Technologie na bázi RNA v klinické praxi: od přebarvených petúnií k terapii vzácných a dosud jen obtížně léčitelných chorob u lidí
- „Nepředstavovali jsme si, že náš výzkum povede přímo ke vzniku nových léků, dokonce ještě za našeho života“
- Bezplatné služby pro diagnostiku ATTRv amyloidózy pro kardiology
Nejčtenější v tomto čísle
- Whole-Genome SNP Association in the Horse: Identification of a Deletion in Myosin Va Responsible for Lavender Foal Syndrome
- Admixture Mapping Scans Identify a Locus Affecting Retinal Vascular Caliber in Hypertensive African Americans: the Atherosclerosis Risk in Communities (ARIC) Study
- Genetic Tests for Ecological and Allopatric Speciation in Anoles on an Island Archipelago
- Human Telomeres Are Hypersensitive to UV-Induced DNA Damage and Refractory to Repair
Zvyšte si kvalifikaci online z pohodlí domova
Mazová zátka a její řešení
nový kurzVšechny kurzy