
Fragilities Caused by Dosage Imbalance in Regulation of the Budding Yeast Cell Cycle
Cells can maintain their functions despite fluctuations in intracellular parameters, such as protein activities and gene expression levels. This commonly observed biological property of cells is called robustness. On the other hand, these parameters have different limitations, each reflecting the property of the subsystem containing the parameter. The budding yeast cell cycle is quite fragile upon overexpression of CDC14, but is robust upon overexpression of ESP1. The gene products of both CDC14 and ESP1 are regulated by 1∶1 binding with their inhibitors (Net1 and Pds1), and a mathematical model predicts the extreme fragility of the cell cycle upon overexpression of CDC14 and ESP1 caused by dosage imbalance between these genes. However, it has not been experimentally shown that dosage imbalance causes fragility of the cell cycle. In this study, we measured the quantitative genetic interactions of these genes by performing combinatorial “genetic tug-of-war” experiments. We first showed experimental evidence that dosage imbalance between CDC14 and NET1 causes fragility. We also showed that fragility arising from dosage imbalance between ESP1 and PDS1 is masked by CDH1 and CLB2. The masking function of CLB2 was stabilization of Pds1 by its phosphorylation. We finally modified Chen's model according to our findings. We thus propose that dosage imbalance causes fragility in biological systems.
Published in the journal:
. PLoS Genet 6(4): e32767. doi:10.1371/journal.pgen.1000919
Category:
Research Article
doi:
https://doi.org/10.1371/journal.pgen.1000919
Summary
Cells can maintain their functions despite fluctuations in intracellular parameters, such as protein activities and gene expression levels. This commonly observed biological property of cells is called robustness. On the other hand, these parameters have different limitations, each reflecting the property of the subsystem containing the parameter. The budding yeast cell cycle is quite fragile upon overexpression of CDC14, but is robust upon overexpression of ESP1. The gene products of both CDC14 and ESP1 are regulated by 1∶1 binding with their inhibitors (Net1 and Pds1), and a mathematical model predicts the extreme fragility of the cell cycle upon overexpression of CDC14 and ESP1 caused by dosage imbalance between these genes. However, it has not been experimentally shown that dosage imbalance causes fragility of the cell cycle. In this study, we measured the quantitative genetic interactions of these genes by performing combinatorial “genetic tug-of-war” experiments. We first showed experimental evidence that dosage imbalance between CDC14 and NET1 causes fragility. We also showed that fragility arising from dosage imbalance between ESP1 and PDS1 is masked by CDH1 and CLB2. The masking function of CLB2 was stabilization of Pds1 by its phosphorylation. We finally modified Chen's model according to our findings. We thus propose that dosage imbalance causes fragility in biological systems.
Introduction
Intracellular biochemical parameters, such as gene expression levels and protein activities, are highly optimized in order to maximize the performance of biological systems [1]–[4]. On the other hand, these parameters operate within certain limitations to maintain the function of the system against perturbations such as environmental changes, mutations, and noise in biochemical reactions. This robustness against fluctuations in parameters is considered a common design principle of biological systems [5]–[7].
The cell cycle is a series of events that leads to cellular duplication, and the regulatory system is highly sophisticated to precisely maintain cellular integrity [8]. The budding yeast Saccharomyces cerevisiae is an excellent model organism to understand the principle of cell cycle regulation because of its ease in use with molecular genetic techniques. Cell cycle regulation has been integrated into a mathematical model called Chen's model [9]. This model implements interactions of about 25 genes involved in the budding yeast cell cycle to reproduce over 100 mutant phenotypes, and thus, has become a standard for measuring the robustness of the budding yeast cell cycle [10]–[12].
The robustness of a cellular system can be assessed by perturbation analysis of the extent to which each intracellular parameter can be changed without disrupting the function of the system [1]. To assess the robustness of the budding yeast cell cycle, we used a previously developed genetic experiment designated “genetic tug-of-war” (gTOW) to measure the copy number limit of overexpression of certain target genes [13]. In gTOW, a target gene with its native promoter is cloned into a special plasmid, and the plasmid copy number can be increased just before cell death (Figure 1) [13]. In this method, the copy number limit of gene overexpression is measured as a fold increase and compared with its native expression level.

Using gTOW, we measured the copy number limit of overexpression of 30 cell cycle-related genes that varied from <2 to >100 [13]. Although these numbers are thought to reflect the robustness of the subsystems harboring these genes, it is not easy to identify the molecular mechanism behind the phenomenon causing the variation because robustness arises from interactions between multiple components of the system. Analysis using mathematical models helps to identify the mechanism responsible for the robustness of biological systems [1], [14]. We compared the gTOW data with Chen's model and discussed the mechanisms underlying fragility and robustness of the yeast cell cycle in response to overexpression of several genes [13].
In this study, we define a cellular system has robustness if its normal mode of operation is hardly destroyed even when amount of a certain component in the system largely fluctuates. And we define a cellular system has fragility if its normal mode of operation is easily destroyed when amount of a certain component fluctuates. In this study, “fluctuation of component” corresponds to the increase of gene copy number in the cell, and the increase of gene expression parameter in the computer simulation (both manipulations cause gene overexpression). When the cell is viable despite overexpression of a certain gene, we call that the cellular system has robustness upon overexpression of the gene. When the cell is not viable due to minor overexpression of a certain gene, we call that the cellular system has fragility upon overexpression of the gene.
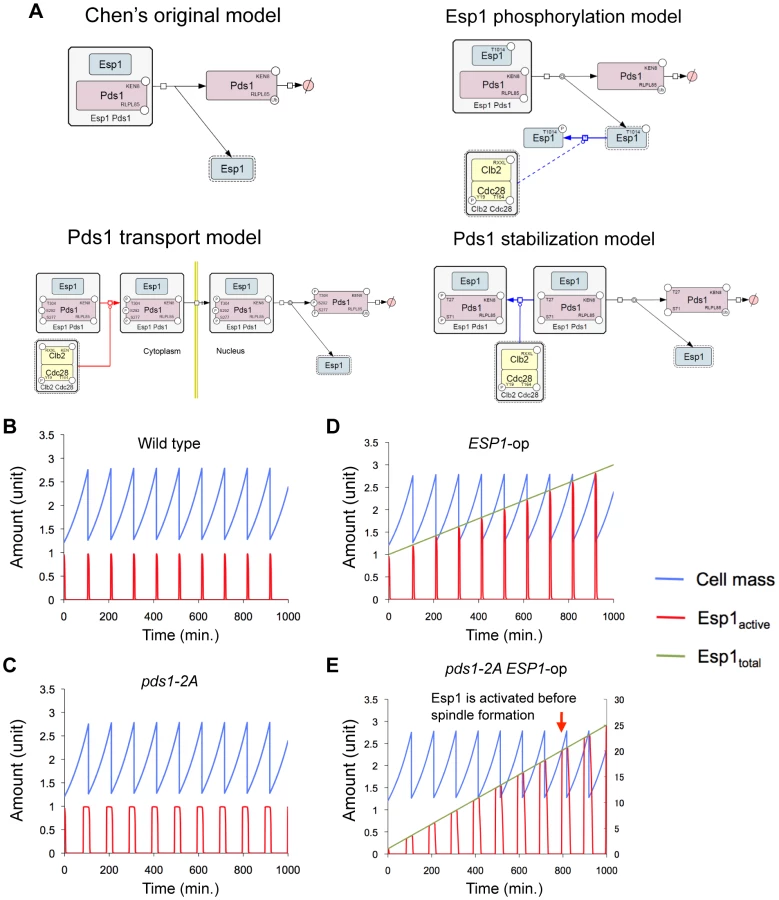
We observed that the copy number limit for a mitotic phosphatase gene CDC14 overexpression was very low (<2), which was well predicted by Chen's model (<2). In contrast, we observed that the copy number limit for the separase gene ESP1 overexpression was quite high (>160), and the prediction of Chen's model (<1.4) was quite different from the upper limit in vivo [13]. According to multiple reports [15]–[18], in Chen's model, enzymes such as Cdc14 phosphatase and separase are regulated by direct 1∶1 binding with their inhibitors (Net1 and Pds1) (Figure 2A and 2C). And overexpression of CDC14 cured the lethality brought about by overexpression of NET1 [18]. We thus predict that fragilities upon overexpression of these genes arise from dosage imbalance between the enzymes and their inhibitors [13]. However, it has not been shown that dosage imbalance between CDC14 and NET1 causes fragility of the yeast cell cycle. Moreover, there is a discrepancy between predictions of the model and the experimental data in case of the copy number limit of ESP1 as mentioned above. In this study, we analyzed the molecular mechanisms underlying fragility of CDC14 regulation and robustness of ESP1 regulation.

On the basis of our observations, we suggest that dosage imbalance between enzyme and its inhibitor causes cellular fragility. We further suggest that knowledge about cellular robustness can be effectively used to improve integrative mathematical models.
Results
Dosage imbalance causes extreme fragility of the yeast cell cycle upon overexpression of CDC14
To experimentally determine whether dosage imbalance causes fragility of the yeast cell cycle upon overexpression of certain genes, we first thoroughly analyzed the quantitative relationship between CDC14 and NET1, as well as ESP1 and PDS1 using Chen's model. When the regulated enzyme (i.e., Cdc14 or Esp1) alone is overexpressed and its amount exceeds that of its inhibitor (i.e., Net1 or Pds1), the cell cycle halts due to abnormal chromosome separation (Figure S2A and S2C). When the amount of enzyme and its inhibitor increased simultaneously, the cell cycle proceeds normally (Figure S2B and S2D). We performed two parameter viability tests in which parameters for expression of enzymes (Cdc14 and Esp1) and their inhibitors (Net1 and Pds1) were systematically increased and the ability of the cell cycle to persist with any combination of these parameters was tested. Computational analysis showed that to maintain the cell cycle, the absolute amount of enzymes and their inhibitors did not matter, but the quantitative ratio was important and needs to be conserved [(fold increase in expression of NET1)/(fold increase in expression of CDC14) = 0.95–1.95; (fold increase in expression of PDS1)/(fold increase in expression of ESP1) = 0.56–2.20] (Figure 2B and 2D). If fragility upon overexpression of CDC14 is caused by dosage imbalance against NET1, this conserved ratio should be observed in vivo as well.
Similar to computational analysis, we designed an experiment by adding another multicopy plasmid carrying NET1 into the gTOW experiment of CDC14 (Figure 3A). This experiment called “2D-gTOW” is based on the fact that multicopy plasmids with CDC14 or NET1 replicate with 2µDNA origin, exist as multi-copy in a cell and their numbers vary among the cellular population [19]. Moreover, the copy number of the gTOW plasmid can be controlled by changing leucine concentration in growth media; the average plasmid copy number within a cell is around 35 in the presence of leucine but increases to more than 150 in the absence of leucine (Figure 1) [13].

As expected, introduction of NET1 plasmid prevented cellular death upon overexpression of CDC14 (Figure 3B). In the rescued cells, the average plasmid copy number of CDC14 increased dramatically (∼40 copies per cell; Figure 3C), and the amount of Cdc14 protein also increased accordingly (Figure 3D). We then performed the two parameter viability test by measuring the copy numbers of the plasmids in multiple independent experiments with and without leucine in medium. Most importantly, the ratio between CDC14 and NET1 was clearly conserved [(NET1 copy number)/(CDC14 copy number) = 1.38, R2 = 0.96]] (Figure 3E), similar to that observed in computational analysis. Moreover, when we use cdc14-1, a temperature-sensitive CDC14 gene with reduced activity, the ratio was reduced but still conserved [(NET1 copy number)/(cdc14-1 copy number) = 0.77, R2 = 0.94] (Figure 3F). We show for the first time that cellular fragility upon overexpression of CDC14 is caused by dosage imbalance between NET1 and CDC14.
Cellular fragility upon overexpression of ESP1 is masked by CDH1 and CLB2
While there is evidence that Esp1 is regulated by 1∶1 binding of Pds1 [15], [16], cellular fragility from dosage imbalance has not been observed (i.e., the copy number limit of ESP1 overexpression is high). We thus hypothesized that there was an additional regulatory mechanism besides simple binding of Pds1 [13]. To demonstrate ESP1 regulation by other factors, we performed another 2D-gTOW experiment in various gene knockout mutants (Figure 4A). Among 23 nonessential cell cycle gene knockouts, cdh1Δ and clb2Δ strain showed significant reduction in the copy number limit of ESP1 (Figure 4B). The fragility of these knockouts upon overexpression of ESP1 was rescued by additional PDS1 plasmids (Figure 4C). Moreover, the ratio between ESP1 and PDS1 copy number was well conserved in cdh1Δ cells [(PDS1 copy number)/(ESP1 copy number) = 1.27, R2 = 0.91] (Figure 4D), as observed between CDC14 and NET1. This result indicates that dosage imbalance between ESP1 and PDS1 actually causes cellular fragility upon overexpression of ESP1, but additional regulations by CDH1 and CLB2 mask the potential fragility.

Computational prediction of CLB2 function conferring cellular robustness against overexpression of ESP1
Our study above indicated the existence of some factors regulating ESP1 that are not incorporated into Chen's model. We thus tried to improve Chen's model by seeking additional regulations to reproduce the gTOW results. We should note that recently, a study published more detailed model for M-phase-specific regulation [20]. Although this model implements additional regulations such as signaling activity of Esp1 toward FEAR (Cdc14 early anaphase release) pathway (see below), the model still predicted fragility upon overexpression of ESP1 (Figure S3), indicating the regulation we are seeking is not implemented in this model. We focused on regulation by Clb2, a B-type cyclin-dependent kinase (B-CDK) subunit, because there is evidence that B-CDK is involved in ESP1 regulation. In the budding yeast, B-CDK phosphorylates the inhibitor Pds1 to regulate its localization [15] and stability in metaphase [21]. In higher eukaryotes, CDK phosphorylates separase (Esp1 homolog) to inhibit its protease activity [22]. However, it has never been shown whether any of these regulations confer cellular robustness upon overexpression of Esp1.
Therefore, we first modified Chen's model by incorporating each regulation into three independent computational models and tested if they gave viable solution with; overexpression of ESP1, overexpression of ESP1 in the absence of Clb2, and simultaneous overexpression of ESP1 and PDS1 (Figure 5A and Table 1) (details in Text S1, S2, S3, S4, S5, S6; Table S1, S2, S3; and Figure S1, S4, S5, S6, S7, S8). Among them, the models for Esp1 phosphorylation and Pds1 stabilization could well reproduce the behaviors of the cell in terms of copy number limits of ESP1 overexpression (Table 1).

Quantitative regulation of Pds1 through phosphorylation by B-CDK masks fragility arising from dosage imbalance between Esp1 and Pds1
We next experimentally verified these regulations limiting the ESP1 copy number. When phosphorylation by Clb2 is involved in cellular robustness upon overexpression of ESP1, regulation can be destroyed by introducing mutations in phosphorylation sites of the target proteins. In Esp1 of the budding yeast, putative CDK phosphorylation sites [(Thr/Ser)-Pro] are observed, which are conserved among relative yeast species (Thr-1012, Ser-1025, and Thr-1032) (Figure 6A). We substituted these amino acids with alanine (esp1-AAA), and measured the copy number limit by gTOW to verify the ESP1 phosphorylation model, and found that the limit was >100 (Figure 6B). This indicates that direct phosphorylation of Esp1 by Clb2 does not confer robustness upon overexpression of ESP1.

A study reported that phosphorylation of Pds1 on Thr-27 and Ser-71 by B-CDK stabilizes Pds1, and its regulation is required for synchronization of chromosomal partition [21] (Figure 5A, Pds1 stabilization model). We thus built our model according to their findings, and our model predicted that the copy number limit of ESP1 was significantly reduced when phosphorylation of Pds1 was inhibited (Figure 5D). We then measured the limit of ESP1 in the alanine-substituted mutants on these phosphorylation sites (pds1-2A), and found that the cell did not accept the high copy number of ESP1 as observed in clb2Δ cells and the limit of overexpression was significantly decreased (Figure 6C). This is the first evidence to show that Pds1 phosphorylation is involved in cellular robustness upon overexpression of ESP1. We should note that the decrease of the limit of ESP1 overexpression in pds1-2A cells was not dramatic as in clb2Δ cell (Figure 7), suggesting that there is another mechanism by which clb2 confers cellular robustness against ESP1 overexpression.

One important but not reported assumption to build the Pds1 stabilization model was that the amount of Pds1 is in large excess of Esp1 (Pds1∶Esp1 is 112∶1 on average during the cell cycle, see Text S1), while their amount is almost the same in Chen's model (0.998∶1). To confirm our assumption, we measured the quantitative ratio of Pds1∶Esp1 using TAP-tagged proteins. Although we could not detect Esp1 expressed from the chromosomal copy, the amount of Pds1 was at leaset more than 64-fold higher than Esp1 (Figure 6D and 6E), supporting our assumption. We thus conclude that quantitative regulation of Pds1 through phosphorylation by B-CDK requires for masking the fragility arising from dosage imbalance between Esp1 and Pds1.
CDH1 confers cellular robustness upon overexpression of ESP1 through the different mechanism from CLB2
Esp1 is known to have two independent activities. One is a protease activity to digest certain substrates such as Scc1 and Slk19 [23], [24], and the other is a signaling function to activate FEAR pathway that is a pathway to activate Cdc14 [20], [25]. We thus tested if either of these activities was the determinant of limit of Esp1 overexpression in cdh1Δ and clb2Δ strains. We measured the limit of esp1-C1531A, an ESP1 allele without separase activity [26] in the wild type, cdh1Δ, clb2Δ, and pds1-2A strains respectively. The limit of esp1-C1531A overexpression was increased in the clb2Δ strain and the pds1-2A strain up to >100 copies (Figure 7). Interestingly, however, the limit of esp1-C1531A overexpression was still very low in the cdh1Δ strain (Figure 7). These results indicate that CLB2 and CDH1 are involved in the robustness of ESP1 regulation in different ways; CLB2 is involved in the regulation associated with the protease activity, and CDH1 is involved in the regulation associated with the FEAR signaling activity.
Discussion
Knowing the mechanisms causing cellular fragility is important for controlling cellular functions or finding novel drug targets [27], [28]. In this study, we demonstrated that dosage imbalance between Cdc14 and Net1 causes significant cellular fragility upon overexpression of CDC14 using computational and experimental analysis. We believe that 2D-gTOW can be used as an experimental technique to detect cellular fragility arising from dosage imbalance. As in one of the examples, we were able to detect potential fragility arising from dosage imbalance between ESP1 and PDS1, although it was masked by CDH1 and CLB2. Using this method, we would be able to show more examples of dosage imbalances causing cellular fragility.
Because the strain having mutations on the phosphorylation sites of Pds1 by Clb2 did not accept Esp1 overexpression (Figure 6C), we concluded that the masking function of Clb2 is performed through the stabilization of Pds1. On the other hand, currently we could not explain the masking function of CDH1. The function of CDH1 in Esp1 regulation is at least different from CLB2, because the limit of overexpression of the esp1-C1531A mutant was still low in the cdh1Δ strain, but high in the clb2Δ strain (Figure 7). This fact suggests that the masking function of CDH1 is performed through the process downstream of FEAR pathway, which regulates the activity of Cdc14 phosphatase [25]. Cdh1 is a component of ubiquitin-conjugating enzyme complex called APC that degrades a number of proteins such as Clb2, Cdc5, Cdc20, Cin8, etc. [29]–[33]. CDH1 will thus confer the robustness of Esp1 regulation through degradation of these M-phase components.
One possible function of Cdh1 to confer cellular robustness against the overexpression of Esp1 is performed thorough a polo-like kinase Cdc5, which also regulates Cdc14 activity [34]. When Cdh1 is inactivated, the substrate Cdc5 activity will increase, and Cdc14 will be activated. In the situation, the cell will be very sensitive against further activation of Cdc14 by the FEAR pathway due to the overexpression of Esp1. Alternatively, the masking function of Cdh1 could be performed through Cdc20. Cdc20 is another component of APC, which promotes the degradation of Pds1 [35]. Because Cdc20 is a potential target of Cdh1 [32], [33], the activity of Cdc20 could be higher in the cdh1Δ strain. It is thus possible that the amount of Pds1 is reduced in the cdh1Δ strain due to the over-activation of Cdc20, which causes reduction of the robustness of ESP1 regulation.
In addition to the mechanisms described above, there could be other mechanisms that make the cellular system robust against Esp1 overexpression. For example, Pds1 is considered as a chaperone for Esp1 [36], [37], which will make excess Esp1 over Pds1 unstable. Although we did not adopt the Pds1 transport model (Figure 6) to explain our finding, it is also a quite effective mechanism to regulate the activity of Esp1. CDC55, a component of PP2A phosphatase and a direct regulator and a downstream effector of Esp1 [20], [38]), will be also involved in the robustness. M-phase regulations with components such as Cdc5 and Cdc55 should be implemented into the integrated model, and verified further combinational gTOW experiments to uncover the whole regulatory mechanisms conferring the cellular robustness against Esp1 overexpression.
We should note that the reason why the clb2Δ cell and cdh1Δ cell are fragile against overexpression of ESP1, could be arisen from the same mechanistic consequence as the observation that clb2Δ and cdh1Δ are synthetic lethal with pds1Δ [39], [40], although Pds1 phosphorylation by Clb2 should be an exception. Unfortunately, Chen's model and our modified model do not reproduce the behavior of pds1Δ mutant (i.e., viable in real cell, but essential in the models [9], data not shown). We thus could not test these phenotypes in our model. We hope that modifications of the model by implementing the regulation above will solve the discrepancy.
In the budding yeast cell, there are several genes, such as actin encoding gene (ACT1) or beta-tubulin-encoding gene (TUB2), that cause extreme fragility due to imbalance against binding partners [41], [42]. Dosage balance (i.e., stoichiometry) between histone dimmer sets must be conserved for normal mitotic chromosome transmission [43]. We thus hypothesize that dosage imbalance is a common cause of cellular fragility. In regulation of CDC14, dosage imbalance is exposed whereas in regulation of ESP1, it is masked. In many cellular processes, it is likely that fragilities caused by regulation through 1∶1 binding (here we call “stoichiometric regulation”) will be masked. In the case of Esp1, what we found here (and Chen's model did not implement) was that the inhibitor Pds1 was in large excess of the separase Esp1 (Figure 6). Excess of the inhibitor could be a general mechanism by which the systems are robust against dosage fluctuation of the enzyme. In case of Cdc14 and Net1, the amount of both proteins within the cell are the same order (Net1-TAP exists with 1.59E+03 molecules/cell and Ccd14-TAP exists with 8.55E+03 molecules/cell) [44], this is one of the reasons of the exposed fragility. However, as a trade off, the excess inhibitor should be effectively and timely inactivated when activation of the enzyme is required. Separase needs to be activated accurately in the period of metaphase to anaphase transition. Phosphorylation of Pds1 on Thr-27 and Ser-71 by Clb2 is the regulation that makes the precise inactivation (degradation) of Pds1, which requires the cell cycle system to be robust against overexpression of Esp1. Regulations conferring cellular robustness might therefore be generally discovered around stoichiometric regulations, as was observed in case of ESP1. Moreover, we may be able to control cellular robustness by modifying the regulators around stoichiometric regulation.
How is fragile regulation advantageous for a cell? Regulation by simple protein-protein interactions is one of the simplest ways to generate ultrasensitive responses in cellular systems [45], [46], and might have evolved to add novel regulations toward enzymes. For example, multiple CDK inhibitors are present in yeasts to mammalian cells, but they are quite diverse. While B-type cyclins Clb2 (S. cerevisiae) and Cdc13 (S. pombe) are quite similar (BLAST E-value 6e-79), their inhibitors Sic1 and Rum1 do not show any similarity (BLAST E-value >0.05). This suggests that these factors have evolved independently from different ancestor proteins to achieve the common purpose of binding and inhibiting CDK. In addition, drugs for molecular targeted therapy utilize the mechanism of stoichiometric regulation against the target. This is the only known enzymatic regulation thus far that humans can design. In fission yeast and higher eukaryotes, no stoichiometric regulator for Cdc14 phosphatase homologue is known to exist [47]. We propose that during evolution, the budding yeast uniquely acquired Cdc14 regulation with Net1, but it conversely produced fragility caused by dosage imbalance as a trade-off. The activity of Cdc14 itself is quite tightly regulated by two signalling pathway designated FEAR and MEN (mitotic exit network), which are found only in the budding yeast [48]. The budding yeast may have uniquely acquired these regulations in order to buffer the fragility due to the dosage imbalance.
Developing integrative cellular models with high predictive ability is one of the goals of systems biology. However, it is sometimes criticized that large-scale integrative cellular models are indefinitely adjustable and can no longer be proven false [49]. For this purpose, a general experimental technique to effectively evaluate and refine models is needed. In this study, we evaluated a model with data for cellular robustness obtained by gTOW, found discrepancies, modified them according to the current knowledge for reproducing robustness, and evaluated them with combinatorial gTOW. We believe that this analytical scheme will be effective for further development of integrative cellular models.
Materials and Methods
Yeast strains and growth conditions
A wild-type yeast strain BY4741 (MATa, his3Δ1, leu2Δ0, met15Δ0, ura3Δ0) and its derivatives with deletion of cell-cycle-related genes (in Figure 4) were obtained from Open Biosystems Inc. Haploid yeast strains KK001 (leu2Δ, ura3Δ, PDS1) and KK002 (leu2Δ, ura3Δ, pds1-T27A, S71A) are progenies of LH651 and LH557 [21], respectively. To detect TAP-tagged Pds1 and Esp1, derivatives of a yeast strain SC0000 (MATa, ade2, arg4, leu2-3,112, trp1-289, ura3-52), SC4998 (PDS1-TAP-klURA3) and SC1033 (ESP1-TAP-klURA3)(Euroscarf) were used. Yeast cells were cultured in synthetic complete medium (SC) lacking indicated amino acids. SC medium was prepared using YNB with ammonium sulfate (MP Biomedicals, LLC) with DO supplement (Clontech) and 2% glucose.
Plasmid constructions
Plasmids used in this study are listed in Table 2. pTOWug2 is a pSBI40 derivative carrying URA3-GFP fusion gene instead of URA3. pRS423-mRFP is a pRS423 derivative carrying HIS3-RFP fusion gene instead of HIS3.

gTOW procedure
gTOW experiments were performed as described previously [13]. For 2D-gTOW, cells transformed with both pSBI40 and pRS423 derivatives were cultivated in SC without uracil and histidine, and then they were transferred into SC without uracil, histidine, and leucine. The copy numbers of pSBI40 and pRS423 derivatives were measured using real-time PCR as described previously [13], except that an HIS3 primer set (HIS3-1F, TTCCGGCTGGTCGCTAAT and HIS3-1R, GCGCAAATCCTGATCCAAAC) was used to measure the copy number of pRS423 derivatives. Data shown in Figure 3C, Figure 4B and 4C, Figure 6B and 6C, and Figure 7 are averages of at least four independent experiments.
Quantification of proteins
Cdc14 and Net1 proteins were quantified by western blot analysis using their specific antibodies (sc12045 and sc27758; Santa Cruz Biotechnology, Inc.) as described previously [13]. TAP-tagged proteins were detected using PAP (P1901l; Sigma-Aldrich).
Computation
Numerical simulations were carried out using Matlab version 7.3.0. Chen's model and Queralt's model were implemented on Matlab script files [9], [20]. The code for Chen's model was based on that obtained from Dr. Cross. For details and codes used in this study refer to Text S1.
Supporting Information
Zdroje
1. AlonU
SuretteMG
BarkaiN
LeiblerS
1999 Robustness in bacterial chemotaxis. Nature 397 168 171
2. DekelE
AlonU
2005 Optimality and evolutionary tuning of the expression level of a protein. Nature 436 588 592
3. WagnerA
2005 Energy constraints on the evolution of gene expression. Mol Biol Evol 22 1365 1374
4. ZaslaverA
MayoAE
RosenbergR
BashkinP
SberroH
2004 Just-in-time transcription program in metabolic pathways. Nat Genet 36 486 491
5. BarkaiN
LeiblerS
1997 Robustness in simple biochemical networks. Nature 387 913 917
6. LittleJW
ShepleyDP
WertDW
1999 Robustness of a gene regulatory circuit. Embo J 18 4299 4307
7. von DassowG
MeirE
MunroEM
OdellGM
2000 The segment polarity network is a robust developmental module. Nature 406 188 192
8. MorganDO
2007 The Cell Cycle: Principles of Control Sunderland, MA New Science Press
9. ChenKC
CalzoneL
Csikasz-NagyA
CrossFR
NovakB
2004 Integrative analysis of cell cycle control in budding yeast. Mol Biol Cell 15 3841 3862
10. CrossFR
SchroederL
KruseM
ChenKC
2005 Quantitative characterization of a mitotic cyclin threshold regulating exit from mitosis. Mol Biol Cell 16 2129 2138
11. IronsDJ
2009 Logical analysis of the budding yeast cell cycle. J Theor Biol 257 543 559
12. LiF
LongT
LuY
OuyangQ
TangC
2004 The yeast cell-cycle network is robustly designed. Proc Natl Acad Sci U S A 101 4781 4786
13. MoriyaH
Shimizu-YoshidaY
KitanoH
2006 In vivo robustness analysis of cell division cycle genes in Saccharomyces cerevisiae. PLoS Genet 2 e111 doi:10.1371/journal.pgen.0020111
14. YiTM
HuangY
SimonMI
DoyleJ
2000 Robust perfect adaptation in bacterial chemotaxis through integral feedback control. Proc Natl Acad Sci U S A 97 4649 4653
15. AgarwalR
Cohen-FixO
2002 Phosphorylation of the mitotic regulator Pds1/securin by Cdc28 is required for efficient nuclear localization of Esp1/separase. Genes Dev 16 1371 1382
16. CioskR
ZachariaeW
MichaelisC
ShevchenkoA
MannM
1998 An ESP1/PDS1 complex regulates loss of sister chromatid cohesion at the metaphase to anaphase transition in yeast. Cell 93 1067 1076
17. ShouW
SeolJH
ShevchenkoA
BaskervilleC
MoazedD
1999 Exit from mitosis is triggered by Tem1-dependent release of the protein phosphatase Cdc14 from nucleolar RENT complex. Cell 97 233 244
18. VisintinR
HwangES
AmonA
1999 Cfi1 prevents premature exit from mitosis by anchoring Cdc14 phosphatase in the nucleolus. Nature 398 818 823
19. FutcherAB
CoxBS
1984 Copy number and the stability of 2-micron circle-based artificial plasmids of Saccharomyces cerevisiae. J Bacteriol 157 283 290
20. QueraltE
LehaneC
NovakB
UhlmannF
2006 Downregulation of PP2A(Cdc55) phosphatase by separase initiates mitotic exit in budding yeast. Cell 125 719 732
21. HoltLJ
KrutchinskyAN
MorganDO
2008 Positive feedback sharpens the anaphase switch. Nature 454 353 357
22. StemmannO
ZouH
GerberSA
GygiSP
KirschnerMW
2001 Dual inhibition of sister chromatid separation at metaphase. Cell 107 715 726
23. SullivanM
LehaneC
UhlmannF
2001 Orchestrating anaphase and mitotic exit: separase cleavage and localization of Slk19. Nat Cell Biol 3 771 777
24. UhlmannF
LottspeichF
NasmythK
1999 Sister-chromatid separation at anaphase onset is promoted by cleavage of the cohesin subunit Scc1. Nature 400 37 42
25. StegmeierF
AmonA
2004 Closing mitosis: the functions of the Cdc14 phosphatase and its regulation. Annu Rev Genet 38 203 232
26. SullivanM
UhlmannF
2003 A non-proteolytic function of separase links the onset of anaphase to mitotic exit. Nat Cell Biol 5 249 254
27. KitanoH
2004 Biological robustness. Nat Rev Genet 5 826 837
28. KitanoH
2007 A robustness-based approach to systems-oriented drug design. Nat Rev Drug Discov 6 202 210
29. VisintinR
PrinzS
AmonA
1997 CDC20 and CDH1: a family of substrate-specific activators of APC-dependent proteolysis. Science 278 460 463
30. CharlesJF
JaspersenSL
Tinker-KulbergRL
HwangL
SzidonA
1998 The Polo-related kinase Cdc5 activates and is destroyed by the mitotic cyclin destruction machinery in S. cerevisiae. Curr Biol 8 497 507
31. HildebrandtER
HoytMA
2001 Cell cycle-dependent degradation of the Saccharomyces cerevisiae spindle motor Cin8p requires APC(Cdh1) and a bipartite destruction sequence. Mol Biol Cell 12 3402 3416
32. MichaelS
TraveG
RamuC
ChicaC
GibsonTJ
2008 Discovery of candidate KEN-box motifs using cell cycle keyword enrichment combined with native disorder prediction and motif conservation. Bioinformatics 24 453 457
33. ShirayamaM
ZachariaeW
CioskR
NasmythK
1998 The Polo-like kinase Cdc5p and the WD-repeat protein Cdc20p/fizzy are regulators and substrates of the anaphase promoting complex in Saccharomyces cerevisiae. EMBO J 17 1336 1349
34. VisintinC
TomsonBN
RahalR
PaulsonJ
CohenM
2008 APC/C-Cdh1-mediated degradation of the Polo kinase Cdc5 promotes the return of Cdc14 into the nucleolus. Genes Dev 22 79 90
35. ShirayamaM
TothA
GalovaM
NasmythK
1999 APC(Cdc20) promotes exit from mitosis by destroying the anaphase inhibitor Pds1 and cyclin Clb5. Nature 402 203 207
36. HornigNC
KnowlesPP
McDonaldNQ
UhlmannF
2002 The dual mechanism of separase regulation by securin. Curr Biol 12 973 982
37. UhlmannF
2003 Chromosome cohesion and separation: from men and molecules. Curr Biol 13 R104 114
38. RiveraT
LosadaA
2009 Shugoshin regulates cohesion by driving relocalization of PP2A in Xenopus extracts. Chromosoma 118 223 233
39. RossKE
Cohen-FixO
2003 The role of Cdh1p in maintaining genomic stability in budding yeast. Genetics 165 489 503
40. SarinS
RossKE
BoucherL
GreenY
TyersM
2004 Uncovering novel cell cycle players through the inactivation of securin in budding yeast. Genetics 168 1763 1771
41. AndersKR
KudrnaJR
KellerKE
KinghornB
MillerEM
2009 A strategy for constructing aneuploid yeast strains by transient nondisjunction of a target chromosome. BMC Genet 10 36
42. DeutschbauerAM
JaramilloDF
ProctorM
KummJ
HillenmeyerME
2005 Mechanisms of haploinsufficiency revealed by genome-wide profiling in yeast. Genetics 169 1915 1925
43. Meeks-WagnerD
HartwellLH
1986 Normal stoichiometry of histone dimer sets is necessary for high fidelity of mitotic chromosome transmission. Cell 44 43 52
44. GhaemmaghamiS
HuhWK
BowerK
HowsonRW
BelleA
2003 Global analysis of protein expression in yeast. Nature 425 737 741
45. BuchlerNE
CrossFR
2009 Protein sequestration generates a flexible ultrasensitive response in a genetic network. Mol Syst Biol 5 272
46. FerrellJEJr
1996 Tripping the switch fantastic: how a protein kinase cascade can convert graded inputs into switch-like outputs. Trends Biochem Sci 21 460 466
47. Trinkle-MulcahyL
LamondAI
2006 Mitotic phosphatases: no longer silent partners. Curr Opin Cell Biol 18 623 631
48. BoslWJ
LiR
2005 Mitotic-exit control as an evolved complex system. Cell 121 325 333
49. IngoliaNT
MurrayAW
2004 The ups and downs of modeling the cell cycle. Curr Biol 14 R771 777
50. FunahashiA
JourakuA
MatsuokaY
KitanoH
2007 Integration of CellDesigner and SABIO-RK. In Silico Biol 7 S81 90
51. KitanoH
FunahashiA
MatsuokaY
OdaK
2005 Using process diagrams for the graphical representation of biological networks. Nat Biotechnol 23 961 966
52. ChristiansonTW
SikorskiRS
DanteM
SheroJH
HieterP
1992 Multifunctional yeast high-copy-number shuttle vectors. Gene 110 119 122
53. JaspersenSL
CharlesJF
MorganDO
1999 Inhibitory phosphorylation of the APC regulator Hct1 is controlled by the kinase Cdc28 and the phosphatase Cdc14. Curr Biol 9 227 236
Štítky
Genetika Reprodukční medicínaČlánek vyšel v časopise
PLOS Genetics
2010 Číslo 4
- Kazuistika – Perspektivy využití precizované medicíny v rámci personalizované specifické terapie onkologických pacientů
- Nobelova cena za chemii pro genetické nůžky: Objev, který změní naši budoucnost?
- Technologie na bázi RNA v klinické praxi: od přebarvených petúnií k terapii vzácných a dosud jen obtížně léčitelných chorob u lidí
- „Nepředstavovali jsme si, že náš výzkum povede přímo ke vzniku nových léků, dokonce ještě za našeho života“
- Bezplatné služby pro diagnostiku ATTRv amyloidózy pro kardiology
Nejčtenější v tomto čísle
- Whole-Genome SNP Association in the Horse: Identification of a Deletion in Myosin Va Responsible for Lavender Foal Syndrome
- Admixture Mapping Scans Identify a Locus Affecting Retinal Vascular Caliber in Hypertensive African Americans: the Atherosclerosis Risk in Communities (ARIC) Study
- Genetic Tests for Ecological and Allopatric Speciation in Anoles on an Island Archipelago
- Human Telomeres Are Hypersensitive to UV-Induced DNA Damage and Refractory to Repair
Zvyšte si kvalifikaci online z pohodlí domova
Mazová zátka a její řešení
nový kurzVšechny kurzy