
Parsimonious Determination of the Optimal Infectious Dose of a Pathogen for Nonhuman Primate Models
Exposing nonhuman primates to infectious pathogens (such as tuberculosis, malaria, or the simian equivalent of HIV) is an important model for testing vaccines or other interventions designed to prevent infection or disease. In fact, demonstrating efficacy in animals is often a requirement before clinical testing in humans can be started. A critical variable in such testing is the dose of the pathogen used: this dose should be similar to what humans would encounter. Using too-high a dose may overcome the intervention and mask a successful approach; using too-low a dose may not be relevant. Often, an optimal dose will lead to “successful” infections only a fraction of the times the animal is exposed. A successful intervention experiment therefore needs to use a precisely calibrated dose of the infectious agent; this calibration can only be done by exposing animals to a range of doses and measuring how often they become infected. Here I define the most parsimonious method for performing this calibration: one that uses the least number of animals and procedures. Given the large number of new pathogens being tested in animal models, adoption of such a parsimonious protocol is both economically and ethically warranted, and will thereby enable favorable review of proposed animal use numbers by Institutional Animal Care and Use Committees.
Published in the journal:
. PLoS Pathog 11(8): e32767. doi:10.1371/journal.ppat.1005100
Category:
Research Article
doi:
https://doi.org/10.1371/journal.ppat.1005100
Summary
Exposing nonhuman primates to infectious pathogens (such as tuberculosis, malaria, or the simian equivalent of HIV) is an important model for testing vaccines or other interventions designed to prevent infection or disease. In fact, demonstrating efficacy in animals is often a requirement before clinical testing in humans can be started. A critical variable in such testing is the dose of the pathogen used: this dose should be similar to what humans would encounter. Using too-high a dose may overcome the intervention and mask a successful approach; using too-low a dose may not be relevant. Often, an optimal dose will lead to “successful” infections only a fraction of the times the animal is exposed. A successful intervention experiment therefore needs to use a precisely calibrated dose of the infectious agent; this calibration can only be done by exposing animals to a range of doses and measuring how often they become infected. Here I define the most parsimonious method for performing this calibration: one that uses the least number of animals and procedures. Given the large number of new pathogens being tested in animal models, adoption of such a parsimonious protocol is both economically and ethically warranted, and will thereby enable favorable review of proposed animal use numbers by Institutional Animal Care and Use Committees.
Introduction
The nonhuman primate (NHP) can be the best (or only) experimental model for studies of human infectious pathogens and immunological interventions. NHPs represent the preferred animal models for testing vaccines and therapeutics for HIV, tuberculosis, ebola, and malaria. However, significant ethical and economic constraints accompany such models: the most prominent includes a mandate to use as few animals as possible to achieve statistically significant and biologically meaningful results.
In many NHP models, it is desirable to use a limiting infectious dose as a challenge—a dose which only infects a fraction of animals at each exposure. Such exposures are generally considered to be more physiological [1], and therefore better mimic the potential clinical impact of vaccination or therapeutic intervention. In addition, low dose repeated challenges provides significantly more statistical power to discern effects of intervention [1–3]. To date, the most-used example of this is repeated mucosal challenge with SIV or SHIV for testing vaccines [4–18], microbicides [4,13,19–21], or peri-exposure prophylaxes [22].
Limiting-dose challenge models require careful titration of the infectious agent: using a dose that is too high (and not physiological) may lead to a false negative effect of the intervention [16], whereas a dose that is too low will lead to insufficient infections within the time frame of the experiment to yield useful data, consequently using animals for no gain as well as wasting resources. Even a 2-fold error in the challenge dose can significantly impact the power of an experiment. The goal of the analyses presented here was to define a titration protocol that minimized animal use and procedures while estimating the AID50 to within 1.5-fold of the true value. While much of the discussion is based on NHP (and the SIV model), the protocol is generalizable to any pathogen and any animal model.
A method for estimating infectious doses was published almost 80 years ago [23], Based on this method by Reed and Muench, one would use as many as 48 animals to estimate the AID50. A seminal paper by Spouge [24] used a Bayesian framework to define a method to estimate the AID50 (and its precision). However, the goal at that time was to define a minimal dose infecting all animals in an experiment (e.g., AID99) following intravenous infection (using a purely stochastic model of infection). Here I model infection based in part on Michaelis-Menten kinetics, with the goal of defining a challenge dose that reproducibly infects a fraction of animals; the statistical analysis is similar to a Logit model from Spouge [24,25]. From this, I define a parsimonious protocol to efficiently estimate the AID50 for a pathogen; this protocol will, on average, only use 15 animals.
Results
The principal goal for titrating an infectious agent is to define the outcome response (i.e., probability of infection) as a function of challenge dose. In this regard, a useful quantity is the “50% animal infectious dose” (AID50), the dose which results in infection of 50% of animals after a single challenge. To date, many researchers still rely on modifications of the Reed and Muench method [23], which was never optimized to be parsimonious.
The primary ethical consideration for devising NHP protocols is minimizing the number of animals enrolled while still achieving a statistically significant outcome. Secondary considerations include minimizing the time and number of animal procedures required. In titrating a pathogen for experimental use, these criteria must be balanced against the need to accurately estimate the AID50. Since the titrated pathogen will be used in multiple, expensive, NHP-intensive experiments, it is paramount that the AID50 be determined to within a relatively small error in order to assure success of those experiments. Even a 2-fold error in the AID50 can significantly impact the power of a repeated challenge study.
To define the most efficient protocol for determining the AID50, several approaches were modeled by simulation (using experimental data as a guide). Varying input parameters to the possible titration protocols combined with large numbers of simulations allowed the definition of a titration method that minimizes animal use while maximizing accuracy of the estimated AID50. The optimal proposed protocol was then applied to titration of two virus strains in vivo.
Infection is a stochastic process: even if the challenge dose used in a cohort was the exact AID50, the number of animals infected will most likely deviate from 50%, following a binomial distribution. For example, if 8 animals were challenged with a pathogen at the AID50, there is only a 27% chance that exactly 4 would be infected. As with any measurement that includes statistical random variation, the precision and accuracy of the estimated AID50 from a challenge experiment depends on the number of observations: using more animals per challenge will yield a better estimate.
Indeed, the most accurate determination of the AID50 will occur when the largest number of animals are challenged with a dose closest to the AID50. Therefore, determining the AID50 for a challenge stock of pathogen is typically done by iterative exposures of cohorts of one or more animals to a dilution of the stock [26–28], adjusting the dose between each round to try to achieve 50% infection.
Adjusting the challenge dose between iterative rounds requires an understanding of the relationship between the probability of infection (P) and the challenge dose (D). A precise determination of this relationship is prohibitive; moreover, it may differ by pathogen and experimental conditions. A reasonable hypothesis is that P increases linearly with D at low doses, and asymptotically approaches P = 100% at higher doses. Such a relationship may be modeled by standard first-order linear kinetics, as shown in Fig 1A (where the power term m = 1).

Alternatively, it may be possible that higher order kinetics is suitable, i.e., that infection occurs more likely above a threshold dose, and rapidly saturates above that. This relationship may be modeled by second (m = 2) or third (m = 3; Fig 1A) order kinetics. Furthermore, it is possible that m < 1 is applicable, indicating a mixed reaction (which might occur, for example, by using a swarm of heterogeneous challenge viruses comprising clones with large differences in infection rates, and/or having a distribution in host susceptibility to infection among animals challenged). An example of such a model is also shown in Fig 1A, for m = 0.5.
Most of the analysis in this paper was performed assuming first order kinetics. Indeed, data from an SIV challenge experiment using two doses of virus support the use of first-order kinetics for SIV infection (Table 1). While this relationship may not hold for other pathogens, it is the most reasonable in the absence of data to the contrary. As shown below, the reaction order impacts the efficiency by which AID50 is estimated, but does not impact the choice of optimal experimental parameters.

The best estimate of the “true” AID50 occurs with the most measurements occurring in the linear phase of the response curve (i.e., close to the AID50). For example, challenging many animals at a high dose will result in nearly uniform infection, providing little information about the actual dose (was the challenge dose too high by 100x? or 10x?). Similarly, challenging animals at too low a dose, where none or few are infected, also provides little precision for estimating the AID50. However, this case is fundamentally different than challenging at too-high a dose: here, most animals remain uninfected, and can be re-challenged with an adjusted (increased) dose. With too-high dose, new animals must be enrolled into the titration study.
To define the optimal titration experiment, an iterative protocol was modeled by Monte Carlo simulation. This iterative approach includes two phases: phase 1, a dose-ranging study, during which the challenge dose is modified following each round, until termination criteria have been met; and phase 2, during which any uninfected exposed animals from phase 1 are repeatedly challenged until infected in order to refine the estimate of the AID50.
Re-using exposed but uninfected animals can only be done if exposure does not change subsequent risk of infection. Such a change could occur actively: exposure could “vaccinate” the animal, or engage an innate response, so that the animal becomes more resistant to subsequent challenge. It is also possible that there is a heterogeneity in the innate susceptibility to infection, and over time, repeated exposures will select for such animals. Such a process might skew the statistical analysis of infection data, and one may wish to set a cap on the total number of exposures of any single animal after which data from that animal is censored.
These risks must be evaluated for each pathogen. In the case of SIV, there is no evidence for a decline in infection probability following multiple exposures [29] (Fig 1B). Thus, for this model, uninfected exposed animals can be re-challenged to provide more data for the infection-dose response curve. Nonetheless, the impact of limiting the total number of exposures for any given animal in a titration protocol was evaluated.
The outcome response was defined as in Fig 1A; input parameters to the simulation included the number of animals challenged at each round (NC), the starting dose of challenge (initial estimate, D0, as a fraction of the AID50), the desired precision of the final estimate of AID50 (σT), and the maximum number of exposures for any given animal (EMAX). The outputs of the simulation were the total number of animals enrolled (n), the total number of rounds during phase 1, and the distribution of estimated AID50 for all simulations. The flowchart shown in Fig 2 outlines the protocol.

The accuracy of the estimate of the AID50 is greatest when 50% of animals challenged are infected. However, because of the stochastic nature of the infection, there is a good chance that this outcome is possible even with a challenge dose that is not near the AID50 (particularly for small values of NC). For example, at a 0.25 AID50, the probability of infection (P) is 20%; in a cohort of 4 animals using this low dose, the chance of two or more animals becoming infected with one challenge is nearly one in five. Such an outcome would lead to erroneous dose de-escalation, or, if the accuracy criterion was too loose (i.e., a large σT), a termination of the titration with an AID50 estimate off by a factor of 4.
In initial simulations, the probability of premature termination (with a final estimated AID50 well off the actual value) occurred too frequently when fewer than 12 animals had been enrolled. Hence, the procedure includes a Phase 1 termination criterion that the estimate of AID50 must be based on a minimum of 12 animals.
A large number of simulations were performed, simultaneously varying the four input parameters over reasonable ranges (S1 and S2 Tables). Fig 3 shows the distributions of output values for a selection of the simulations, in order to illustrate how the outcomes depend on these values.
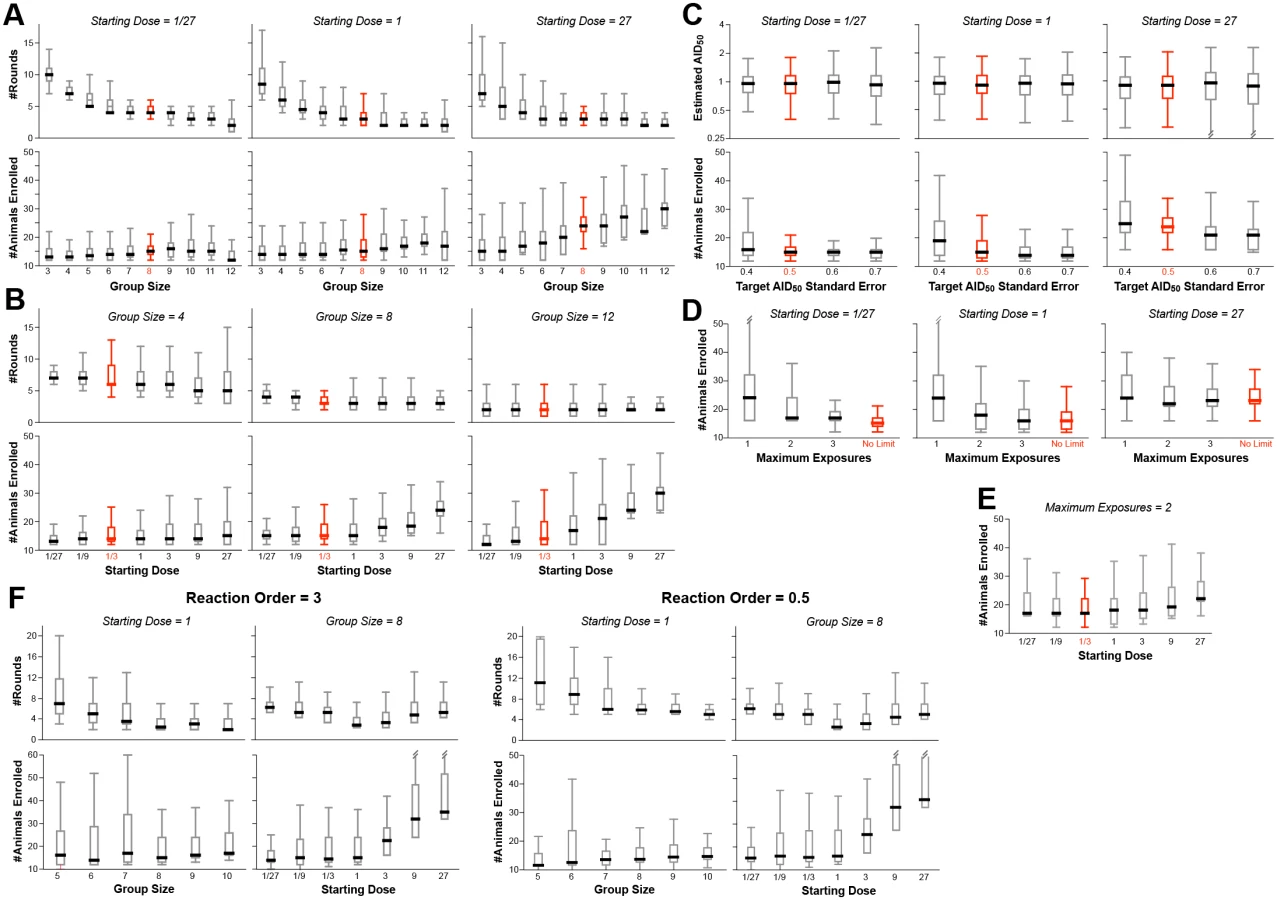
The number of animals required for the study is fairly constant when the initial challenge dose (D0) is at or below the actual AID50, irrespective of group size (Fig 3A and 3B). This is because of the reuse of uninfected animals for subsequent rounds. In contrast, if the number of exposures per animal (EMAX) is limited, the number of animals required increases as D0 deviates in either direction from the actual AID50 (Fig 3D and 3E).
With small group sizes (NC < 8), the number of rounds in Phase 1 increases dramatically as D0 decreases (Fig 3A)—requiring far more time and re-exposures of uninfected animals. This cost in efficiency is not offset by a decreased requirement for total number of animals—hence the recommendation that NC = 8.
If the infectivity of the pathogen is completely unknown, it is may be best to start with a pre-dose ranging study using one or two animals, with a very low dose, and doing step-wise 10-fold increasing challenge doses until infection is achieved: this now can be used as D0 for the main protocol.
The major termination criterion for Phase 1 is achieving a standard error on the estimate of AID50 (σT) that is below 0.5 (50%). Changing this threshold to higher values reduces the number of animals required (Fig 3C)—but at a higher risk of an inaccurate final AID50 estimate. Notably, the risk of underestimating the AID50 is greater than overestimating it; if underestimating the AID50 is an acceptable risk, then the titration protocol can be made more parsimonious by increasing σT to 60% or 70%. Doing so does not change the optimal value of 8 for NC (S1 Table).
In models where exposure to the pathogen substantially changes subsequent risk of infection, every animal should only be challenged once irrespective of outcome (EMAX = 1, Fig 3D). Simulations performed with such a restriction showed that the optimal parameters are unchanged, i.e., NC = 8 and σT = 0.5. Of course, the inability to re-use uninfected animals significantly increases the total number required (Fig 3D and 3E).
Simulations were performed on a model infection system with 3rd order infection kinetics (“threshold infection”; m = 3 in Fig 1A). As shown in Fig 3F, the patterns of outcome dependencies on input parameters is similar to first order kinetics, but requiring more animals and more rounds. This occurs because of the steepness of the response curve (Fig 1A)–i.e., small variations in infection frequency (arising from the stochastic nature of infection) lead to much larger errors in estimating the AID50 when the infection frequency is not near 50%.
This protocol was followed to titrate two SIV strains in vivo (Fig 4). Titration of FL14-TR (Fig 4A) began with a challenge dose of 20 μl of stock diluted into 1 ml (based on estimates from the TCID50 of the stock). 4/8 (50%) of animals were infected, resulting in no change in the estimated AID50, which, after one round, had an error of 76%. In round 2 of this challenge dose, only 3 of 8 animals became infected, necessitating an increase in the AID50 estimate, to 25 μl. At this point, 12 animals were enrolled and the error on the estimate was 52%, so the decision was made to enter phase 2 (and not enroll additional animals). By the end, with 12 animals, there were a total of 31 challenges with 12 infections at a range of doses, and the final AID50 estimate was 50 ± 41%.

Fig 4B illustrates the titration of a SIV FL14-AK stock. Because this stock is more concentrated (by TCID50), the initial challenge dose was selected to be 12.5 μl in round 1. 3 of 8 animals were infected, so round 2 used dose of 20 μl—resulting in 100% infection. For round 3, only 6 animals were available, and a much lower dose was used. While the threshold to enter phase 2 was barely met following the 3rd round, a decision was made to enroll four more animals prior to initiating phase 2. The final AID50 estimate, based on 21 animals and 32 challenges was 5.7 ± 37%.
Fig 4 also compares statistical estimation of the AID50 and its precision based on the first order kinetics model described here, and the Logit model described by Spouge [24,25]; the latter has a web-based calculator. Overall, the progressive estimates of AID50 are highly comparable; the confidence interval reported by the Logit model is about 50% higher (presumably, a different interval). Thus, if using the online calculator, multiply the error estimate by 0.67 to convert to the σT used here, or (equivalently) use a termination σT that is 1.5x larger than suggested here.
Discussion
From these data, and based on the optimization criteria (in order of priority: minimum number of animals, minimum number of rounds in Phase 1, maximum accuracy on the AID50 estimate), the optimum parameter values were selected. Specifically, the number of animals per cohort (NC) should be 8 (with 7 being close to optimal); the target precision (σT) should be 0.5 (with 0.6 being close); and the maximum number of exposures per animal (EMAX) should be unlimited (with 3 being close to optimal). If any information about the likely AID50 is known (e.g., from previous experiments), then a starting challenge dose (D0) should be between 0.1 and 1 AID50.
Using as many as 8 animals per round may seem unintuitive—for example, why is NC = 4 less efficient? There are two reasons for this: First, the criterion for precision (σT < 0.5) is heavily dependent on the total number of exposures in the experiment—thus, using four animals will usually double the number of rounds in the experiment (increasing time and resources) without reducing the eventual number of animals. Second, a four animal cohort presents a much larger risk of a obtaining an outlier outcome (due to the stochastic nature of the infections), leading to incorrect dose adjustment for the following round.
Fig 4B illustrates this risk. In this titration, only 3 of 8 animals were infected despite using what turned out to be a challenge dose that was ~2-fold above the actual AID50. Based on Fig 1A, using this dose is expected to infect 68% of animals challenged once; the odds of having 3 or fewer of 8 infected is low (8%) but not insubstantial. Were this the extent of the titration, a future (large) study would have used this or even higher challenge dose. By following the procedure specified here, this statistical anomaly was overcome.
The length of time required to determine the outcome of a challenge will define the length of each round. For example, with a titration of highly pathogenic SIV, infection usually be determinable by day seven and always by day 10. Thus, each subsequent round will likely be initiated two weeks apart. In contrast, during phase 2, this step can be accelerated. For example, an animal might be infected during the first round of phase 2, and then re-challenged one week later when its infection status is still unknown. The animal would become viral positive day 10 (i.e., a few days after the second challenge of round 2), indicating that it actually became infected after the first round and that the subsequent challenge should be discounted. This ambiguity at day seven, fully resolved before day 14 (i.e., 3rd round), does not impact the analysis of the phase 2 data. However, such ambiguity is not appropriate for phase 1, where challenges must be spaced with sufficient delay to positively establish infection.
However, other pathogens may require considerably more time between rounds in phase I. For example, in titrating a stock of SHIV 162p3, we found that some animals did not become viremic until day 14, and adopted a 3 week cycle for titrations. With mTB, infection may not be clinically evident until four weeks post-exposure, and the cycle time needs to be commensurately higher.
The number of animals enrolled in phase 2 is between zero and NC (i.e., the number of uninfected animals remaining from the last round of phase 1). At this point, a fairly accurate estimate of the AID50 is available, so phase 2 will usually require no more than 3–4 rounds to infect the remaining animals. Therefore, the total time required for this titration protocol will be, on average, four rounds for phase 1 and three rounds for phase 2. In the example of titration of an SIV, where each round in phase 1 requires two weeks and each round in phase 2 requires one week, the total time for the titration should be expected to be 11 weeks. In our in vivo examples (Fig 4), titration of FL14 was finished in 8 weeks, and FL14-AK in 12 weeks. Of course, the total time will depend on the specific requirements of each pathogen and system, and the timing between rounds should be adjusted accordingly.
Many variations of titration protocols were evaluated, including (i) using smaller group sizes during initial rounds of Phase 1 and larger group sizes when narrowing in on the true AID50, (ii) other modes of variable group sizes; and (iii) eliminating Phase 2. Most alternatives performed worse in by requiring more animals and/or more time and procedures. The scripts created for the simulations reported here can be modified to test any configuration of the titration protocol that might be considered for a given pathogen.
It should be noted that this protocol returns an estimate of the average AID50 for a cohort of animals, and will be valid for an experimental cohort that is matched for relative infection rates. For example, this protocol could be used for titration of a virus used in intravaginal challenge where the infection risk varies by time in the menstrual cycle. The best results will be obtained by challenging both titration and experimental animals at the same point in the menstrual cycle. But as long as the challenge time points are equivalently randomized across the menstrual cycle in both the titration and experimental cohorts, the estimate of the AID50 will still be valid.
Most of the modeling assumed a uniform infection rate for the viruses in the challenge stock (i.e., by setting m = 1). If a swarm of genetically distinct viruses is used, in which clonal variation in infection efficiency is present, then the result may be a mixed kinetics of infection (i.e., m < 1). Modeling even a severe example of this (m = 0.5) resulted in the same optimal parameter values, albeit the total number of animals (and rounds) may increase (or even decrease in some cases).
A somewhat different model for the infecting dose response was used by Spouge his seminal paper [24]. While the motivations and goals of that paper were different than for this paper, either model can be used to estimate the AID50 (Fig 4). A difference between the Spouge model and the model used here is in the estimate of the precision of the AID50 (σT), which differ by a factor of about 1.5. Consequently, if using the convenient online calculator (select the “Logit” fit) [25], multiply the error estimate by 0.67 to approximate σT as used here.
In some experiments, it may be desirable to use a higher (e.g., AID80) or lower (e.g. AID20) challenge dose. These doses can be estimated from the following formula (assuming, based on the estimated AID50, where “x” is the desired percentage of successful infections:

In summary, an optimized pathogen titration protocol is presented (Fig 2) to determine with good precision the limiting infectious dose of a pathogen, a dose which may be critical for testing interventions [16]. On average (90% range in parentheses), the protocol will enroll 15 (12–25) animals, require 3 (2–5) phase 1 rounds, and result in an estimate of the AID50 within 40% of the true value.
The protocol defined here is generalizable to any pathogen and any animal model. However, it is most critical for NHP models, where ethical considerations mandate minimization of animal use. This protocol and the analyses reported here will aid in the preparation of an Animal Study Proposal (ASP) for the purposes of defining the characteristics of an NHP-infectious agent. Finally, these analyses provide a statistical justification for animal numbers in the ASP, as required for Institutional Animal Care and Use Committee (IACUC) review and approval. Importantly, by following the method described here, investigators can minimize the number of animals and resources needed to define an infectious pathogen challenge dose in NHPs.
Methods
Data in Fig 1B and Table 1 from a large vaccine/challenge study, VRC 10–332, the results of which have been published [15]. Data in Fig 4 represent titration of two VRC-amplified challenge stock of SIV strains, administered intrarectally, in rhesus macaques (VRC 13–444). Blood was collected weekly during the challenge phase for viral load quantification.
All simulations and statistical analyses were performed in JMP versions 10 and 11 (SAS Institute, Cary, NC). Simulation scripts and data tables are available by request to the author. A simple JMP document that includes a script to calculate the AID50 as well as the precision (σT) is also available by request. In this context, σT is the approximate standard error of the regression; according to the software documentation, “it is formed by the product of the RMSE and the square root of the diagonals of the derivative cross-products matrix inverse.”
Ethics Statement
All in vivo procedures were carried out in accordance to institutional, local, state, and national guidelines and laws governing research in animals including the Animal Welfare Act. The animal protocols “VRC ASP 10–332” and “VRC ASP 113–444” and the procedures were reviewed and approved by the Animal Care and Use Committee (ACUC) of both the Vaccine Research Center (in accordance to all the NIH policy and guidelines) as well as the Institutional Animal Care and Use Committee (IACUC) of Bioqual, Inc. where non-human primates were housed for the duration of the study. Bioqual Inc., and the NIH are both accredited by the Association for Assessment and Accreditation of Laboratory Animal Care (AAALAC) and are in full compliance with the Animal Welfare Act and Public Health Service Policy on Humane Care and Use of Laboratory Animals. In accordance to the institutional policies of both institutions, all compatible non-human primates are always pair-housed, and single housing is only permissible when scientifically justified or for veterinary medical reasons, and for the shortest duration possible.
Non-human primates were housed in appropriately sized caging according to the Guide for the Care and Use of Laboratory Animals, 8th ed., and supplemented with a variety of enrichment toys, treats, fresh produce, and foraging devices. Water was offered ad libitum and monkeys were fed primate biscuits (Monkey Diet, 5038, Lab diet, St. Louis, MO) twice daily. Animal holding rooms were maintained on a 12 hour light/dark cycle, room temperature of 60-70F, and relative humidity between 30 to 70% as standard practice.
The studies being performed support HIV/AIDS research and, as addressed in the Weatherall report, non-human primates were an appropriate animal model for this infectious disease. In order to ensure that animal use was not duplicated, literature searches were performed using several key words related to the study. Specific intervention and endpoint criteria tables were integrated into the protocols. Facility veterinarians were familiarized with the disease model and progression to minimize any associated pain or distress, and to perform euthanasia as directed in the approved ACUC and IACUC protocols.
Supporting Information
Zdroje
1. Regoes RR, Longini IM, Feinberg MB, Staprans SI (2005) Preclinical assessment of HIV vaccines and microbicides by repeated low-dose virus challenges. PLoS Med 2: e249. 16018721
2. Hudgens MG, Gilbert PB (2009) Assessing vaccine effects in repeated low-dose challenge experiments. Biometrics 65 : 1223–1232. doi: 10.1111/j.1541-0420.2009.01189.x 19397589
3. Hudgens MG, Gilbert PB, Mascola JR, Wu CD, Barouch DH, et al. (2009) Power to detect the effects of HIV vaccination in repeated low-dose challenge experiments. J Infect Dis 200 : 609–613. doi: 10.1086/600891 19591571
4. Barouch DH, Klasse PJ, Dufour J, Veazey RS, Moore JP (2012) Macaque studies of vaccine and microbicide combinations for preventing HIV-1 sexual transmission. Proc Natl Acad Sci U S A 109 : 8694–8698. doi: 10.1073/pnas.1203183109 22586094
5. Ellenberger D, Otten RA, Li B, Aidoo M, Rodriguez IV, et al. (2006) HIV-1 DNA/MVA vaccination reduces the per exposure probability of infection during repeated mucosal SHIV challenges. Virology 352 : 216–225. 16725169
6. Garcia-Lerma JG, Otten RA, Qari SH, Jackson E, Cong ME, et al. (2008) Prevention of rectal SHIV transmission in macaques by daily or intermittent prophylaxis with emtricitabine and tenofovir. PLoS Med 5: e28. doi: 10.1371/journal.pmed.0050028 18254653
7. Hansen SG, Vieville C, Whizin N, Coyne-Johnson L, Siess DC, et al. (2009) Effector memory T cell responses are associated with protection of rhesus monkeys from mucosal simian immunodeficiency virus challenge. Nat Med 15 : 293–299. doi: 10.1038/nm.1935 19219024
8. Hessell AJ, Poignard P, Hunter M, Hangartner L, Tehrani DM, et al. (2009) Effective, low-titer antibody protection against low-dose repeated mucosal SHIV challenge in macaques. Nat Med 15 : 951–954. doi: 10.1038/nm.1974 19525965
9. Letvin NL, Rao SS, Dang V, Buzby AP, Korioth-Schmitz B, et al. (2007) No evidence for consistent virus-specific immunity in simian immunodeficiency virus-exposed, uninfected rhesus monkeys. J Virol 81 : 12368–12374. 17686853
10. Letvin NL, Rao SS, Montefiori DC, Seaman MS, Sun Y, et al. (2011) Immune and Genetic Correlates of Vaccine Protection Against Mucosal Infection by SIV in Monkeys. Sci Transl Med 3 : 81ra36. doi: 10.1126/scitranslmed.3002351 21543722
11. Ma ZM, Abel K, Rourke T, Wang Y, Miller CJ (2004) A period of transient viremia and occult infection precedes persistent viremia and antiviral immune responses during multiple low-dose intravaginal simian immunodeficiency virus inoculations. J Virol 78 : 14048–14052. 15564513
12. McDermott AB, Mitchen J, Piaskowski S, De Souza I, Yant LJ, et al. (2004) Repeated low-dose mucosal simian immunodeficiency virus SIVmac239 challenge results in the same viral and immunological kinetics as high-dose challenge: a model for the evaluation of vaccine efficacy in nonhuman primates. J Virol 78 : 3140–3144. 14990733
13. Otten RA, Adams DR, Kim CN, Jackson E, Pullium JK, et al. (2005) Multiple vaginal exposures to low doses of R5 simian-human immunodeficiency virus: strategy to study HIV preclinical interventions in nonhuman primates. J Infect Dis 191 : 164–173. 15609225
14. Reynolds MR, Weiler AM, Piaskowski SM, Kolar HL, Hessell AJ, et al. (2010) Macaques vaccinated with simian immunodeficiency virus SIVmac239Delta nef delay acquisition and control replication after repeated low-dose heterologous SIV challenge. J Virol 84 : 9190–9199. doi: 10.1128/JVI.00041-10 20592091
15. Roederer M, Keele BF, Schmidt SD, Mason RD, Welles HC, et al. (2013) Immunological and virological mechanisms of vaccine-mediated protection against SIV and HIV. Nature.
16. Vaccari M, Keele BF, Bosinger SE, Doster MN, Ma ZM, et al. (2013) Protection afforded by an HIV vaccine candidate in macaques depends on the dose of SIVmac251 at challenge exposure. J Virol 87 : 3538–3548. doi: 10.1128/JVI.02863-12 23325681
17. Van Rompay KK, Abel K, Lawson JR, Singh RP, Schmidt KA, et al. (2005) Attenuated poxvirus-based simian immunodeficiency virus (SIV) vaccines given in infancy partially protect infant and juvenile macaques against repeated oral challenge with virulent SIV. J Acquir Immune Defic Syndr 38 : 124–134. 15671796
18. Wilson NA, Reed J, Napoe GS, Piaskowski S, Szymanski A, et al. (2006) Vaccine-induced cellular immune responses reduce plasma viral concentrations after repeated low-dose challenge with pathogenic simian immunodeficiency virus SIVmac239. J Virol 80 : 5875–5885. 16731926
19. Dereuddre-Bosquet N, Morellato-Castillo L, Brouwers J, Augustijns P, Bouchemal K, et al. (2012) MiniCD4 microbicide prevents HIV infection of human mucosal explants and vaginal transmission of SHIV(162P3) in cynomolgus macaques. PLoS Pathog 8: e1003071. doi: 10.1371/journal.ppat.1003071 23236282
20. Singer R, Mawson P, Derby N, Rodriguez A, Kizima L, et al. (2012) An intravaginal ring that releases the NNRTI MIV-150 reduces SHIV transmission in macaques. Sci Transl Med 4 : 150ra123. doi: 10.1126/scitranslmed.3003936 22956201
21. Veazey RS (2008) Microbicide safety/efficacy studies in animals: macaques and small animal models. Curr Opin HIV AIDS 3 : 567–573. doi: 10.1097/COH.0b013e32830891bb 19373023
22. Cranage M, Sharpe S, Herrera C, Cope A, Dennis M, et al. (2008) Prevention of SIV rectal transmission and priming of T cell responses in macaques after local pre-exposure application of tenofovir gel. PLoS Med 5: e157; discussion e157. doi: 10.1371/journal.pmed.0050157 18684007
23. Reed LJ, Muench H (1938) A Simple Methodd of Estimating Fifty Per Cent Endpoints. Amer J of Hygeine 27 : 493–407.
24. Spouge JL (1992) Statistical analysis of sparse infection data and its implications for retroviral treatment trials in primates. Proc Natl Acad Sci U S A 89 : 7581–7585. 1323844
25. Spouge JL (2015) Infectious Dose or Dilution (ID50) Server. <http://www.ncbi.nlm.nih.gov/CBBresearch/Spouge/html_ncbi/html/id50/id50.cgi>
26. Dittmer U, Stahl-Hennig C, Coulibaly C, Nisslein T, Luke W, et al. (1995) Repeated exposure of rhesus macaques to low doses of simian immunodeficiency virus (SIV) did not protect them against the consequences of a high-dose SIV challenge. J Gen Virol 76 (Pt 6): 1307–1315. 7782761
27. Lewis MG, Bellah S, McKinnon K, Yalley-Ogunro J, Zack PM, et al. (1994) Titration and characterization of two rhesus-derived SIVmac challenge stocks. AIDS Res Hum Retroviruses 10 : 213–220. 8198874
28. Pauza C, Wallace M (2002) The Role for Nonhuman Primate Models in the Development and Testing of AIDS Vaccines. In: Wong-Staal F, Gallo R, editors. AIDS Vaccine Research: CRC Press. pp. 287–309.
29. Regoes RR (2012) The role of exposure history on HIV acquisition: insights from repeated low-dose challenge studies. PLoS Comput Biol 8: e1002767. doi: 10.1371/journal.pcbi.1002767 23180981
Štítky
Hygiena a epidemiologie Infekční lékařství LaboratořČlánek vyšel v časopise
PLOS Pathogens
2015 Číslo 8
- Parazitičtí červi v terapii Crohnovy choroby a dalších zánětlivých autoimunitních onemocnění
- Vakcíny proti klíšťové encefalitidě
- Kdy je nejlepší očkovat
- Možné vedlejší účinky očkování
- Imunogenita vakcín
Nejčtenější v tomto čísle
- Human Non-neutralizing HIV-1 Envelope Monoclonal Antibodies Limit the Number of Founder Viruses during SHIV Mucosal Infection in Rhesus Macaques
- Type VI Secretion System Toxins Horizontally Shared between Marine Bacteria
- Illuminating Targets of Bacterial Secretion
- Are Human Intestinal Eukaryotes Beneficial or Commensals?
Zvyšte si kvalifikaci online z pohodlí domova
Mazová zátka a její řešení
nový kurzVšechny kurzy