
Estimation of the cost-effectiveness of HIV prevention portfolios for people who inject drugs in the United States: A model-based analysis
In a modeling study, Cora Bernard and colleagues examine the cost-effectiveness of opioid agonist therapy (OAT), needle-syringe exchange programs (NSP), screening and intensive antiretroviral therapy programs (Test & Treat), and oral HIV pre-exposure prophylaxis (PrEP) for prevention of HIV in people who inject drugs.
Published in the journal:
. PLoS Med 14(5): e32767. doi:10.1371/journal.pmed.1002312
Category:
Research Article
doi:
https://doi.org/10.1371/journal.pmed.1002312
Summary
In a modeling study, Cora Bernard and colleagues examine the cost-effectiveness of opioid agonist therapy (OAT), needle-syringe exchange programs (NSP), screening and intensive antiretroviral therapy programs (Test & Treat), and oral HIV pre-exposure prophylaxis (PrEP) for prevention of HIV in people who inject drugs.
Introduction
Over the past decade, injection drug use, particularly heroin injection, has increased across most US demographic groups, making substance-abuse-related mortality and morbidity a public health crisis [1]. In 2014, there were 47,055 deaths from drug overdose in the US, with almost 30,000 due to opioid overdose [2]. Because HIV spreads relatively efficiently through the transfer of blood in shared injecting equipment [3], people who inject drugs (PWID) account for a disproportionate share of HIV prevalence and incidence in the US [4,5]. Although HIV prevalence and incidence among US PWID have been falling over the past decade [4,6,7], recent growth in the size of the injecting population has raised concerns that HIV risks could rise [8]. Programs targeted to PWID, which have the additional benefit of preventing downstream sexual transmission of HIV to others in the population, are therefore a public health priority. Given the current epidemic of injection drug use in the US, benefits that extend beyond HIV prevention are also a critical consideration [1,8].
A recent empirical study demonstrated that a combined prevention strategy effectively halted HIV epidemics in PWID populations [9]. This strategy included opioid agonist therapy (OAT), which reduces injecting frequency [10,11], needle and syringe programs (NSPs), which reduce injection equipment sharing [12], and enhanced services for HIV testing and treatment (Test & Treat), which identify and virally suppress infected individuals by enrolling them in antiretroviral therapy (ART) [13,14]. Additionally, the US Centers for Disease Control and Prevention (CDC) now recommends daily oral pre-exposure prophylaxis (PrEP), which reduces uninfected individuals’ risk of acquiring HIV, for PWID [15]. Although all of these programs have demonstrated efficacy, they have diverse delivery methods and target populations, as well as different costs and anticipated benefits, and have not been modeled comparatively in a cost-effectiveness context.
The complexity of transmission dynamics and intervention scenarios makes it difficult to deduce a priori the highest value portfolio of prevention programs for PWID. To address this, we extended an empirically calibrated model of the US HIV epidemic [16] to assess the cost-effectiveness of alternative HIV prevention portfolios for US PWID. Each portfolio included some combination of OAT, NSPs, Test & Treat, and PrEP scaled to various coverage levels. Our model integrated clinical, epidemiologic, and economic data and captured the dynamic accrual of total population costs and benefits by tracking the spread of HIV through injection-based and sexual transmission routes.
Methods
Overview
Our analysis builds on a previously published dynamic compartmental model of the US HIV epidemic [16]. A simplified schematic (Fig 1) illustrates how the model stratifies the adult population aged 18–64 y by HIV infection and awareness status, CD4 count, ART status, OAT status, and risk group. We instantiated the model with US data (Table 1) and calibrated it to match a range of targets, including CDC estimates of US HIV prevalence [5,17–21] and incidence [4,21] across all risk groups. The model consists of a system of differential equations programmed in Matlab R2015b (MathWorks) that track compartment populations monthly from 2015 to 2035. We used a societal perspective to calculate the costs, quality-adjusted life years (QALYs), and incremental cost-effectiveness ratios (ICERs) associated with each portfolio of interventions. Costs and QALYs were measured over the lifetimes of all individuals active in the model over the 20-y time horizon and were discounted at 3% annually [22,23]. We also measured health outcomes such as HIV infections averted and change in HIV prevalence.


Model structure and flows
The majority of the modeled population is considered low-risk heterosexual. Consistent with CDC estimates, PWID and men who have sex with men (MSM) are smaller populations with higher initial HIV prevalence and HIV-related risk behaviors [5,21]. Between 2015 and 2035, US birth cohorts age into the model when they turn 18 y, and individuals either age out of the actively injecting population at age 65 y or die (at age <65 y) at background mortality rates adjusted for risk behavior [31,48,55], HIV infection, and ART status [39,40,42,43,47]. Additional Markov models follow individuals who mature out and those alive at the end of the 20-y analytic time horizon to capture all lifetime costs and benefits (S1 Appendix, Section 1). The model tracks incident infections, disease progression, HIV screening, enrollment in ART, and transitions into and out of OAT.
Through calibration, the model reflects HIV infection risks given current OAT, NSP, Test & Treat, and PrEP coverage. We assume that PWID, when they do share injecting equipment, are equally likely to share with any other PWID [17,27,28,38,44]. Injection-based HIV transmission depends on the infected partner’s HIV stage [3,41] and ART status [13,14], along with the uninfected partner’s use of PrEP [13]. Sexual mixing patterns approximate partnerships among and between risk groups, with transmission between sero-discordant partners additionally depending on male condom use [18–20,27,29,38,56], condom effectiveness [57], and whether both partners are MSM [3].
Upon infection, an individual enters a brief but highly infectious acute stage [3,41,58], followed by asymptomatic HIV (CD4 count 500 to 1,200 cells/mm3), symptomatic HIV (CD4 count >200 to <500 cells/mm3), and AIDS (CD4 count ≤ 200 cells/mm3) [25,41,47]. As CD4 count falls, infectivity increases [3,41,58] and quality of life decreases [44,59]. ART moderates these effects, reducing injection-based transmission by 59% [13,44] and sexual transmission by 90% [14,41,44], and extends life expectancy by suppressing HIV viral load [40,42,43]. To be eligible for ART, an individual must first be diagnosed with HIV infection, at which time that person may also modify risk behaviors, such as injection equipment sharing or condom usage [18,27,29,38]. In the model, HIV detection rates depend on risk group and are higher in symptomatic HIV compartments [47].
Although the model captures multiple risk groups in order to calibrate to the US HIV epidemic, all interventions in this analysis are directed exclusively to PWID. Program scale-ups are incremental to the status quo, which assumes baseline 2015 levels of OAT, NSP, Test & Treat, and PrEP coverage. Scale-ups to low, medium, and high coverage levels were chosen to standardize comparisons and provide intuition for program costs, benefits, and interactions as coverage increases. In practice, feasible enrollment levels in terms of budget and participant retention are likely to vary by community.
Opioid agonist therapy
Methadone and buprenorphine are the most common pharmacological therapies prescribed as OAT in the US [10]. We assume that OAT decreases the number of injections by 55% [10,11], thereby reducing overdose risk [27,31] and the chance of HIV transmission, and improving quality of life [27,28,32]. Additionally, we assume that individuals on OAT have higher HIV screening rates than the general PWID population and are more likely to connect to ART services if diagnosed [60,61]. OAT also provides the sole pathway by which individuals permanently cease drug use (3.6% annually) and move to a lower-risk population [28,30]. Previous analyses of the costs and benefits of OAT have consistently found it to be cost-effective [28,62,63].
We assume that 25% of PWID receive OAT under the status quo [17,18,27–29]. At low, medium, and high coverage levels, enrollment increases to 40%, 45%, and 50% of the PWID population, respectively. Such scale-up would involve both short-term investments (e.g., overhead costs for starting methadone clinics) and the long-term costs of delivering the therapies themselves [27,28,33]. In sensitivity analyses, we varied parameters affecting OAT’s effectiveness and cost.
Needle and syringe programs
In the model, NSP broadly refers to any of a range of local programs, such as those at pharmacies, hospitals, or designated facilities, through which PWID access sterile hypodermic injecting equipment [64]. We assume that NSPs reduce equipment sharing by 45% [12,34]. Despite being considered a cost-effective HIV prevention strategy [35,65], social and political barriers often prevent NSP expansion [66], and it remains the most controversial of PWID-targeted interventions.
We calibrated our analysis to the current effects of NSPs, which we assume to be minimal at a national level in the status quo [37,67]. Low, medium, and high coverage levels expand NSPs to reach 40%, 45%, and 50% of PWID, respectively. We assume a fixed annual operating budget for NSPs, and low scale-up costs [35–37]. We varied the estimated costs and effectiveness of NSPs in sensitivity analyses.
HIV testing and treatment
US guidelines recently eliminated a CD4 count threshold for ART initiation and now recommend immediate ART following diagnosis [68]. US cities adopting this policy have used aggressive HIV testing, same-day treatment initiation, and routine follow-up to significantly increase overall viral suppression [69,70]. Previous analyses of Test & Treat in the US have found favorable cost-effectiveness ratios [44,47,71], and while PWID remain a difficult demographic to reach and sustain in care [70], other community-based interventions targeted exclusively to high-risk populations have demonstrated the potential for sustained case management for PWID [49].
Our status quo reflects current ART engagement levels [27,39,40], with risk group determining the probability that a newly diagnosed individual becomes virally suppressed [40,72]. At low, medium, and high coverage levels of Test & Treat, 40%, 45%, and 50% of infected PWID, respectively, enroll in sustained ART care by 2035. (Because an infection must occur before enrollment in Test & Treat, this intervention, unlike the others, cannot scale immediately in the model.) Costs associated with Test & Treat include those of screening, diagnosis confirmation, counseling, and ART [44,47,48,50,51], as well as the associated costs of comprehensive community-based care programs [49]. We varied the parameters determining enrollment probability (calibrated to additionally reflect the phenomenon of loss to follow-up), program costs, and participant quality-of-life benefits in sensitivity analyses.
Pre-exposure prophylaxis
Our previous analysis [16] found that PrEP, a daily oral pill of 300 mg tenofovir disoproxil fumarate and 200 mg emtricitabine (Truvada), is most valuable for PWID when delivered per the CDC’s clinical guidelines (e.g., HIV screening every 3 mo, toxicity monitoring every 6 mo) [15] and with prompt and sustained provision of ART for those who do become infected. Nonetheless, PrEP for PWID is expensive in terms of total budget outlay and ICER, although it could be considered cost-effective in the highest prevalence communities [16].
Our status quo assumes negligible PrEP use among PWID in 2015. At low, medium, and high coverage levels, 40%, 45%, and 50% of uninfected PWID, respectively, receive PrEP. The direct costs of PrEP reflect the costs of Truvada [48,53,54] as well as ongoing monitoring costs [48,51]. We assume that the PrEP enrollment process modestly increases HIV screening for the entire PWID population and that individuals diagnosed with HIV discontinue PrEP immediately [15].
Economic model
Each compartment is associated with an annual cost (adjusted for inflation to 2015 US dollars [73]) and QALY value depending on the characteristics of that subpopulation. A one-time scale-up cost is additionally associated with each intervention (S1 Appendix, Section 3). For every individual in the model, discounted costs and QALYs accrue at each time step, yielding a total cost and QALY estimate for each scenario. We also include lifetime costs and QALYs for individuals maturing out of the population and for individuals alive in the population at the end of the modeled time horizon (S1 Appendix, Section 1). We calculate ICERs by comparing the incremental discounted costs and QALYs for each scenario to the next best alternative [23].
Model calibration
We used a random search algorithm to repeatedly sample from estimated distributions for each model input and then empirically fit the model to US epidemiologic data, resulting in 182 calibrated parameter sets (S1 Appendix, Section 2) [74,75]. Ranges on parameter values are presented in Table 1. We performed all analyses over the calibrated sets to incorporate parameter uncertainty [76]. We present the averages over these sets as our base case results, with 95% confidence intervals where appropriate.
Results
Main analysis
Table 2 compares the four prevention programs implemented singly. We estimate that expansions of OAT, NSPs, and Test & Treat up to coverage levels of 50% can cost less than US$30,000 per QALY gained relative to the next highest coverage level (95% confidence intervals for these programs fall below commonly accepted thresholds of cost-effectiveness, with NSPs having the widest range), while PrEP is likely to cost more than US$300,000 per QALY gained (95% confidence intervals fall above commonly accepted thresholds of cost-effectiveness). Our model estimates that achieving 50% coverage for OAT may avert fewer infections than achieving 50% coverage for PrEP. Because we model nearly immediate direct decreases in mortality rates and increases in quality of life and HIV treatment for those enrolled in OAT, we estimate that expanded OAT coverage is likely to produce higher QALY gains than any other intervention, even when averting fewer infections. An underlying assumption in the model is that PWID must transition through OAT before being “eligible” to cease injection use. At low, medium, and high OAT coverage, respectively, we estimate that the actively injecting population could decrease by 23%, 31%, and 37% over 20 y, accounting for a substantial proportion of the quality-of-life gains. Relatively low delivery costs combined with these benefits have the potential to make OAT the most cost-effective choice among the singly implemented prevention programs.

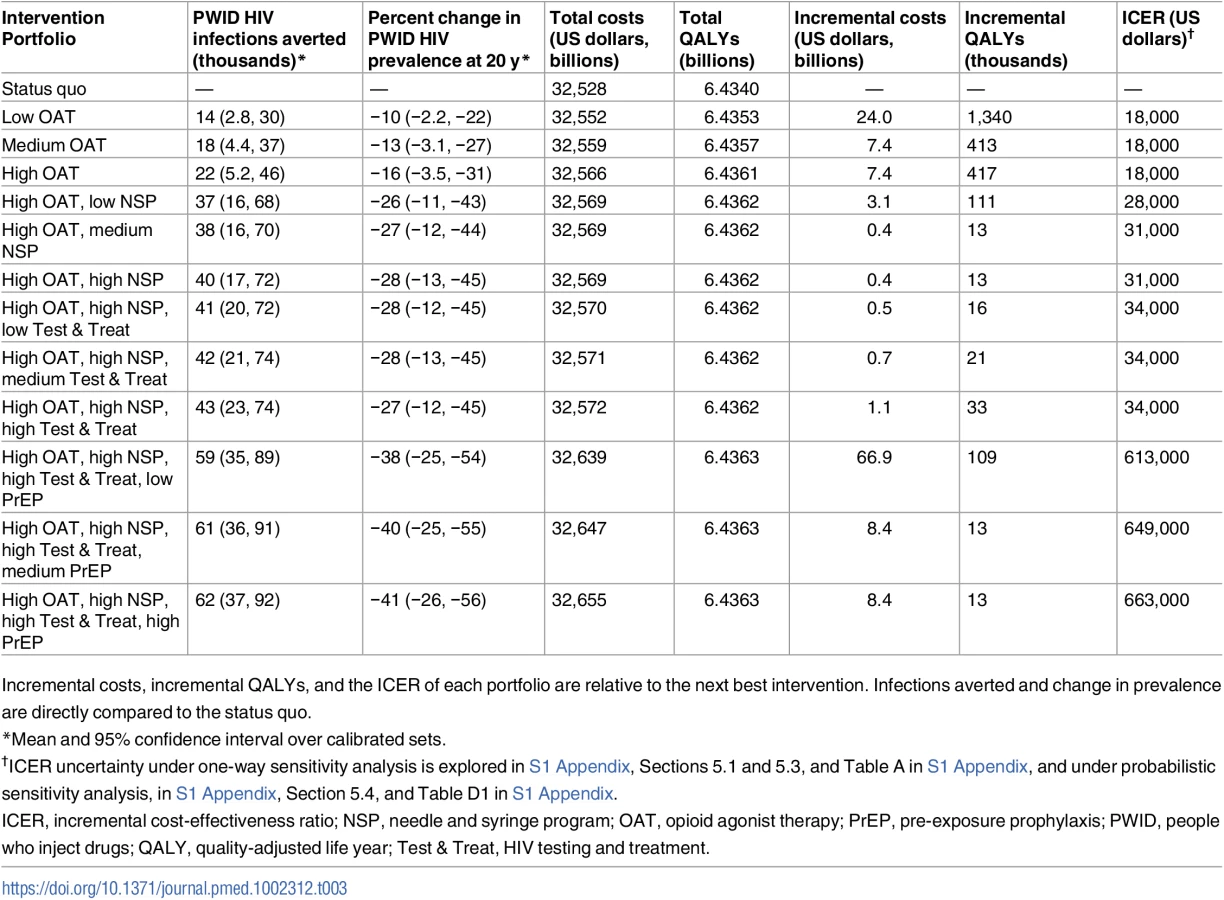
Figs 2 and 3 and Table 3 illustrate how programs can be combined to construct the highest value prevention portfolio from all considered combinations of OAT, NSPs, Test & Treat, and PrEP. Our base case analysis indicates that scaling OAT coverage up to 50%, then scaling NSP coverage to 50%, then scaling Test & Treat coverage to 50% can be a cost-effective approach to maximizing health benefit, with each additional coverage expansion having the potential to cost less than US$50,000 per QALY gained relative to the next best portfolio. Over 20 y, the combination of high OAT, NSP, and Test & Treat coverage can avert up to 43,400 (95% CI: 23,000, 74,000) infections and decrease HIV prevalence among PWID by 27% (95% CI: 12%, 45%). This is 5,700 more infections and a 1% greater decrease in prevalence than model projections from a program of high PrEP alone. At the same time, our analysis estimates that combinations of OAT, NSPs, and Test & Treat could cost up to US$40 billion less than a high-coverage PrEP program over 20 y.


Sensitivity analysis
We conducted multiple sensitivity analyses to assess the importance of uncertainty around model parameters and to evaluate factors important to developing high-value portfolios. We present key insights below, with further details in S1 Appendix, Section 5.
Our findings presented in Figs 2 and 3 and Table 3 are largely insensitive to the majority of one-way sensitivity analyses conducted on model parameters relating to the implementation of each intervention. Several one-way sensitivity analyses conducted on program delivery parameters cause an intuitive interchange in the relative priority of interventions. For instance, at low NSP delivery costs or high efficacy of NSPs, or at high OAT delivery and start-up costs, our analysis suggests that the highest value portfolio would first increase NSP coverage before scaling up OAT. In probabilistic sensitivity analysis (PSA), 41% of sampled sets first add NSPs to the portfolio before adding OAT, while the rest add OAT first. We estimate that additions of OAT and NSPs to the portfolio cost less than US$50,000 per QALY gained in 100% and 74% of all samples considered in PSA, respectively. When the threshold is US$100,000 per QALY gained, NSPs are a cost-effective addition in 93% of PSA samples.
We estimate that increasing Test & Treat coverage could cost less than US$50,000 per QALY gained over a range of delivery costs. We did not identify a one-way sensitivity scenario under which Test & Treat replaces OAT as the most favorable investment, although there are several scenarios in which, unlike in the base case, Test & Treat is a higher priority investment than NSPs. Furthermore, in PSA there were no sampled sets for which the model projected Test & Treat as the first addition to a highest value portfolio. The addition of Test & Treat costs less than US$50,000 per QALY gained in 4.7% of PSA samples, less than US$100,000 in 33% of samples, and less than US$150,000 in 67% of samples. Thus, in terms of cost-effectiveness, our findings indicate that a portfolio of prevention programs could achieve highest value by first investing in OAT or NSPs before scaling up Test & Treat.
Over the majority of one-way sensitivity analyses, we estimate PrEP to cost more than US$500,000 per QALY gained when added to the portfolio. Only when we decrease PrEP’s drug cost by 90% do we project its ICER value to fall below US$100,000 relative to the next best alternative. In PSA, when we vary both the cost and the efficacy of PrEP within estimated, currently feasible ranges, 1% of sampled sets have a highest value portfolio for which the addition of PrEP costs less than US$150,000 per QALY gained.
To further explore the dependence of our results on underlying calibrated parameters, such as ART efficacy, we performed all analyses on a limited subset, the sets containing a parameter value in the bottom or top 5% of all sets, for each parameter. Limiting the analysis to extreme values does not substantially change our findings, nor do other sensitivity analyses on the duration or implementation of interventions (S1 Appendix, Section 5.2). To probe the effects of wide confidence intervals on several parameters, we performed multiple joint sensitivity analyses outside the calibrated context as well as over three calibrated sets for which both OAT’s effectiveness in reducing injection frequency and the decrease in injection equipment sharing following HIV diagnosis (with implications for the effectiveness of Test & Treat) were highly unfavorable (S1 Appendix, Section 5.3). We estimated that in such circumstances NSPs can replace OAT as the priority investment, but OAT, NSPs, and Test & Treat remain cost-effective additions to the portfolio, while PrEP is not likely to be, although its value can increase when other interventions are less favorable.
Discussion
The opioid epidemic is a global public health burden that has become particularly acute in the US [1,2,8]. In addition to the substantial mortality associated with substance abuse [2], high rates of HIV transmission among PWID make the successful prevention of HIV in this population a public health priority. To that end, we consider portfolios of HIV prevention programs that include OAT, NSPs, Test & Treat, and PrEP scaled to various coverage levels. Although model projections can only provide estimates of health benefits and costs, such analyses can provide intuition around critical mechanisms and assumptions to inform decision making. Our main finding is that, over 20 y, high coverage (enrollment of 50% of the eligible population) of OAT, NSPs, and Test & Treat in combination could avert nearly 43,400 (95% CI: 23,000, 74,000) HIV infections among PWID and reduce HIV prevalence among PWID by 27% (95% CI: 12%, 45%). The construction of such a portfolio has the potential to be cost-effective at each incremental expansion, with projected ICERs below US$50,000 per QALY gained. Moreover, our analysis suggests that the estimated benefit obtainable by PrEP alone (measured in QALYs) could potentially be achieved and even surpassed at substantially lower cost by combining other prevention interventions into high-value portfolios.
Advocates for efficient investment in PWID-specific interventions have asked, “What good is preventing HIV if we do not first save that life at HIV risk?” [77]. Our analysis suggests that the high competing mortality risks of PWID can explain why interventions that immediately improve quality of life can have substantially higher estimated benefits than those that focus on HIV prevention alone. Our analysis estimates that OAT, in particular, which we assume has a direct impact on the length and quality of life of treated individuals [27,28,30–32,60,61], can provide substantially more benefit, measured in QALYs, than other interventions, even when it prevents fewer infections (Table 2).
Although our analysis did not identify a scenario in which OAT was not a cost-effective addition to a high-value portfolio, deterministic and probabilistic sensitivity analyses can provide intuition regarding scenarios in which NSPs could replace OAT as the priority investment. Because the assumed delivery cost of NSPs is so much lower than that of other programs, our findings suggest that it is reasonable to invest in NSPs concurrent with OAT scale-up. While Test & Treat is often estimated in our analysis to be a cost-effective addition to the portfolio, our model does not project it to be a priority investment. Our estimates for ART’s reduction of transmission risk via injection-based contact [13,44] are lower than those for sexual contact [14,41,44], which may explain our projection of smaller benefits in the PWID population. It should also be noted that HIV prevalence in US PWID is less than 10% [18], and the direct QALY increases from Test & Treat programs were therefore low relative to programs that served the entire PWID population.
Costs and cost-effectiveness are but one factor among several in the decision to provide prevention interventions. Policymakers and clinicians may decide that considerations of ethics and social justice outweigh economic considerations for this vulnerable population. PrEP, for instance, can provide benefits for PWID and should not be denied on the basis of injection drug use. Moreover, our findings are based on the current cost of PrEP in the US. If the cost of PrEP were substantially reduced, its cost-effectiveness could become more favorable. Nonetheless, as policymakers address the broader epidemic, our findings suggest that increasing the availability of a full spectrum of prevention interventions would have the highest health and economic benefits.
Our analysis assumes that each intervention is an available option, which is not true in many settings. Treatment and prevention programs for PWID remain controversial, and interventions may be infeasible for reasons beyond budgetary impact. Despite evidence of effectiveness and cost-effectiveness, a current ban in the US prevents federal funding for NSPs [67], and although a previous study found no significant correlation between neighborhood crime and treatment centers [78], proposals for new methadone clinics often face community opposition. Moreover, nearly 60% of individuals on methadone in the US receive insufficient dosing [79]. For this reason, the model’s calibrated sets reflected a wide range of possible effectiveness levels of methadone. If barriers to OAT access were lowered and treatment offered at international evidence-based standards, our analysis suggests that the value of this already cost-effective intervention could increase.
Our analysis has several limitations (Table E in S1 Appendix). First, although our model captures dynamic interactions between programs, we implement combinations of programs as independent. This means that the efficacy and cost of each program does not depend on the efficacy, cost, and impact of other programs at the individual level (for a PWID enrolled in multiple programs) or the population level; that is, declining HIV incidence from an already implemented intervention does not change the delivery cost of another intervention. Rather, our parameters reflect average, aggregate effects in the targeted population. As policymakers move toward a “one stop shop” approach [66], there may be synergies between programs that we do not account for. At the same time, our analysis likely overestimates cost in such a situation by counting the same overhead multiple times. PrEP’s cost, however, comes primarily from the drug itself and is unlikely to decrease if combined with other services. As our analysis suggests that OAT, NSPs, and Test & Treat can be cost-effective even without combining overhead costs or incorporating synergies on an individual level, modeling programs as interdependent would likely not change our general ranking of programs, although it might increase value in an absolute sense if, for instance, adherence to any one program could be improved with multiple enrollment.
Second, certain limitations are inherent to our choice of model. Although extensive sensitivity analysis allows us to investigate parameter sensitivity, the use of a dynamic compartmental model prevents the exploration of structural sensitivities [80,81]. Because compartmental models do not track individuals, we do not explicitly model such phenomena as loss to follow-up in HIV care, although we do calibrate linkage rates to account for long-term drop-offs in the care cascade [27,39,40]. Our model does not explicitly account for networks or distinguish risk on an individual basis. All of the interventions we consider would be more cost-effective if targeted to individuals central to injecting or sexual networks. Because an individual’s decrease in needle sharing must also affect the number of shared needles of his or her injecting partners, the effects of NSPs, in particular, may be underestimated by a compartmental model, where we can only estimate average effectiveness for the individual accessing the service. However, as we find NSPs to be cost-effective under most circumstances, and as we find the most substantial benefit to come from direct, individual health gains accruing from OAT, independent of network effects, this simplification is not likely to alter our model’s general findings.
Third, we assume constant returns to scale (i.e., per person costs do not increase as coverage expands) even though, in practice, enrolling more marginalized PWID, especially at higher coverage levels, is likely more costly. While diminishing returns as coverage rises may decrease the value of investments in absolute terms, the relative ranking of programs, assuming that marginalized PWID are equally difficult to enroll in any program, would not be affected. Moreover, our framing of low, medium, and high coverage levels is meant to be illustrative of possible investment patterns, but our prioritization rankings and cost-effectiveness conclusions do not change with arbitrary definitions of “high” coverage (S1 Appendix, Section 5.2.3). In practice, achievable coverage levels may vary extensively by region. However, our cost-efficient frontier (Fig 2) suggests that OAT investments along a range of feasible coverage levels can provide high value, even when such levels are below 50%.
Finally, many of our model parameters are uncertain. To address this uncertainty, we calibrated our model to empirical data and conducted extensive sensitivity and uncertainty analyses (S1 Appendix, Section 5). Although these analyses suggest that our main findings are consistent across many scenarios and analyses, there remains uncertainty about HIV transmission dynamics and the effectiveness of prevention programs when implemented jointly. Our findings should be interpreted in view of these limitations.
Our model-based analysis builds intuition for the mechanisms behind the conclusions of Des Jarlais et al. [9], who found that a combined prevention approach was effective in ending HIV epidemics among PWID in a number of settings. We also project a range of scenarios under which these combined portfolios can be cost-effective. Where budgets are limited, our analysis suggests that a reasonable approach is for resources to be allocated first towards expanding OAT coverage, which we assume can have additional quality-of-life benefits for PWID beyond HIV prevention, including cessation of drug use. Combining NSP scale-up with OAT expansion, and investing remaining budget resources in further NSP expansion and in Test & Treat, has the potential to be both cost-effective and beneficial to the entire population. While budgets may dictate the extent to which programs can be scaled, we project that the relative ranking among modeled programs remains consistent across varied delivery contexts. Investment in cost-effective programs is critical given the current epidemic of injection drug use in the US [1,8]. Although further empirical studies of combined prevention programs would be very useful, model-based projections can inform the development of high-value HIV prevention portfolios.
Supporting Information
Zdroje
1. Jones CM, Logan J, Gladden RM, Bohm MK. Vital signs: demographic and substance use trends among heroin users—United States, 2002–2013. MMWR Morb Mortal Wkly Rep. 2015;64(26):719–25. 26158353
2. Rudd RA, Aleshire N, Zibbell JE, Gladden RM. Increases in drug and opioid overdose deaths—United States, 2000–2014. MMWR Morb Mortal Wkly Rep. 2016;64(50–51):1378–82. doi: 10.15585/mmwr.mm6450a3 26720857
3. Public Health Agency of Canada. HIV transmission risk: a summary of the evidence. Ottawa: Public Health Agency of Canada; 2013 [cited 2015 Feb 9]. http://www.catie.ca/sites/default/files/HIV-TRANSMISSION-RISK-EN.pdf.
4. Centers for Disease Control and Prevention. Estimated HIV incidence in the United States, 2007–2010. HIV Surveillance Supplemental Report. Atlanta: Centers for Disease Control and Prevention; 2012 [cited 2014 Aug 12]. https://www.cdc.gov/hiv/pdf/statistics_hssr_vol_17_no_4.pdf.
5. Centers for Disease Control and Prevention. Diagnoses of HIV infection in the United States and dependent areas, 2013. HIV Surveillance Report. Atlanta: Centers for Disease Control and Prevention; 2013 [cited 2015 Jul 15]. https://www.cdc.gov/hiv/pdf/library/reports/surveillance/cdc-hiv-surveillance-report-2013-vol-25.pdf.
6. Centers for Disease Control and Prevention. HIV-associated behaviors among injecting-drug users—23 cities, United States, May 2005–February 2006. MMWR Morb Mortal Wkly Rep. 2009;58(13):329–32. 19357632
7. Centers for Disease Control and Prevention. HIV infection and HIV-associated behaviors among injecting drug users—20 cities, United States, 2009. MMWR Morb Mortal Wkly Rep. 2012;61(8):133–8. 22377843
8. Frieden TR, Foti KE, Mermin J. Applying public health principles to the HIV epidemic—how are we doing? N Engl J Med. 2015;373(23):2281–7. doi: 10.1056/NEJMms1513641 26624243
9. Des Jarlais DC, Kerr T, Carrieri P, Feelemyer J, Arasteh K. HIV infection among persons who inject drugs: ending old epidemics and addressing new outbreaks. AIDS. 2016;30(6):815–26. doi: 10.1097/QAD.0000000000001039 26836787
10. MacArthur GJ, Minozzi S, Martin N, Vickerman P, Deren S, Bruneau J, et al. Opiate substitution treatment and HIV transmission in people who inject drugs: systematic review and meta-analysis. BMJ. 2012;345:e5945. doi: 10.1136/bmj.e5945 23038795
11. Sullivan LE, Moore BA, Chawarski MC, Pantalon MV, Barry D, O’Connor PG, et al. Buprenorphine/naloxone treatment in primary care is associated with decreased human immunodeficiency virus risk behaviors. J Subst Abuse Treat. 2008;35(1):87–92. doi: 10.1016/j.jsat.2007.08.004 17933486
12. Burt RD, Thiede H. Reduction in needle sharing among Seattle-area injection drug users across 4 surveys, 1994–2013. Am J Public Health. 2016;106(2):301–7. doi: 10.2105/AJPH.2015.302959 26691117
13. Choopanya K, Martin M, Suntharasamai P, Sangkum U, Mock PA, Leethochawalit M, et al. Antiretroviral prophylaxis for HIV infection in injecting drug users in Bangkok, Thailand (the Bangkok Tenofovir Study): a randomised, double-blind, placebo-controlled phase 3 trial. Lancet. 2013;381(9883):2083–90. doi: 10.1016/S0140-6736(13)61127-7 23769234
14. Castilla J, Del Romero J, Hernando V, Marincovich B, Garcia S, Rodriguez C. Effectiveness of highly active antiretroviral therapy in reducing heterosexual transmission of HIV. J Acquir Immune Defic Syndr. 2005;40(1):96–101. 16123689
15. US Public Health Service. Preexposure prophylaxis for the prevention of HIV infection in the United States—2014: a clinical practice guideline. Atlanta: Centers for Disease Control and Prevention; 2014 [cited 2014 Jun 12]. http://www.cdc.gov/hiv/pdf/prepguidelines2014.pdf.
16. Bernard CL, Brandeau ML, Owens DK, Humphreys K, Bendavid E, Weyant C, et al. Cost-effectiveness of HIV preexposure prophylaxis for people who inject drugs in the United States. Ann Intern Med. 2016;165(1):10–9.
17. Broz D, Wejnert C, Pham HT, DiNenno E, Heffelfinger JD, Cribbin M, et al. HIV infection and risk, prevention, and testing behaviors among injecting drug users—National HIV Behavioral Surveillance System, 20 U.S. cities, 2009. MMWR Surveill Summ. 2014;63(6):1–51. 24990587
18. Spiller MW, Broz D, Wejnert C, Nerlander L, Paz-Bailey G. HIV infection and HIV-associated behaviors among persons who inject drugs—20 cities, United States, 2012. MMWR Morb Mortal Wkly Rep. 2015;64(10):270–5. 25789742
19. Centers for Disease Control and Prevention. Prevalence and awareness of HIV infection among men who have sex with men—21 cities, United States, 2008. MMWR Morb Mortal Wkly Rep. 2010;59(37):1201–7. 20864920
20. Centers for Disease Control and Prevention. HIV testing and risk behaviors among gay, bisexual, and other men who have sex with men—United States. MMWR Morb Mortal Wkly Rep. 2013;62(47):958–62. 24280915
21. Hall HI, Green TA, Wolitski RJ, Holtgrave DR, Rhodes P, Lehman JS, et al. Estimated future HIV prevalence, incidence, and potential infections averted in the United States: a multiple scenario analysis. J Acquir Immune Defic Syndr. 2010;55(2):271–6. doi: 10.1097/QAI.0b013e3181e8f90c 20634702
22. Weinstein MC, O’Brien B, Hornberger J, Jackson J, Johannesson M, McCabe C, et al. Principles of good practice for decision analytic modeling in health-care evaluation: report of the ISPOR Task Force on Good Research Practices—Modeling Studies. Value Health. 2003;6(1):9–17. 12535234
23. Gold M. Panel on cost-effectiveness in health and medicine. Med Care. 1996;34(12 Suppl):DS197–9. 8969326
24. Friedman SR, Tempalski B, Cooper H, Perlis T, Keem M, Friedman R, et al. Estimating numbers of injecting drug users in metropolitan areas for structural analyses of community vulnerability and for assessing relative degrees of service provision for injecting drug users. J Urban Health. 2004;81(3):377–400. doi: 10.1093/jurban/jth125 15273263
25. Tempalski B, Pouget ER, Cleland CM, Brady JE, Cooper HL, Hall HI, et al. Trends in the population prevalence of people who inject drugs in US metropolitan areas 1992–2007. PLoS ONE. 2013;8(6):e64789. doi: 10.1371/journal.pone.0064789 23755143
26. Centers for Disease Control and Prevention. Integrated prevention services for HIV infection, viral hepatitis, sexually transmitted diseases, and tuberculosis for persons who use drugs illicitly: summary guidance from CDC and the U.S. Department of Health and Human Services. MMWR Recomm Rep. 2012;61(RR-5):1–40. 23135062
27. Cipriano LE, Zaric GS, Holodniy M, Bendavid E, Owens DK, Brandeau ML. Cost effectiveness of screening strategies for early identification of HIV and HCV infection in injection drug users. PLoS ONE. 2012;7(9):e45176. doi: 10.1371/journal.pone.0045176 23028828
28. Zaric GS, Barnett PG, Brandeau ML. HIV transmission and the cost-effectiveness of methadone maintenance. Am J Public Health. 2000;90(7):1100–11. 10897189
29. Kral AH, Lorvick J, Ciccarone D, Wenger L, Gee L, Martinez A, et al. HIV prevalence and risk behaviors among men who have sex with men and inject drugs in San Francisco. J Urban Health. 2005;82(1 Suppl 1):i43–50. doi: 10.1093/jurban/jti023 15738321
30. Bellis DJ. Reduction of AIDS risk among 41 heroin addicted female street prostitutes: effects of free methadone maintenance. J Addict Dis. 1993;12(1):7–23. doi: 10.1300/J069v12n01_02 8381030
31. Degenhardt L, Hall W, Warner-Smith M. Using cohort studies to estimate mortality among injecting drug users that is not attributable to AIDS. Sex Transm Infect. 2006;82(Suppl 3):iii56–63.
32. Alistar SS, Owens DK, Brandeau ML. Effectiveness and cost effectiveness of oral pre-exposure prophylaxis in a portfolio of prevention programs for injection drug users in mixed HIV epidemics. PLoS ONE. 2014;9(1):e86584. doi: 10.1371/journal.pone.0086584 24489747
33. McCollister KE, French MT, Pyne JM, Booth B, Rapp R, Carr C. The cost of treating addiction from the client’s perspective: Results from a multi-modality application of the Client DATCAP. Drug Alcohol Depend. 2009;104(3):241–8. doi: 10.1016/j.drugalcdep.2009.05.014 19574000
34. Kaplan EH, Heimer R. A model-based estimate of HIV infectivity via needle sharing. J Acquir Immune Defic Syndr. 1992;5(11):1116–8. 1403641
35. Holtgrave DR, Pinkerton SD, Jones TS, Lurie P, Vlahov D. Cost and cost-effectiveness of increasing access to sterile syringes and needles as an HIV prevention intervention in the United States. J Acquir Immune Defic Syndr Hum Retrovirol. 1998;18(Suppl 1):S133–8.
36. Knittel S. Bill seeks to end the ban on syringe exchange programs. Seattle Gay News. 2009 Jul 17 [cited 2016 Jan 22]. http://www.sgn.org/sgnnews37_29/page14.cfm.
37. Des Jarlais DC, Nugent A, Solberg A, Feelemyer J, Mermin J, Holtzman D. Syringe service programs for persons who inject drugs in urban, suburban, and rural areas—United States, 2013. MMWR Morb Mortal Wkly Rep. 2015;64(48):1337–41. doi: 10.15585/mmwr.mm6448a3 26655918
38. Kapadia F, Latka MH, Hudson SM, Golub ET, Campbell JV, Bailey S, et al. Correlates of consistent condom use with main partners by partnership patterns among young adult male injection drug users from five US cities. Drug Alcohol Depend. 2007;91(Suppl 1):S56–63.
39. Centers for Disease Control and Prevention. HIV/AIDS: infographics and posters. Atlanta: Centers for Disease Control and Prevention; 2015 [cited 2015 Jun 29]. https://www.cdc.gov/hiv/library/infographics/.
40. Spire B, Lucas GM, Carrieri MP. Adherence to HIV treatment among IDUs and the role of opioid substitution treatment (OST). Int J Drug Policy. 2007;18(4):262–70. doi: 10.1016/j.drugpo.2006.12.014 17689374
41. Hollingsworth TD, Anderson RM, Fraser C. HIV-1 transmission, by stage of infection. J Infect Dis. 2008;198(5):687–93. doi: 10.1086/590501 18662132
42. Samji H, Cescon A, Hogg RS, Modur SP, Althoff KN, Buchacz K, et al. Closing the gap: increases in life expectancy among treated HIV-positive individuals in the United States and Canada. PLoS ONE. 2013;8(12):e81355. doi: 10.1371/journal.pone.0081355 24367482
43. Wada N, Jacobson LP, Cohen M, French A, Phair J, Munoz A. Cause-specific mortality among HIV-infected individuals, by CD4(+) cell count at HAART initiation, compared with HIV-uninfected individuals. AIDS. 2014;28(2):257–65. doi: 10.1097/QAD.0000000000000078 24105030
44. Long EF, Brandeau ML, Owens DK. The cost-effectiveness and population outcomes of expanded HIV screening and antiretroviral treatment in the United States. Ann Intern Med. 2010;153(12):778–89. doi: 10.7326/0003-4819-153-12-201012210-00004 21173412
45. Skarbinski J, Rosenberg E, Paz-Bailey G, Hall HI, Rose CE, Viall AH, et al. Human immunodeficiency virus transmission at each step of the care continuum in the United States. JAMA Intern Med. 2015;175(4):588–96. doi: 10.1001/jamainternmed.2014.8180 25706928
46. Centers for Disease Control and Prevention. Understanding the HIV care continuum. Atlanta: Centers for Disease Control and Prevention; 2014 [cited 2016 Mar 31]; http://www.cdc.gov/hiv/pdf/DHAP_Continuum.pdf.
47. Sanders GD, Bayoumi AM, Sundaram V, Bilir SP, Neukermans CP, Rydzak CE, et al. Cost-effectiveness of screening for HIV in the era of highly active antiretroviral therapy. N Engl J Med. 2005;352(6):570–85. doi: 10.1056/NEJMsa042657 15703422
48. Juusola JL, Brandeau ML, Owens DK, Bendavid E. The cost-effectiveness of preexposure prophylaxis for HIV prevention in the United States in men who have sex with men. Ann Intern Med. 2012;156(8):541–50. doi: 10.7326/0003-4819-156-8-201204170-00001 22508731
49. Law Enforcement Assisted Diversion. About LEAD. Seattle: Law Enforcement Assisted Diversion; 2016 [cited 2016 Mar 15]. http://leadkingcounty.org/about/.
50. Barnett PG, Chow A, Joyce VR, Bayoumi AM, Griffin SC, Sun H, et al. Effect of management strategies and clinical status on costs of care for advanced HIV. Am J Manag Care. 2014;20(5):e129–37. 25326927
51. Paltiel AD, Weinstein MC, Kimmel AD, Seage GR 3rd, Losina E, Zhang H, et al. Expanded screening for HIV in the United States—an analysis of cost-effectiveness. N Engl J Med. 2005;352(6):586–95. doi: 10.1056/NEJMsa042088 15703423
52. New York State Department of Health. Pre-exposure prophylaxis (PrEP) to prevent HIV infection: questions and answers. Albany: New York State Department of Health; 2012 [cited 2015 Feb 9]. https://www.health.ny.gov/publications/0265/.
53. Paltiel AD, Freedberg KA, Scott CA, Schackman BR, Losina E, Wang B, et al. HIV preexposure prophylaxis in the United States: impact on lifetime infection risk, clinical outcomes, and cost-effectiveness. Clin Infect Dis. 2009;48(6):806–15. doi: 10.1086/597095 19193111
54. US Department of Veterans Affairs. National Acquisition Center (CCST). Washington (District of Columbia): US Department of Veterans Affairs; 2015 [cited 2015 Apr 1]. https://www.va.gov/nac/.
55. Arias E. United States life tables, 2010. Natl Vital Stat Rep. 2014;63(7):1–63. 25383611
56. Sionean C, Le BC, Hageman K, Oster AM, Wejnert C, Hess KL, et al. HIV risk, prevention, and testing behaviors among heterosexuals at increased risk for HIV infection—National HIV Behavioral Surveillance System, 21 U.S. cities, 2010. MMWR Surveill Summ. 2014;63(14):1–39. 25522191
57. Davis KR, Weller SC. The effectiveness of condoms in reducing heterosexual transmission of HIV. Fam Plann Perspect. 1999;31(6):272–9. 10614517
58. Pilcher CD, Tien HC, Eron JJ Jr, Vernazza PL, Leu SY, Stewart PW, et al. Brief but efficient: acute HIV infection and the sexual transmission of HIV. J Infect Dis. 2004;189(10):1785–92. doi: 10.1086/386333 15122514
59. Tengs TO, Lin TH. A meta-analysis of utility estimates for HIV/AIDS. Med Decis Making. 2002;22(6):475–81. doi: 10.1177/0272989X02238300 12458977
60. Pollack HA, D’Aunno T. HIV testing and counseling in the nation’s outpatient substance abuse treatment system, 1995–2005. J Subst Abuse Treat. 2010;38(4):307–16. doi: 10.1016/j.jsat.2009.12.004 20171038
61. Sanchez T, Finlayson T, Drake A, Behel S, Cribbin M, Dinenno E, et al. Human immunodeficiency virus (HIV) risk, prevention, and testing behaviors—United States, National HIV Behavioral Surveillance System: men who have sex with men, November 2003–April 2005. MMWR Surveill Summ. 2006;55(6):1–16. 16826162
62. Barnett PG, Zaric GS, Brandeau ML. The cost-effectiveness of buprenorphine maintenance therapy for opiate addiction in the United States. Addiction. 2001;96(9):1267–78. doi: 10.1080/09652140120070328 11672491
63. Schackman BR, Leff JA, Polsky D, Moore BA, Fiellin DA. Cost-effectiveness of long-term outpatient buprenorphine-naloxone treatment for opioid dependence in primary care. J Gen Intern Med. 2012;27(6):669–76. doi: 10.1007/s11606-011-1962-8 22215271
64. Kim NJ, Jin H, McFarland W, Raymond HF. Trends in sources and sharing of needles among people who inject drugs, San Francisco, 2005–2012. Int J Drug Policy. 2015;26(12):1238–43. doi: 10.1016/j.drugpo.2015.08.013 26365768
65. Kwon JA, Anderson J, Kerr CC, Thein HH, Zhang L, Iversen J, et al. Estimating the cost-effectiveness of needle-syringe programs in Australia. AIDS. 2012;26(17):2201–10. doi: 10.1097/QAD.0b013e3283578b5d 22914579
66. Adams J. HIV Outbreak in Indiana. N Engl J Med. 2015;373(14):1379–80.#SA1.
67. Strathdee SA, Beyrer C. Threading the needle—how to stop the HIV outbreak in rural Indiana. N Engl J Med. 2015;373(5):397–9. doi: 10.1056/NEJMp1507252 26106947
68. National Institutes of Health. Starting antiretroviral treatment early improves outcomes for HIV-infected individuals. Bethesda (Maryland): National Institutes of Health; 2015 May 27 [cited 2015 Jul 15]. https://www.nih.gov/news-events/news-releases/starting-antiretroviral-treatment-early-improves-outcomes-hiv-infected-individuals.
69. Pilcher C, Hatano HH, Dasgupta A, Jones D, Torres S, Calderon F, et al. Providing same day, observed ART to newly diagnosed HIV+ outpatients is associated with improved virologic suppression. Abstract WEAD0105LB. 8th IAS Conference on HIV Pathogenesis, Treatment & Prevention; 19–22 Jul 2015; Vancouver, Canada.
70. Schwarcz S, Hsu CL, Scheer S. Disparities and trends in viral suppression during a transition to a “Test and Treat” approach to the HIV epidemic, San Francisco, 2008–2012. J Acquir Immune Defic Syndr. 2015;70(5):529–37. doi: 10.1097/QAI.0000000000000794 26569177
71. Walensky RP, Freedberg KA, Weinstein MC, Paltiel AD. Cost-effectiveness of HIV testing and treatment in the United States. Clin Infect Dis. 2007;45(Suppl 4):S248–54.
72. Westergaard RP, Ambrose BK, Mehta SH, Kirk GD. Provider and clinic-level correlates of deferring antiretroviral therapy for people who inject drugs: a survey of North American HIV providers. J Int AIDS Soc. 2012;15(1):10. doi: 10.1186/1758-2652-15-10 22360788
73. US Bureau of Labor Statistics. Consumer Price Index. Washington (District of Columbia): US Department of Labor; 2015 [cited 2015 March 31]. https://www.bls.gov/cpi/.
74. Goldhaber-Fiebert JD, Stout NK, Ortendahl J, Kuntz KM, Goldie SJ, Salomon JA. Modeling human papillomavirus and cervical cancer in the United States for analyses of screening and vaccination. Popul Health Metr. 2007;5 : 11. doi: 10.1186/1478-7954-5-11 17967185
75. Karnon J, Vanni T. Calibrating models in economic evaluation: a comparison of alternative measures of goodness of fit, parameter search strategies and convergence criteria. Pharmacoeconomics. 2011;29(1):51–62. doi: 10.2165/11584610-000000000-00000 21142278
76. Stinnett AA, Paltiel AD. Estimating CE ratios under second-order uncertainty: the mean ratio versus the ratio of means. Med Decis Making. 1997;17(4):483–9. doi: 10.1177/0272989X9701700414 9343807
77. Walensky RP. Investing in people who inject drugs: a preponderance of opportunities. Ann Intern Med. 2016 Apr 26.
78. Boyd SJ, Fang LJ, Medoff DR, Dixon LB, Gorelick DA. Use of a ‘microecological technique’ to study crime incidents around methadone maintenance treatment centers. Addiction. 2012;107(9):1632–8. doi: 10.1111/j.1360-0443.2012.03872.x 22385066
79. Pollack HA, D’Aunno T. Dosage patterns in methadone treatment: results from a national survey, 1988–2005. Health Serv Res. 2008;43(6):2143–63. doi: 10.1111/j.1475-6773.2008.00870.x 18522665
80. Bilcke J, Beutels P, Brisson M, Jit M. Accounting for methodological, structural, and parameter uncertainty in decision-analytic models: a practical guide. Med Decis Making. 2011;31(4):675–92. doi: 10.1177/0272989X11409240 21653805
81. Neumann PJ, Sanders GD, Russell LB, Siegel JE, Ganiats TG, editors. Cost-effectiveness in health and medicine. 2nd edition. Oxford: Oxford University Press; 2016.
Štítky
Interní lékařstvíČlánek vyšel v časopise
PLOS Medicine
2017 Číslo 5
- Ivabradin zlepšuje kvalitu života starších pacientů se srdečním selháním
- Fixní kombinace kandesartan/amlodipin v terapii arteriální hypertenze
- Inovace v hojení ran: krytí Zetuvit Plus Silicone Border pro optimální management exsudátu z ran
- Rána vizitkou (nejen) chirurga
- Patogeneze vzniku keloidní jizvy
Nejčtenější v tomto čísle
- Mortality and kidnapping estimates for the Yazidi population in the area of Mount Sinjar, Iraq, in August 2014: A retrospective household survey
- Vitamin D levels and susceptibility to asthma, elevated immunoglobulin E levels, and atopic dermatitis: A Mendelian randomization study
- Maternal age and severe maternal morbidity: A population-based retrospective cohort study
- Estimation of the cost-effectiveness of HIV prevention portfolios for people who inject drugs in the United States: A model-based analysis
Zvyšte si kvalifikaci online z pohodlí domova
Mazová zátka a její řešení
nový kurzVšechny kurzy