
The Cofilin Phosphatase Slingshot Homolog 1 (SSH1) Links NOD1 Signaling to Actin Remodeling
NOD1 was one of the first NLR-family members shown to act as an important intracellular pattern-recognition molecule mediating antimicrobial activities in mammals. It has been demonstrated that perturbation of F-actin and RhoGTPase activity affects NOD1 and NOD2 signaling, however, the effectors of this process remained elusive. By using a multilayered high-throughput druggable genome wide siRNA screening approach to discover novel components specific for the NOD1 pathway, we identified the cofilin phosphatase SSH1, which acts downstream of RhoA-ROCK, as key regulator of NOD1 signaling. We show that SSH1 forms a complex with NOD1 at F-actin rich sites in human cells and is needed for NOD1-mediated responses towards TriDAP exposure and Shigella flexneri infection. Functionally this is achieved by SSH1-mediated activation of cofilin. Our findings reveal a previously unrecognized role for SSH1 in NOD1 signaling and provide a plausible unifying mechanistic explanation of how perturbations of the actin cytoskeleton can induce NOD1-mediated inflammatory responses.
Published in the journal:
. PLoS Pathog 10(9): e32767. doi:10.1371/journal.ppat.1004351
Category:
Research Article
doi:
https://doi.org/10.1371/journal.ppat.1004351
Summary
NOD1 was one of the first NLR-family members shown to act as an important intracellular pattern-recognition molecule mediating antimicrobial activities in mammals. It has been demonstrated that perturbation of F-actin and RhoGTPase activity affects NOD1 and NOD2 signaling, however, the effectors of this process remained elusive. By using a multilayered high-throughput druggable genome wide siRNA screening approach to discover novel components specific for the NOD1 pathway, we identified the cofilin phosphatase SSH1, which acts downstream of RhoA-ROCK, as key regulator of NOD1 signaling. We show that SSH1 forms a complex with NOD1 at F-actin rich sites in human cells and is needed for NOD1-mediated responses towards TriDAP exposure and Shigella flexneri infection. Functionally this is achieved by SSH1-mediated activation of cofilin. Our findings reveal a previously unrecognized role for SSH1 in NOD1 signaling and provide a plausible unifying mechanistic explanation of how perturbations of the actin cytoskeleton can induce NOD1-mediated inflammatory responses.
Introduction
Effective immune defense in mammals relies on the detection of conserved pathogen structures by pattern recognition receptors (PRRs) of the innate immune system to prime immune responses [1].
Several PRRs have been identified and extensively studied in the last decade. In particular, members of the NOD-like receptor (NLR)-family gained attention due to their intracellular localization [2], [3]. One of the first NLRs shown to act as a PRR is NOD1. NOD1 is an intracellular protein that can be activated by diaminopimelic acid-containing peptides derived from bacterial peptidoglycan and acts as a sensor for invasive bacteria such as Shigella flexneri [4]–[6].
A wealth of data suggest that NOD1 is an important PRR for a variety of bacteria in mammals, which also contributes to systemic activation of neutrophils, induction of adaptive immunity and immune tissue homeostasis (reviewed in [2], [3]). Upon activation, NOD1 forms a complex with the receptor-interacting serine/threonine-protein kinase 2 (RIP2), which results in the activation of NF-κB and mitogen-activated protein kinases (MAPK) signaling pathways [2], [3]. Several components of the pathway downstream of NOD1 have been identified. For example, the NOD1 binding partner RIP2 mediates activation of the TGF-β-associated kinase 1 (TAK1) complex which is induced by ubiquitylation of RIP2 through ubiquitin ligases including the X-linked inhibitor of apoptosis protein (XIAP) [7] and the cellular inhibitor of apoptosis protein-1 and -2 (cIAP1, and cIAP2) [8]. NOD1 is found at the plasma membrane where it co-localizes with F-actin. This localization was suggested to be a prerequisite for signaling because affecting actin polymerization changes NOD1 signaling [9]. Furthermore, the Salmonella effector SopE activates NOD1, involving changes in small Rho GTPase activity [10]. Additionally, the RhoA guanine nucleotide exchange factor H1 (GEF-H1) was linked to NOD1 activation [11]. Of note, the NOD1 related protein NOD2 is also regulated by the small GTPase Rac1 [12], [13] and localizes at the plasma membrane at cortical F-actin structures, similar to NOD1 [9], [13], [14]. Together this indicates an intimate connection of NOD1 and NOD2 signaling with the actin cytoskeleton, although the mechanistic details remain largely elusive. Cellular actin dynamics are strictly controlled by the action of nucleation factors such as Arp2/3, which bind to the sides of pre-existing filaments and promote the growth of new filaments at these sites. Actin binding proteins belonging to the actin depolymerization factors (ADF)/cofilin family control the disassembly of actin filaments by severing F-actin filaments, thereby generating new sites of actin polymerization. In addition, there is evidence that cofilin depolymerizes F-actin to provide new G-actin molecules for polymerization. Cofilin activity itself is tightly controlled by LIMK1 and LIMK2, which phosphorylate cofilin at serine 3 whereby its activity is blocked. Accordingly, dephosphorylation by the phosphatase slingshot homolog 1 (SSH1) reactivates cofilin (reviewed in [15]).
Here we identify the cofilin phosphatase SSH1 as an essential component of the human NOD1 signaling pathway and show that SSH1 links NOD1 activation to cofilin-mediated changes in actin remodeling.
Results
A high-throughput siRNA-screen identifies SSH1 as an essential component of NOD1-mediated NF-κB signaling
To identify novel factors involved in NOD1-mediated NF-κB activation, we adapted a cell based NF-κB-luciferase reporter gene assay in HEK293T cells [16] for high-throughput (HT) small interfering RNA (siRNA) screening (Figures S1A and B).
A druggable-genome siRNA-library (a sub-library of the human genome covering approximately 7000 genes with known protein domains) containing four independent siRNAs per gene was screened in quadruplicate for hits inhibiting NOD1-mediated NF-κB activation upon treatment with the NOD1-specific elicitor TriDAP (Figure S1A). After quality control and elimination of toxic siRNAs, preliminary candidates were selected using a probability-based algorithm (redundant siRNA activity; RSA) [17] (Table S1). Statistical analyses confirmed the high reproducibility of the results and the robustness of the assay controls (p65 and the non-targeting Allstars siRNA) (Figure S2A). The top 435 of the RSA-ranked candidates with at least two hit siRNAs were differentially tested for TriDAP - as well as TNF-induced NF-κB activation (referred to here as “validation screen” and “counter screen”, respectively), using two independent siRNAs in HEK293T cells (Figure 1A and S1B). Knock-down of 173 genes for this set displayed an inhibitory effect on TriDAP-induced NF-κB activation. Of those, 66 genes were specifically involved in NOD1 signaling in HEK293T cells, i.e. they did not significantly affect TNF-mediated NF-κB activation (Figure 1B, Table S1). Among them, 28 known regulators of NF-κB, partly with known specificity for NOD1 signaling, could be retrieved, confirming the validity of the screening results (Table S1). Gene ontology (GO) enrichment analysis revealed that GO terms linked to immune function, and in particular to NLR function, were significantly overrepresented among the preliminary hits (Figure S2B). In-depth analysis using Ingenuity pathway analysis highlighted that 56 of the 435 preliminary screen hits (12.9%) are known components of NF-κB signaling (Figure S2C). Among these 56 preliminary hits, 28 could be validated in the HEK293T validation screen, of which 14 were not influencing TNF-α-induced NF-κB activation.

In order to further minimize false positive hits due to off-target effects of the used siRNAs and also to exclude a cell type specific bias, the 435 preliminary candidates were further tested for their effect on endogenous NOD1-mediated NF-κB activation in human myeloid THP1 cells (THP1-blue reporter line) (Figure S2D), revealing a cluster of genes showing functional interactions as revealed by STRING analysis (Figure S2E). The results confirmed 28 genes that showed an effect on NOD1-mediated NF-κB activation in both HEK293T and THP1 cells. Among those, receptor-interacting serine/threonine-protein kinase 2 (RIPK2), NOD1, transcription factor p65 (RELA), X-linked inhibitor of apoptosis protein (XIAP), deltex 4 (DTX4), calreticulin (CALR), olfactory receptor family 12, subfamily D, member 2 (OR12D2), and ring finger protein 31 (RNF31) were the strongest candidates (>3 S.D.). Exclusion of the genes that affected TNF-induced NF-κB activation in HEK293T cells resulted in a short list of 18 genes (Figure 1C, Table S1). Although this candidate-list obtained in THP1 cells differed from that derived from HEK293T cells, the genes RIPK2, XIAP, the uracil nucleotide/cysteinyl leukotriene receptor (GPR17), SSH1, the snail family zinc finger 1 (SNAI1), and CHUK (IKKα) were confirmed as hits in both cell lines by this highly stringent procedure (Figure 1C,Table S1). Identification of RIPK2, XIAP and the inhibitor of nuclear factor kappa-B kinase subunit alpha (IKKα), all of which have recently been linked to the NOD1 pathway [7], [18], [19] validated the success of the screening procedure.
To demonstrate that we can reversely reproduce the findings from the screen, XIAP was silenced with a screen-independent siRNA. This strongly impaired NF-κB activation upon both NOD1 or NOD2 stimulation in HEK293T cells (Figure S3A and B) and THP1-blue cells (Figure S3C). Furthermore, TriDAP - or MDP-induced IL-8 secretion in THP1 cells was significantly reduced (Figure S3D). Taken together, our screen validated XIAP as an essential component of the NOD1 signaling pathway, in line with previous reports showing an involvement of XIAP in NOD1 and NOD2 signaling [7], [18]. XIAP was shown to mediate linear ubiquitylation of RIP2 [18] mediated by the so-called LUBAC complex. Of note, our screen also highlighted one component of the LUBAC complex, RNF31 (HOIP) as a strong candidate (Table S1), which was independently identified in a recent screen for components of the NOD2 signaling pathway [20]. Notably, we identified three novel genes, namely the uracil nucleotide/cysteinyl leukotriene receptor GPR17, the cofilin phosphatase SSH1 and the transcriptional repressor SNAI1 that hitherto had not been reported in the context of NOD1 signaling.
SSH1 specifically contributes to NOD1 - and NOD2-mediated inflammatory responses
Among these stringently validated hits, the phosphatase SSH1 (Table S1), a key regulator of actin dynamics (reviewed in [21]) caught our attention. In order to validate SSH1 as a critical component of NOD1 signaling, we depleted the protein by two different siRNAs in myeloid-like differentiated THP1-blue cells and measured NF-κB activity and IL-8 release upon treatment with the NOD1, NOD2, TLR4, and TNFR agonists TriDAP, MDP, LPS, and TNF, respectively (Figure 2A and B). This revealed a significant reduction of NOD1 - and NOD2-mediated inflammatory responses (Figure 2A and B) concurrent with a reduction in SSH1 levels by siRNA treatment (Figure 2C). In contrast, TNF - and TLR4-induced responses were not highly significantly affected by reduced SSH1 levels (Figure 2A and B). Similar results were obtained in THP1 cells not containing the reporter construct, showing that NOD1-mediated release of several key inflammatory cytokines was reduced upon SSH1 depletion (Figure S4).

Immunoblotting showed that both siRNAs decreased the expression of SSH1 and revealed that SSH1 protein levels were increased upon PAMP stimulation (Figure 2C). To evaluate the effect of SSH1 knock-down at early time points after activation, we measured IL-8 and SSH1 mRNA levels 3 h after TriDAP or TNF stimulation in THP1-blue cells. This showed that the reduction in SSH1 correlated with reduced IL-8 mRNA levels when cells were activated by TriDAP but not when stimulated with TNF (Figure 2D).
To elucidate the effect of SSH1 on physiological activation of NOD1 by bacteria, we infected HeLa cells with the Gram-negative invasive bacterial pathogen Shigella flexneri, which is sensed primarily by NOD1 in these cells. Depletion of SSH1 mRNA by the two SSH1-specific siRNA duplexes resulted in significantly impaired IL-8 and IL-6 production 6 h post infection with the invasive S. flexneri strain M90T (Figure 3A). Notably, this was not due to reduced bacterial invasion and replication, as demonstrated by gentamicin protection assays (Figure 3B). To decipher if SSH1 is involved preferentially in early or late events during the inflammatory response to S. flexneri, we measured IL-8 mRNA and IL-8 release at different time points after bacterial infection. Depletion of SSH1 (Figure S5A) led to greatly reduced IL-8 transcription as early as 30 min after infection (Figure 3C). Two hours post infection, when IL-8 became measurable in the supernatant of infected cells, a significant difference in IL-8 secretion was observed between cells treated with SSH1 targeting siRNA and those treated with a non-targeting control siRNA (Figure 3C). This suggests that SSH1 is already involved at early times of NOD1 activation. As expected, the knock-down of SSH1 led to a strong increase in phosphorylation of its substrate cofilin at serine 3 (Figure S5B), proving that SSH1 is active in our cellular system. To rule out that the effects described above were related to the malignant origin of the cell lines, we assessed the phenotype of SSH1 depletion in primary human dermal fibroblasts. In line with the results obtained with cell lines, in primary human dermal fibroblasts NOD1-mediated IL-8 secretion was also significantly reduced upon SSH1 knock-down, whereas SSH1 depletion affected TNF-induced IL-8 secretion to a lesser extent (Figure S5C).

Taken together, our data identified SSH1 as an essential component of NOD1-mediated activation of pro-inflammatory responses in human myeloid and epithelial cells.
SSH1 interacts with NOD1 at F-actin structures
SSH1 was reported to bind F-actin and to co-localize with actin stress fibres [22], [23]. We confirmed that ectopically expressed SSH1 partly co-localized with F-actin in HeLa cells that stably express YFP-NOD1. Although the two proteins showed slightly different localization patterns, a partial co-localization of SSH1 and NOD1 was also observed in confocal imaging (Figure S6A). In co-immunoprecipitation experiments of transiently expressed SSH1 and NOD1/2 proteins, both NOD1 and NOD2 co-precipitated with SSH1 (Figure 4A), validating that both NLR proteins are able to form a complex with SSH1. Upon activation of NOD1 by TriDAP we observed a change in the stoichiometry of this complex with an increase in affinity about 30 min after TriDAP stimulation and reduced binding at later time points (Figure 4B). To analyse this protein-protein interaction in more detail we employed in situ proximity ligation assays (PLA). We found that GFP-SSH1 and Flag-NOD1 associated predominantly at F-actin positive structures (Figure 4C). Quantitative analysis using high throughput microscopy revealed that the area covered by PLA spots was approximately 4-fold higher in cells expressing GFP-SSH1 and Flag-NOD1 than in neighbouring GFP-negative cells, confirming the specificity of the signal (Figures 4C and S6B). Moreover, the phosphatase-dead mutant C393S of SSH1 gave similar results in the PLA assays as WT SSH1 (Figure S6C) showing that association of SSH1 and NOD1 was not dependent on the phosphatase activity of SSH1. Accordingly, SSH1 was not involved in membrane targeting of NOD1 and NOD2 in HeLa cells, as the sub-cellular localization of transiently transfected NOD1 and NOD2 were not markedly changed in cells with highly reduced SSH1 expression compared to controls (Figure S7A and S7B).

It was reported that in epithelial cells SSH1 is enriched at the entry foci of Salmonella [24]. Likewise, NOD1 is enriched at entry sites of S. flexneri [9]. We thus analyzed the localization of SSH1 in S. flexneri-infected cells, revealing an enrichment of SSH1 at the bacterial entry foci (Figure 4D).
We previously reported that depolymerization of F-actin by the mycotoxin cytochalasin D enhances NOD1-mediated NF-κB activation [9]. Based on our results, we hypothesized that the impact of SSH1 on NOD1 signaling might be mediated by cofilin-controlled actin remodeling and that the formation of a SSH1-NOD1/2 complex might control the local NOD1/2 activity at sites of bacterial entry. To address this, we monitored SSH1 activity indirectly by measuring phosphorylation of its substrate cofilin at serine 3 (p-cofilin) after TriDAP-induced activation of NOD1. TriDAP treatment of HEK293T cells expressing low levels of NOD1 strongly induced IL-8 release from these cells (Figure 4E). Interestingly, basal p-cofilin levels decreased at the time when IL-8 transcription was highest (about 180 min post TriDAP treatment) (Figure 4E). After longer periods of incubation (16 h), p-cofilin levels increased above the level seen in untreated cells (Figure 4E). The slower kinetics in these experiments compared to S. flexneri infection in HeLa cells (Figure 3) is likely due to the different kinetics of TriDAP uptake in HEK293T cells [5]. Notably, no obvious change in p-cofilin levels was observed after stimulation of HEK293T cells with TNF, although TNF induced high IL-8 release (Figure 4F and S6D). Moreover, in cells in which NOD1 was depleted by siRNA TriDAP treatment did not robustly influence p-cofilin levels over time (Figure 4F). Accordingly, TriDAP failed to induce IL-8 secretion form these cells (Figure S6D). Moreover, expression of SSH1 did not result in increased basal NF-κB activity (Figure S8B).
Collectively, these data provide evidence that NOD1 signaling relies on the presence of SSH1 that acts downstream of NOD1 and involves the activation of cofilin.
NOD1 signaling is connected to changes in the actin cytoskeleton
We next asked if other components of the cofilin regulatory network also contributed to NOD1 signaling outcome. Using siRNA-mediated knock-down we confirmed that reduction of cofilin resulted in a similar perturbation of NOD1 signaling as SSH1 knock-down (Figure 5A). Cofilin is regulated primarily by phosphorylation through the kinases LIMK1/2, which is counteracted by the phosphatase activity of SSH1. Both SSH1 and LIMK1/2 are themselves regulated by phosphorylation events mediated by protein kinase D (PKD), ROCK1/2 and PAK1/4, respectively (reviewed in [25]). Expression of a dominant negative form of ROCK1 (KD-IA, which lacks kinase and Rho binding activity) enhanced, albeit not significantly, NOD1-mediated responses in a dose-dependent manner, whereas a constitutively active mutant of ROCK1 (delta1) significantly inhibited signaling by NOD1 (Figure 5B). To further substantiate this, we tested the effect of two potent chemical inhibitors of ROCK - Y-27632 and Glycyl-H1152 - on NOD1-mediated signaling. In HEK293T cells, both inhibitors enhanced TriDAP-induced NOD1-mediated NF-κB activation in a dose dependent manner, this enhancement was significant in the case of Glycyl-H1152 (Figure 5C). By contrast, both compounds led to a significant reduction of TNF-induced NF-κB responses (Figure S8A). Chemical inhibition of ROCK also led to higher NOD1-mediated pro-inflammatory responses in TriDAP stimulated HeLa and THP1 cells (Figures 5D and E). ROCK inhibition correlated in a dose dependent manner with reduced levels of p-cofilin, suggesting that increased cofilin activity causes this effect on NOD1 signaling. As shown before, stimulation of cells with TriDAP further enhanced dephosphorylation of cofilin (Figures 5D and E). To provide direct evidence that the phosphatase activity of SSH1 is responsible for modulation of NOD1 activity, we overexpressed the phosphatase-dead mutant C535S of SSH1 in HEK293T cells. In line with our hypothesis, this did not affect NOD1-mediated signaling (Figure S8C).
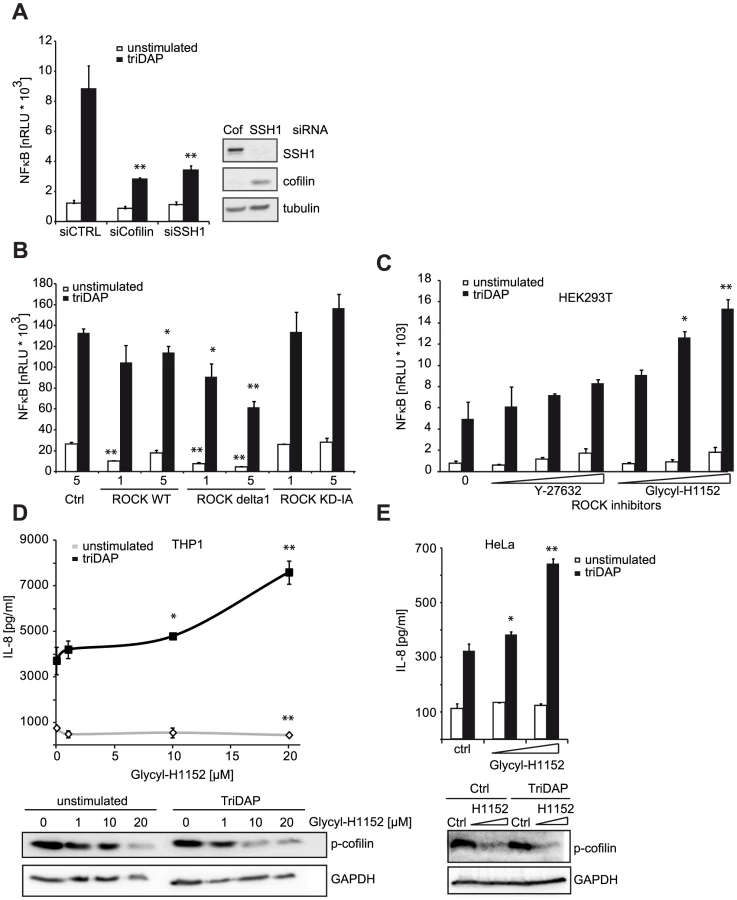
These results show that perturbation of the cofilin pathway at different levels affected NOD1 signaling, suggesting that NOD1 signaling relies on cofilin-mediated changes in actin remodeling. Accordingly, NOD1 signaling induced by actin polymerization-perturbing mycotoxins should be SSH1 independent. As reported for HEK293T cells [9], we found that depolymerization of F-actin using cytochalasin D strongly enhanced NOD1-mediated signaling in THP1 cells (Figure 6A). In line with previous reports, cytochalasin D enhanced IL-8 release induced by other PAMPs about 2-fold [26], [27]. However, in the case of NOD1 activation by TriDAP, a significantly higher increase to ∼3-fold was observed (Figure 6B). Notably, this was not the case upon activation of NOD2 by MDP. Next, we depleted SSH1 expression in THP1-blue cells and subsequently disturbed actin polymerization by cytochalasin D treatment. Knockdown of SSH1 significantly reduced NOD1-mediated NF-κB activity in cells treated with TriDAP, however, treatment with cytochalasin D rescued the effect of SSH1 depletion on TriDAP-induced NOD1 activation (Figure 6C). This strongly suggests that F-actin affects NOD1 signaling downstream of SSH1.

Taken together, our data support that NOD1 activation and induction of pro-inflammatory responses requires actin remodeling controlled by the SSH1 and cofilin network.
Discussion
Using an unbiased high-throughput siRNA screen, we identified novel factors involved in the regulation of the NOD1 signaling cascade. The validity and quality of our screening approach is highlighted by the fact that the screen identified many factors involved in canonical NF-κB and/or NOD1 signaling. Most prominently, the primary screen validated the proteins RIPK2 (reviewed in [2]), IKKα [19], IKKβ (reviewed in [2]), TAB2 [28], [29], RNF31 [30], p50 and RELA [31] as essential positive regulators of NOD1 signaling. Beside RIP2, XIAP ranked the highest throughout the whole screening procedure among the NOD1 specific hits. In line with a recent publication, we observed blunted responses of XIAP depleted cells to stimulation with NOD1 and NOD2 elicitors [7]. A recent study now provides the framework for the function of XIAP in this process, by showing that it acts as a ubiquitin ligase for RIP2, catalyzing linear ubiquitylation events, at least in NOD2 signaling [18]. By using S. flexneri as an infection model we could recently demonstrate the physiologic relevance of these findings in vitro and in vivo, underscoring the impact of XIAP on anti-bacterial immunity [32].
With high confidence the screen identified a central regulator of actin cytoskeletal dynamics, the phosphatase SSH1, as novel component of the NOD1 signaling cascade. Notably, SSH1 was recently also identified as a potential hit in two independent siRNA screening efforts searching for NOD1 and NOD2 signaling components, although it was not validated in neither of these studies [20], [33]. SSH1's best described function is the dephosphorylation and subsequent activation of the actin depolymerization factor cofilin. Its activity is known to be counter-acted by LIMK1 and LIMK2, which phosphorylate and thus inactivate cofilin on serine 3 (reviewed in [21]). Using a highly stringent and unbiased multilayer screening approach offers high confidence in the obtained data. However, candidates can be overlooked due to loss because of mismatch of quality criteria. This likely explains why cofilin, ROCK1, ROCK2 and others, although being represented in the screened library, were not identified as validated hits.
We confirmed the function of SSH1 in NOD1 signaling by independent siRNA knock-down experiments in different human cell lines and primary human dermal fibroblasts. This validated that silencing of SSH1 significantly impaired NOD1-mediated responses in human cells triggered by TriDAP and infection with the invasive bacterial pathogen S. flexneri. Consistent with the screen data, SSH1 knock-down affected TNF and LPS-induced NF-κB activation to a far lesser extent than NOD1 - and NOD2-mediated responses, showing that SSH1 contributes to NOD1 and NOD2 signaling in a rather specific manner. SSH1 thus contributed to NOD1 signaling at early times. Taken together, our results suggest that SSH1 affects NOD1 signaling through its phosphatase activity. This is best evidenced by the observation that NOD1-induced activation of IL-8 transcription was accompanied by a reduction of cofilin phosphorylation and the lack of effect of a phosphatase-dead mutant of SSH1 on NOD1 signaling. Our data do not allow drawing conclusions on how SSH1 activity is triggered in this process. However, the observed complex formation of SSH1 and NOD1, that exhibited changed stochiometry upon triggering of NOD1 by its elicitor TriDAP, makes it tempting to speculate that binding of NOD1 to a SSH1-containing complex initiates local SSH1 activation. Noteworthy, we observed that treatment with several PAMPs resulted in enhanced SSH1 proteins levels in THP1 cells. A plausible interpretation of this finding might be that higher SSH1 levels might render host cells more prone for enhanced and more rapid NOD1-mediated immune signaling. Further research will help to address this and to establish the biological significance of this finding.
Invasive bacteria, such as Shigella and Salmonella, depend on a tightly controlled spatial and local reorganization of F-actin at the plasma membrane to gain entry into the host cell. NOD1 is well-recognized as an important sensor of bacterial invasion and we showed earlier that it co-localizes with F-actin at the cell membrane and that depolymerization of F-actin by cytochalasin D augments NOD1 signaling in epithelial cells [9]. In the cell, actin dynamics are controlled by a balance between the activities of the small GTPases RhoA and Rac1 and it has been reported that changing their activity affects NOD1 and NOD2 signaling [12], [13], [34]. The pathogenic bacterium Klebsiella pneumonia seems to inhibit Rac1 activity to trigger NOD1 signaling, resulting in a dampened innate immunity response [34]. Additionally, the Rho activator guanine nucleotide exchange factor H1 (GEF-H1) was identified as an essential component of NOD1-mediated signaling in response to Shigella and muropeptides [11]. In all these studies, the mechanistic link to the modulation of NOD1 signaling, however, was not conclusively identified. Our results show that NOD1 signaling competence relies on actin remodeling via cofilin. Activation of NOD1 by chemical ligands reduced cellular p-cofilin at the time when pro-inflammatory signaling was induced. Because SSH1 and NOD1 directly interact at the plasma membrane, SSH1 might act as a local platform to recruit NOD1 to the entry site of pathogens. The fact that cofilin activity is also modulated by RhoA and Rac1 activity [25] strongly suggests that SSH1 and cofilin are key effectors that link NOD1 activation to perturbations in the network of actin regulation. In support of this notion, our data show that “sterile” interference with the cofilin pathway at several levels, as well as pharmacological disruption of the actin cytoskeleton, modulated NOD1 signaling outcome. For example, we observed enhancement of NOD1 signaling upon overexpression of a dominant negative protein of the RhoA effector kinase ROCK or pharmacological inhibition of ROCK kinases. We cannot formally exclude that the inhibitors affected other cellular targets. However, in conclusion all data strongly support that interfering with the F-actin network downstream of RhoA and upstream of cofilin profoundly alters NOD1 signaling. Finally, we observed that induction of NOD1-mediated responses by depolymerization of F-actin is independent of SSH1. Taken together, these experiments showed that NOD1 signaling outcome correlated directly with cofilin activity.
F-actin depolymerization by cytochalasin D in myeloid cells was shown to affect NF-κB signaling in a broader manner, as confirmed by our results [26], [27]. It should be noted, that a comparative analysis including multiple PRRs was not conducted in these studies. We observed a much higher synergy on the NOD1-induced NF-κB activation, indicating that NOD1 signaling is particularly prone to changes in actin dynamics. Surprisingly, also NOD2-induced IL-8 responses were less strongly enhanced by cytochalasin D in myeloid cells compared to NOD1, although SSH1 interacted with NOD2 and knock-down of SSH1 also affected NOD2-mediated signaling. Further research is needed to define the surprising differences in the contribution of the actin cytoskeleton and SSH1 to NOD1 versus NOD2 signaling. Regulation of PRR signaling by actin is not without precedence, as a role for Rac1 in regulation TLR2 function has been shown before [35]. Furthermore, there are interesting parallels in the regulation of mammalian and plant NLRs, suggesting that effector triggered immunity (ETI) in plants brought about by activation of plant NLR proteins, is also intimately linked to actin dynamics. In Arabidopsis there is genetic evidence that the actin remodeling protein ADF-4 negatively affects RPS4-mediated ETI responses, although the authors do not disclose if this is linked to changed actin dynamics [36].
Very recently it has been proposed that NOD1 acts as a sensor of Rac1 and CDC42 activity induced by bacterial type III effector proteins, such as the Salmonella virulence factor SopE [10]. It is, however, still elusive how this is mechanistically linked to changes in NOD1 activity. In any case, bacterial - induced perturbation of actin dynamics that are needed for bacterial cell entry, in particular in epithelial cells, would result in enhanced NOD1-mediated inflammatory responses. The data reported here provide novel insights into the underlying mechanisms showing that SSH1-mediated actin remodeling is a central component of NOD1 activation and innate immune responses.
Materials and Methods
Cells and bacteria
HEK293T, HeLa, THP1 and THP1-blue (InvivoGen, France) cells were cultured as described in in [37]. For immunofluorescence, a HeLa line stably expressing EGFP-tagged NOD1 was generated. All cell lines were continuously tested for absence of mycoplasma contamination by PCR. Primary human dermal fibroblasts were obtained as previously described [38].
Plasmids and reagents
Plasmids encoding myc tagged human NOD1 and NOD1 were generated by PCR cloning in a pCDNA3.1 backbone.
SSH1 encoding plasmids are described in [39]. Plasmids encoding ROCK and mutants are described in [40] and RhoA and Rac1 plasmids were a kind gift from Monilola Olayioye (University of Stuttgart). ROCK inhibitors and cytochalasin D were purchased from Tocris.
siRNA treatment
siRNA-based knock-down in HeLa and THP1 cells was performed as described previously in [37]. siRNAs used: SSH1_1 : SI00123585, SSH1_3: SI00123599 (Qiagen) and AllStars negative control (Qiagen).
Bacterial infection with Shigella flexneri
For the infection with S. flexneri, HeLa cells were seeded in 24-well plates. Infection was performed using the strain M90T afaE as described previously [41]. Gentamycin (100 µg/ml) was added to the cells 30 min after addition of the bacteria. As control, a non-invasive derivative (BS176 afaE) was used.
Uptake of S. flexneri was analyzed by lysis of infected cells in 0.5% SDS/H2O. Serial dilutions of cell lysates were plated onto trypticase soy broth bacto agar plates without antibiotics and incubated at 37°C for 24 h. Colonies were counted and the recovery was determined.
Co-immunoprecipiation and immunoblot analysis
Immunoprecipitations and immunoblots were conducted using 9E10-agarose (Santa Cruz) essentially as described previously [41]. Cells were transiently transfected with SSH1 constructs and NOD1 or NOD2 expression plasmids for 24 h. Antibodies used: mouse anti-Flag (Sigma, M2), mouse anti-myc (Santa Cruz, 9E10), HRP-conjugated goat anti-mouse IgG (Bio-Rad) and HRP-conjugated goat anti-rabbit IgG (Bio-Rad), rabbit anti-SSH1 (Abcam, 76943), rabbit anti-cofilin P-S3 (Cell Signaling, 3313), rabbit anti-cofilin (Cell Signaling, 5175), rabbit beta-actin HRP-conjugated (Santa Cruz, sc-47778 HRP), rabbit anti-alpha tubulin (Sigma, T7816), rabbit anti-GAPDH (Santa Cruz, 25778).
Luciferase reporter assays
Activation of inflammatory pathways was measured using a luciferase reporter assay described previously [16]. The means and standard deviations were calculated from triplicates.
RNA preparation and RT-PCR
Total RNA was extracted from cells using the RNeasy kit (Qiagen). One µg of RNA was reverse transcribed using the First-Strand cDNA synthesis kit (Fermentas).
For quantitative PCR analyses, 50 ng cDNA was analyzed in a total volume of 25 µl using the iQ SYBR Green Supermix (Bio-Rad), according to the manufacturer's protocol. All quantitative PCR reactions were run on a Bio-Rad iQ5 cycler, and data were evaluated by the iQ5 system software (version 2.0) using the ΔΔCT method.
For quantification of SSH1, the following primers were used (5′-3′): CGTTGCGAAGACAGAATCAA and CTCCACAGTCGGAGAACCAT. Primer for IL-8, NOD1, NOD2, and GAPDH are described in [37].
Indirect immunofluorescence microscopy
Cells were transfected using Lipofectamine 2000 (Invitrogen). After 16–24 h incubation, cells were fixed and processed as described previously [37].
DNA was stained using DAPI. Images were acquired on an Olympus Fluoview 1000 confocal microscope and processed using ImageJ.
In situ proximity ligation assay
The proximity ligation assay was performed with the Duolink system (Olink bioscience). HeLa cells grown on collagen-coated coverslips were transfected and fixed 24 h post transfection in 4% paraformaldehyde for 15 min, washed, permeabilized with 0.1% Triton X-100, and blocked with blocking buffer (Olink bioscience) for 30 min at 37°C. The cells were incubated with the primary antibodies (rabbit GFP-specific antibody and mouse Flag-specific antibody) diluted in blocking buffer for 2 h. As a negative control, GFP-SSH1 and Flag-NOD1 transfected cells, which were incubated in antibody diluent without primary antibodies, were used. Incubation with secondary antibodies and ligation and amplification were done as recommended by the manufacturer. Cells were stained with HCS Cellmask deep red (Life Technologies) and mounted in mounting medium (Olink bioscience). PLA dots were acquired with a LSM710 confocal microscope (Zeiss). F-Actin labeling (Alexa633-coupled phalloidin, Life Technologies) was performed after PLA staining. Quantifications of PLA dots were performed with HCS/HTS – based automated PLA spot detection. In brief, images were acquired on a WiSCAN Hermes system (Idea Biomedical, Israel), equipped with a Olympus 20× 0.75 NA objective. The quantitative spot analysis was performed using the WiSOFT image analysis software (Idea Biomedical, Israel). Cells were segmented via the HCS cell mask deep red staining. After segmentation, cells were classified into GFP-positive - and negative cells using a threshold in the green channel. Spots were identified in the red channel and the total area covered by all spots in one cell was calculated. Spots outside of the cell mask were not considered.
Detection of cytokines by ELISA
Measurement of cytokines was performed using the appropriate ELISA kits (Duoset, R&D) according to the manufacturer's instructions. Multiplex cytokine analysis was performed by flow cytometry using the human inflammation 2plex kit (eBioscience).
Statistical analyses
Data were analyzed by two-sided Student-t test using Microsoft Excel 2007 and GraphPad Prism 5.04.
Large scale siRNA NF-κB luciferase screen
The siRNA screen was performed using the human druggable-genome siRNA library from Qiagen (Hilden, Germany) consisting of four individual siRNAs for each gene. HEK293T cells were transfected with siRNA (20 nM) using HiPerFect (Qiagen) and treated with TriDAP (0.5 µM, InvivoGen, San Diego, CA, USA) or TNF (5 ng/ml), respectively, in case of the counterscreen.
For screening, cells with a passage number of 2 were used. The whole assay procedure was performed automatically using a Biomek FXP laboratory automation workstation (Beckman Coulter) in 384 well plates (Corning).
4 µl of 200 nM siRNAs (Qiagen) were pre-spotted on 384 well plates to allow reverse transfection of cells. All plates contained non-targeting (Allstars; Qiagen) as well as p65, NOD1, and PLK siRNAs as internal controls. For transfection, 8 µl medium per well were mixed with 0.25 µl HiPerFect and added to the siRNAs. The mixtures were incubated at RT for 15 min before adding 1,000 HEK293T cells in 30 µl medium.
After 48 h incubation the medium was changes and cells were transfected with the NF-κB-luciferase reporter system (11.6 ng β-gal plasmid, 7.03 µl NF-κB-luciferase plasmid, 0.135 ng NOD1-expression plasmid, 8.78 ng pcDNA-plasmid, and 0.0918 µl Fugene6 (Roche)). Subsequently, cells were stimulated with 0.5 µM TriDAP (InvivoGen) in a volume of 3 µl H2O. For the TNF-counterscreen, 5 ng/ml TNF were added instead. After stimulation, cells were incubated at 37°C and 5% CO2 for 16 h.
For read-out, cells were lysed by adding 30 µl 2xlysis buffer (50 mM Tris pH 8.0, 16 mM MgCl2, 2% Triton, 30% Glycerol, H2O) and subsequently mixed by pipetting. 35 µl of the lysate were then added to a white 384 well plate containing 35 µl reading-buffer (1× lysis buffer w/o Triton containing 0.77 µg/ml D-luciferin and 1.33 mM ATP). Subsequently, bioluminescence of the samples was measured with an Envision plate reader (PerkinElmer).
For β-gal read-out, 35 µl of ONPG-development buffer (4 mg/ml ONPG in 60 mM Na2HPO4, 40 mM NaH2PO4, 10 mM KCl, 1 mM MgSO4, pH 7.0) were added to the remaining lysate. After 15 min incubation at 37°C and 5% CO2, the absorbance of the samples at 405 nm was measured automatically with an Envision plate reader (PerkinElmer). Each individual siRNA was tested in 4 four biological replicates.
THP1-blue siRNA screen
For screening, the siRNAs were pre-spotted on 384 well cell culture plates. All plates contained Allstars, p65, NOD1, and PLK siRNAs as internal controls. For transfection, 0.25 µl HiPerFect were added to the siRNAs. The mixtures were incubated at RT for 15 min, before THP1-blue cells and 0.1 µM PMA (Sigma, Munich, Germany) were added. The cells were incubated for 72 h, while the growth medium was exchanged twice a day.
Subsequently, cells were stimulated with TriDAP (10 µg/ml, InvivoGen). The cells were incubated for 16 h before read-out. For SEAP-detection, 10 µl supernatant per well were transferred to a plate containing 50 µl QUANTI-Blue SEAP detection medium (InvivoGen) and incubated for 5 h. 10 µl XTT reagent were added to the remaining 10 µl and incubated at 37°C for 1 h. Absorption at 632 nm and 485 nm respectively were measured using a PerkinElmer EnVision plate reader.
Data analysis of siRNA screen
Data was processed using the CellHTS2 package [42], Bioconductor/R, and Excel (Microsoft). By dividing the luciferase signal (relative light units; RLU) by the β-gal signal (ABS405), normalized relative light units (RLU/ABS405 = nRLU) were achieved. To exclude experimental artifacts, all data from a given plate was excluded, if the average β-gal signal of the non-targeting controls (ABS405) was >2.5, <0.2, or had a standard deviation of >50%. Next, all wells showing a β-gal signal of <40% of the non-coding controls, supposedly due to low plasmid transfection efficiency or siRNA toxicity, were excluded from further analysis. Subsequently the nRLU where normalized relative to the inhibitory effect of the p65-control-siRNAs compared to the non-targeting controls (normalized percent inhibition; NPI) and median z-scores of the 4 biological replicates were calculated (centered to the median of non-targeting controls), using CellHTS2.
In the next step, the median z-scores of individual siRNAs were used to calculate a ranked gene list, using the redundant siRNA analysis algorithm; genes with less than two hit-siRNAs (‘OPI-hits’) were excluded (RSA) [17]. This list comprises genes leading to a decreased p65 activity, when knocked down (termed “inhibiting hits”).
For TNF-counter screening in HEK293T cells, as well as for hit validation in HEK293T and THP1 cells, the top 435 inhibiting hits were selected. For each of these genes, the two siRNAs showing the strongest effect in the screen were re-synthezised and assembled on 384-well plates (‘validation plates’).
To validate the results of the primary screen, the experiments were repeated as described above. Data analysis using CellHTS2 was done as described above; siRNAs were selected as ‘inhibiting Tri-DAP-hits’, if their median Z-score exceeded the median of non-targeting controls by more than two standard deviations.
To exclude unspecific hits, all siRNAs selected for validation were screened for their influence on TNF-induced p65 activation. Data analysis was done analogous to the Tri-DAP validation screen. ‘Inhibiting TNF-hits’ were excluded from further analysis.
Data from the THP1-blue screen consists of two parameters (QUANTI-Blue absorption at 632 nm for Tri-DAP response [QB], and XTT absorption at 485 nm for cell viability [XTT]) and was processed similar as described above: QB-signal of each well was normalized to cell viability (XTT), yielding nQB (normalized QUANTI-Blue absorption; QB/XTT = nQB). After quality control and outlier flagging, the three best experimental replicates were NPI-normalized to non-targeting and NOD1-control-siRNAs using CellHTS2, and median Z-scores were used for hit identification. All genes with two siRNAs showing a decrease of >1.5-fold standard deviation compared to the non-targeting control were regarded as validated inhibiting hits. A subset of these with one siRNA showing a decrease of >3.0-time standard deviation were categorized as ‘strong inhibiting hits’ (8 genes).
Gene accession numbers
SSH1: Gene ID 54434; NOD1: Gene ID 10392; NOD2: Gene ID 64127; ROCK1: Gene ID 6093; ROCK2: Gene ID 9475.
Supporting Information
Zdroje
1. AkiraS, UematsuS, TakeuchiO (2006) Pathogen recognition and innate immunity. Cell 124 : 783–801.
2. MoreiraLO, ZamboniDS (2012) NOD1 and NOD2 Signaling in Infection and Inflammation. Front Immunol 3 : 328.
3. TingJP, DuncanJA, LeiY (2010) How the noninflammasome NLRs function in the innate immune system. Science 327 : 286–290.
4. ChamaillardM, HashimotoM, HorieY, MasumotoJ, QiuS, et al. (2003) An essential role for NOD1 in host recognition of bacterial peptidoglycan containing diaminopimelic acid. Nat Immunol 4 : 702–707.
5. GirardinSE, BonecaIG, CarneiroLA, AntignacA, JehannoM, et al. (2003) Nod1 detects a unique muropeptide from gram-negative bacterial peptidoglycan. Science 300 : 1584–1587.
6. GirardinSE, TournebizeR, MavrisM, PageAL, LiX, et al. (2001) CARD4/Nod1 mediates NF-kappaB and JNK activation by invasive Shigella flexneri. EMBO Rep 2 : 736–742.
7. KriegA, CorreaRG, GarrisonJB, Le NegrateG, WelshK, et al. (2009) XIAP mediates NOD signaling via interaction with RIP2. Proc Natl Acad Sci U S A 106 : 14524–14529.
8. BertrandMJ, DoironK, LabbeK, KornelukRG, BarkerPA, et al. (2009) Cellular inhibitors of apoptosis cIAP1 and cIAP2 are required for innate immunity signaling by the pattern recognition receptors NOD1 and NOD2. Immunity 30 : 789–801.
9. KuferTA, KremmerE, AdamAC, PhilpottDJ, SansonettiPJ (2008) The pattern-recognition molecule Nod1 is localized at the plasma membrane at sites of bacterial interaction. Cell Microbiol 10 : 477–486.
10. KeestraAM, WinterMG, AuburgerJJ, FrassleSP, XavierMN, et al. (2013) Manipulation of small Rho GTPases is a pathogen-induced process detected by NOD1. Nature 496 : 233–237.
11. FukazawaA, AlonsoC, KurachiK, GuptaS, LesserCF, et al. (2008) GEF-H1 mediated control of NOD1 dependent NF-kappaB activation by Shigella effectors. PLoS Pathog 4: e1000228.
12. EitelJ, KrullM, HockeAC, N'GuessanPD, ZahltenJ, et al. (2008) Beta-PIX and Rac1 GTPase mediate trafficking and negative regulation of NOD2. J Immunol 181 : 2664–2671.
13. Legrand-PoelsS, KustermansG, BexF, KremmerE, KuferTA, et al. (2007) Modulation of Nod2-dependent NF-kappaB signaling by the actin cytoskeleton. J Cell Sci 120 : 1299–1310.
14. LipinskiS, GrabeN, JacobsG, Billmann-BornS, TillA, et al. (2012) RNAi screening identifies mediators of NOD2 signaling: implications for spatial specificity of MDP recognition. Proc Natl Acad Sci U S A 109 : 21426–21431.
15. MizunoK (2013) Signaling mechanisms and functional roles of cofilin phosphorylation and dephosphorylation. Cell Signal 25 : 457–469.
16. ZurekB, BieligH, KuferTA (2011) Cell-based reporter assay to analyze activation of Nod1 and Nod2. Methods Mol Biol 748 : 107–119.
17. KonigR, ChiangCY, TuBP, YanSF, DeJesusPD, et al. (2007) A probability-based approach for the analysis of large-scale RNAi screens. Nat Methods 4 : 847–849.
18. DamgaardRB, NachburU, YabalM, WongWW, FiilBK, et al. (2012) The ubiquitin ligase XIAP recruits LUBAC for NOD2 signaling in inflammation and innate immunity. Mol Cell 46 : 746–758.
19. KimML, JeongHG, KasperCA, ArrieumerlouC (2010) IKKalpha contributes to canonical NF-kappaB activation downstream of Nod1-mediated peptidoglycan recognition. PLoS One 5: e15371.
20. WarnerN, BurberryA, FranchiL, KimYG, McDonaldC, et al. (2013) A genome-wide siRNA screen reveals positive and negative regulators of the NOD2 and NF-kappaB signaling pathways. Sci Signal 6: rs3.
21. HuangTY, DerMardirossianC, BokochGM (2006) Cofilin phosphatases and regulation of actin dynamics. Curr Opin Cell Biol 18 : 26–31.
22. KuritaS, WatanabeY, GunjiE, OhashiK, MizunoK (2008) Molecular dissection of the mechanisms of substrate recognition and F-actin-mediated activation of cofilin-phosphatase Slingshot-1. J Biol Chem 283 : 32542–32552.
23. YamamotoM, Nagata-OhashiK, OhtaY, OhashiK, MizunoK (2006) Identification of multiple actin-binding sites in cofilin-phosphatase Slingshot-1L. FEBS Lett 580 : 1789–1794.
24. DaiS, SarmierePD, WigganO, BamburgJR, ZhouD (2004) Efficient Salmonella entry requires activity cycles of host ADF and cofilin. Cell Microbiol 6 : 459–471.
25. OlayioyeMA, BarisicS, HausserA (2013) Multi-level control of actin dynamics by protein kinase D. Cell Signal 25 : 1739–1747.
26. KustermansG, El BennaJ, PietteJ, Legrand-PoelsS (2005) Perturbation of actin dynamics induces NF-kappaB activation in myelomonocytic cells through an NADPH oxidase-dependent pathway. Biochem J 387 : 531–540.
27. KustermansG, El MjiyadN, HorionJ, JacobsN, PietteJ, et al. (2008) Actin cytoskeleton differentially modulates NF-kappaB-mediated IL-8 expression in myelomonocytic cells. Biochem Pharmacol 76 : 1214–1228.
28. AbbottDW, YangY, HuttiJE, MadhavarapuS, KelliherMA, et al. (2007) Coordinated regulation of Toll-like receptor and NOD2 signaling by K63-linked polyubiquitin chains. Mol Cell Biol 27 : 6012–6025.
29. HasegawaM, FujimotoY, LucasPC, NakanoH, FukaseK, et al. (2008) A critical role of RICK/RIP2 polyubiquitination in Nod-induced NF-kappaB activation. EMBO J 27 : 373–383.
30. BianchiK, MeierP (2009) A tangled web of ubiquitin chains: breaking news in TNF-R1 signaling. Mol Cell 36 : 736–742.
31. HaydenMS, GhoshS (2008) Shared principles in NF-kappaB signaling. Cell 132 : 344–362.
32. AndreeM, SeegerJM, SchullS, CoutelleO, Wagner-StippichD, et al. (2014) BID-dependent release of mitochondrial SMAC dampens XIAP-mediated immunity against Shigella. EMBO J. in press.
33. YeretssianG, CorreaRG, DoironK, FitzgeraldP, DillonCP, et al. (2011) Non-apoptotic role of BID in inflammation and innate immunity. Nature 474 : 96–99.
34. RegueiroV, MorantaD, FrankCG, LarrarteE, MargaretoJ, et al. (2011) Klebsiella pneumoniae subverts the activation of inflammatory responses in a NOD1-dependent manner. Cell Microbiol 13 : 135–153.
35. ArbibeL, MiraJP, TeuschN, KlineL, GuhaM, et al. (2000) Toll-like receptor 2-mediated NF-kappa B activation requires a Rac1-dependent pathway. Nat Immunol 1 : 533–540.
36. PorterK, ShimonoM, TianM, DayB (2012) Arabidopsis Actin-Depolymerizing Factor-4 links pathogen perception, defense activation and transcription to cytoskeletal dynamics. PLoS Pathog 8: e1003006.
37. MenningM, KuferTA (2013) A role for the Ankyrin repeat containing protein Ankrd17 in Nod1 - and Nod2-mediated inflammatory responses. FEBS Lett 587 : 2137–2142.
38. ZigrinoP, DrescherC, MauchC (2001) Collagen-induced proMMP-2 activation by MT1-MMP in human dermal fibroblasts and the possible role of alpha2beta1 integrins. Eur J Cell Biol 80 : 68–77.
39. BarisicS, NagelAC, Franz-WachtelM, MacekB, PreissA, et al. (2011) Phosphorylation of Ser 402 impedes phosphatase activity of slingshot 1. EMBO Rep 12 : 527–533.
40. IshizakiT, NaitoM, FujisawaK, MaekawaM, WatanabeN, et al. (1997) p160ROCK, a Rho-associated coiled-coil forming protein kinase, works downstream of Rho and induces focal adhesions. FEBS Lett 404 : 118–124.
41. KuferTA, KremmerE, BanksDJ, PhilpottDJ (2006) Role for erbin in bacterial activation of Nod2. Infect Immun 74 : 3115–3124.
42. BoutrosM, BrasLP, HuberW (2006) Analysis of cell-based RNAi screens. Genome Biol 7: R66.
Štítky
Hygiena a epidemiologie Infekční lékařství LaboratořČlánek vyšel v časopise
PLOS Pathogens
2014 Číslo 9
- Parazitičtí červi v terapii Crohnovy choroby a dalších zánětlivých autoimunitních onemocnění
- Vakcíny proti klíšťové encefalitidě
- Kdy je nejlepší očkovat
- Možné vedlejší účinky očkování
- Imunogenita vakcín
Nejčtenější v tomto čísle
- The Secreted Peptide PIP1 Amplifies Immunity through Receptor-Like Kinase 7
- Symbionts Commonly Provide Broad Spectrum Resistance to Viruses in Insects: A Comparative Analysis of Strains
- MIF Contributes to Associated Immunopathogenicity Development
- The Ins and Outs of Rust Haustoria
Zvyšte si kvalifikaci online z pohodlí domova
Mazová zátka a její řešení
nový kurzVšechny kurzy