
Severe Acute Respiratory Syndrome Coronavirus Envelope Protein Regulates Cell Stress Response and Apoptosis
Severe acute respiratory syndrome virus (SARS-CoV) that lacks the envelope (E) gene (rSARS-CoV-ΔE) is attenuated in vivo. To identify factors that contribute to rSARS-CoV-ΔE attenuation, gene expression in cells infected by SARS-CoV with or without E gene was compared. Twenty-five stress response genes were preferentially upregulated during infection in the absence of the E gene. In addition, genes involved in signal transduction, transcription, cell metabolism, immunoregulation, inflammation, apoptosis and cell cycle and differentiation were differentially regulated in cells infected with rSARS-CoV with or without the E gene. Administration of E protein in trans reduced the stress response in cells infected with rSARS-CoV-ΔE or with respiratory syncytial virus, or treated with drugs, such as tunicamycin and thapsigargin that elicit cell stress by different mechanisms. In addition, SARS-CoV E protein down-regulated the signaling pathway inositol-requiring enzyme 1 (IRE-1) of the unfolded protein response, but not the PKR-like ER kinase (PERK) or activating transcription factor 6 (ATF-6) pathways, and reduced cell apoptosis. Overall, the activation of the IRE-1 pathway was not able to restore cell homeostasis, and apoptosis was induced probably as a measure to protect the host by limiting virus production and dissemination. The expression of proinflammatory cytokines was reduced in rSARS-CoV-ΔE-infected cells compared to rSARS-CoV-infected cells, suggesting that the increase in stress responses and the reduction of inflammation in the absence of the E gene contributed to the attenuation of rSARS-CoV-ΔE.
Published in the journal:
. PLoS Pathog 7(10): e32767. doi:10.1371/journal.ppat.1002315
Category:
Research Article
doi:
https://doi.org/10.1371/journal.ppat.1002315
Summary
Severe acute respiratory syndrome virus (SARS-CoV) that lacks the envelope (E) gene (rSARS-CoV-ΔE) is attenuated in vivo. To identify factors that contribute to rSARS-CoV-ΔE attenuation, gene expression in cells infected by SARS-CoV with or without E gene was compared. Twenty-five stress response genes were preferentially upregulated during infection in the absence of the E gene. In addition, genes involved in signal transduction, transcription, cell metabolism, immunoregulation, inflammation, apoptosis and cell cycle and differentiation were differentially regulated in cells infected with rSARS-CoV with or without the E gene. Administration of E protein in trans reduced the stress response in cells infected with rSARS-CoV-ΔE or with respiratory syncytial virus, or treated with drugs, such as tunicamycin and thapsigargin that elicit cell stress by different mechanisms. In addition, SARS-CoV E protein down-regulated the signaling pathway inositol-requiring enzyme 1 (IRE-1) of the unfolded protein response, but not the PKR-like ER kinase (PERK) or activating transcription factor 6 (ATF-6) pathways, and reduced cell apoptosis. Overall, the activation of the IRE-1 pathway was not able to restore cell homeostasis, and apoptosis was induced probably as a measure to protect the host by limiting virus production and dissemination. The expression of proinflammatory cytokines was reduced in rSARS-CoV-ΔE-infected cells compared to rSARS-CoV-infected cells, suggesting that the increase in stress responses and the reduction of inflammation in the absence of the E gene contributed to the attenuation of rSARS-CoV-ΔE.
Introduction
Severe acute respiratory syndrome coronavirus (SARS-CoV) was identified as the etiological agent of a respiratory disease that emerged in Guandong Province, China at the end of 2002, and spread to 32 countries in a few months [1], [2], [3], [4], [5], [6], [7]. SARS-CoV infected 8000 people in 2002–2003, with an average mortality of 10%. After July 2003, only a few community and laboratory-acquired cases have been reported (http://www.who.int/csr/sars/en/). Nevertheless, coronaviruses similar to the one that caused the epidemic are widely disseminated in bats circulating all over the world, making a future outbreak possible [8], [9], [10].
SARS-CoV is an enveloped, single-stranded positive sense RNA virus, with a genome of 29.7 kb. The coronavirus replicase gene is encoded within the 5′ two thirds of the genome, and includes two overlapping open reading frames (ORFs) named ORF1a and ORF1b. Translation of both ORFs in the cytoplasm of infected cells results in the synthesis of two large polyproteins, pp1b and pp1ab, processed by two viral proteases to yield 16 non structural proteins (nsps) [11], [12]. The nsps are involved in genome replication and transcription of subgenomic mRNAs (sg mRNAs) that encode structural proteins such as the nucleocapsid (N), envelope (E), membrane (M), and spike (S), and a set of group-specific proteins whose sequence and number differ among the different coronavirus species [13]. In the case of SARS-CoV, the group-specific proteins 3a, 6, 7a and 7b, are also structural proteins [14], [15], [16], [17], [18].
SARS-CoV E protein, a small integral membrane protein of 76 amino acids, contains a short hydrophilic amino-terminus followed by a hydrophobic region and a hydrophilic carboxy-terminus [19]. The hydrophobic region forms at least one amphipathic α-helix that oligomerizes to form an ion-conductive pore in membranes [19]. Furthermore, HCoV-229E, murine hepatitis virus (MHV), SARS-CoV, and infectious bronchitis virus (IBV) E proteins form ion channels permeable to monovalent cations [20], [21], [22]. The E protein from genus α transmissible gastroenteritis coronavirus (TGEV) is essential for the generation of propagation competent viruses [23], [24], [25]. In contrast, genus β MHV and SARS-CoV E proteins are not completely essential for the generation of infectious viruses [26], [27], [28]. SARS-CoV lacking the E protein is attenuated in different animal models for SARS, such as hamsters and transgenic mice that express the SARS-CoV receptor, human angiotensin converting enzyme 2 (hACE-2) [26], [27].
Virus infection may result in the expression of stress proteins, like heat shock proteins (hsps), glucose-regulated proteins (GRPs) and ubiquitin [29]. Some of these proteins are constitutively expressed, while others are induced by proteotoxic stresses such as protein overload, heat shock, hypoxia, ischemia, heavy metals, radiation, calcium increase, reactive oxygen species, and drugs, in addition to virus infection [30]. Stress proteins may act as molecular chaperones, participating in protein synthesis, folding, transport, cell viability [31], and modulating the immune response [32]. Increasing evidence suggests that certain hsps play a role in both innate and adaptive immunity [32], [33]. Hsps can act independently of chaperoned peptides to directly stimulate innate immune responses, such as the maturation and activation of dendritic cells, and the activation of natural killer cells (reviewed in [33]).
Coronavirus infection generates double membrane vesicles [34], [35] derived from the endoplasmic reticulum (ER), in which the RNA virus genome is replicated and transcribed [36]. In addition, enveloped viruses modify and perturb membranes to generate new virus particles. This extensive use of intracellular membranes for virus replication and morphogenesis likely overloads the ER during infection, causing ER stress responses and triggering the unfolded protein response (UPR). The UPR increases the production of chaperones that facilitate protein folding, promotes the synthesis of lipids that constitute cellular membranes and inhibits translation in order to reduce ER stress [37]. The UPR is mediated by three ER-resident transmembrane proteins that are activated through binding to unfolded proteins: PKR-like ER kinase (PERK), activating transcription factor 6 (ATF6), and inositol-requiring enzyme 1 (IRE-1) [38], [39], [40]. Upon activation, PERK dimerizes and autophosphorylates. This protein phosphorylates eIF2α, leading to the inhibition of translation. ATF6 activation involves the translocation of this protein to the Golgi compartment, where site 1 and site 2 proteases process the 90 KDa form to create a 50 KDa form, the ATF6α(C), a soluble transcription factor that translocates to the nucleus and upregulates the expression of genes involved in protein folding. IRE-1 mediates the splicing of the mRNA encoding the transcription factor X box-binding protein 1 (XBP-1), leading to a frame shift and translation of a functional XBP-1 protein. The active transcription factor (sXBP-1) can then stimulate the transcription of genes encoding proteins that promote the folding, transport, and degradation of ER proteins, and lipid biosynthesis.
The ER stress response acts to restore ER homeostasis. However, when homeostasis cannot be restored, persistent or intense ER stress can also trigger programmed cell death or apoptosis [41], a physiological mechanism to control the number of cells during development and to respond to infections. Autopsy studies have revealed signs of apoptosis in SARS-CoV-infected tissues from patients, such as lung, spleen and thyroid [42], [43]. Accordingly, it has been shown that the infection by SARS-CoV triggers apoptosis in cell cultures via protein kinase R (PKR) [44] and that at least eight SARS-CoV-encoded proteins induce apoptosis [45].
The expression of genes leading to hyperinflammation has been associated with SARS-CoV-induced pathology. In fact, highly elevated expression of inflammatory mediators such as interleukin (IL)-1, -6, and -8, CXCL10/interferon-inducible protein (IP)-10, CCL2/monocyte chemoattractant protein (MCP)-1, CCL5/regulated on activation, normal T expressed and secreted (RANTES), and CXCL9/monokine induced by interferon gamma (MIG), has been described within the circulation and lungs of SARS patients [46], [47], [48], [49], [50], [51].
In this study, the effect of SARS-CoV E protein on host cell responses during virus infection was analyzed for the first time by comparing the transcriptomes of rSARS-CoV-ΔE and rSARS-CoV-infected cells using microarrays and quantitative reverse transcription polymerase chain reaction (qRT-PCR). We showed that SARS-CoV E protein influenced the expression of genes associated to stress response, immunoregulation, inflammation, apoptosis, and cell cycle and differentiation. Among these changes, the effect on stress response was most robust, based on both the number of differentially expressed genes regulating this activity and on the extent of the changes observed. This downregulation of the stress response in the presence of gene E was specific as this process was reversed by providing E protein in trans. In addition, we showed that E protein reduced the cellular stress caused by another respiratory virus, respiratory syncytial virus (RSV), and two drugs (tunicamycin and thapsigargin) that induce stress by different mechanisms. Furthermore, the presence of E protein reduced the activation of the IRE-1 mediated pathway during the UPR. However, the activation of these signaling pathways in the absence of E protein was not sufficient to reverse the cellular stress induced by rSARS-CoV-ΔE since infected cells underwent apoptosis. In addition, the absence of E protein increased the expression of the double specificity phosphatases (DUSP)-1 and DUSP-10, and down regulated proinflammatory cytokines such as CCL2 and CXCL2. Therefore, the effect of E protein on the stress response, including the UPR, and on proinflammatory cytokine expression may explain the attenuation of rSARS-CoV-ΔE in vivo.
Results
Growth kinetics of SARS-CoV in Vero E6 and MA-104 cells
To study the host response elicited by SARS-CoV, it is essential to use cell lines, such as Vero E6, MA-104, CaCo-2, Huh7, FRhK-4, PK15, HepG2, 293 and 293T cells, that are highly susceptible to infection with SARS-CoV [52], [53], . To determine whether these cell lines were also susceptible to rSARS-CoV-ΔE, virus growth kinetics studies were performed. rSARS-CoV-ΔE passaged 16 times in Vero E6 cells (P16) was analyzed, as this virus grew with titers similar to those of rSARS-CoV, around 10-fold higher than virus passaged only once (P1). rSARS-CoV-ΔE-P16 contained only a single nucleotide substitution at amino acid 607 of the S gene (S607F) compared to the P1 virus [56]. Both rSARS-CoV-ΔE P1 and the P16 were attenuated in the highly susceptible transgenic mice model [56], showing that the deletion of the E gene, and not the amino acid substitution in S protein, was responsible for virus attenuation. All the cell lines indicated above were infected with SARS-CoV with and without E gene at a multiplicity of infection (moi) of 1, 3 and 5 and the percentage of infected cells at 24 hours post infection (hpi) was determined using an immunofluorescence assay. Similar results were obtained both in SARS-CoV and rSARS-CoV-ΔE-infected cells, so only the results obtained with SARS-CoV-infected cells are provided in Supplementary Table SI. An increase in the moi led to a higher proportion of infected cells in all cell lines. The percentage of infected cells was below 40% in all cases, except for African green monkey kidney Vero E6 and MA-104 cells (Supplementary Table S1), which have or do not have, respectively, a defect in interferon (IFN) production [57], [58]. More than 90% of Vero E6 cells were infected with rSARS-CoV-ΔE or rSARS-CoV at 24 hpi, whereas in the case of MA-104 cells, more than 80% of the cells were infected with both viruses at 24 hpi (Supplementary Table S1). The growth kinetics of rSARS-CoV-ΔE and rSARS-CoV in Vero E6 cells at an moi of 2 showed similar profiles and titers for both viruses, reaching maximum titers and cytopathicity at 15 hpi (Fig. 1A). In contrast, in the case of MA-104 cells, although growth kinetics for rSARS-CoV-ΔE and the parental virus were similar, a 10-fold reduction in virus titers was observed in cells infected with rSARS-CoV-ΔE virus (Fig. 1A). This difference is not unexpected, as the ΔE virus that was used in these experiments was passaged and adapted to growth in Vero E6, but not in MA-104 cells. The cytopathic effect in MA-104 cells was evident at 48 hpi and maximum virus titers were reached at 65 hpi (Fig. 1A). The kinetics of genomic RNA and N gene sg mRNA accumulation were similar in rSARS-CoV-ΔE and rSARS-CoV-infected Vero E6 and MA-104 cells, as determined by qRT-PCR (Fig. 1B and 1C), indicating that SARS-CoV E protein had no influence on the accumulation of viral RNAs. Maximum levels of both types of viral RNA were observed at 15–22 hpi, in the case of infected Vero E6 cells and at 48 hpi in the case of MA-104 cells. These data showed that although Vero E6 and MA-104 cells were susceptible to SARS-CoV, the kinetics of the infection was slower in MA-104 than in Vero E6 cells, which needs to be considered when cellular mRNAs are collected for differential gene expression studies.

Effect of SARS-CoV E protein on host gene expression
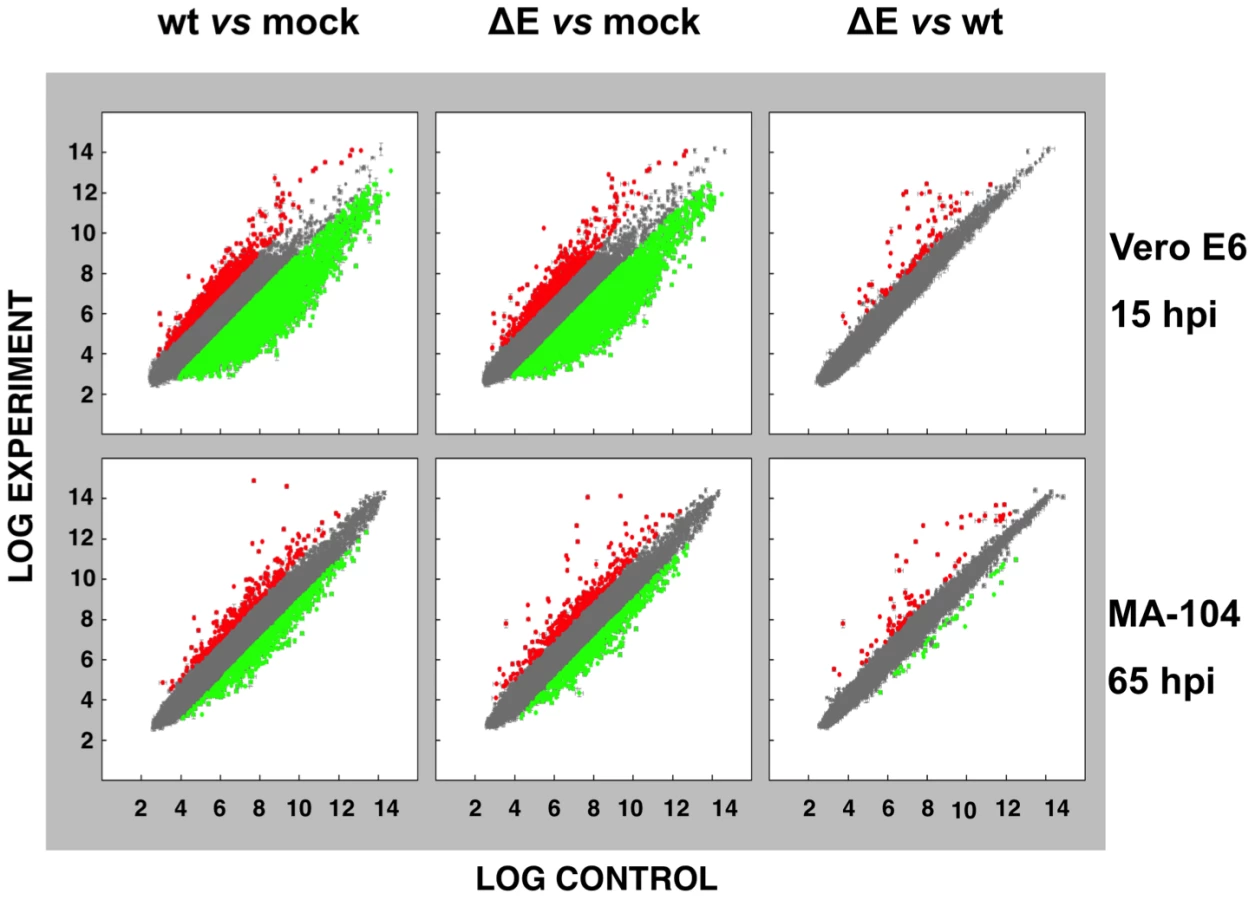
To analyze the impact of E protein on host gene expression during SARS-CoV infection, the transcriptomes of rSARS-CoV-ΔE and rSARS-CoV-infected Vero E6 and MA-104 cells were compared. Taking into account the data obtained in Figure 1, early (7 hpi in the case of Vero E6, and 24 hpi in the case of MA-104 cells), and late (15 and 65 hpi, in Vero E6 and MA-104 cells, respectively) times post-infection (pi), were analyzed. Microarray-based studies of global gene responses were performed in triplicate in each case. As there are no commercially available microarrays specific for African green monkey species, and the sequence homology between humans and monkeys is very high [59], human U133 plus 2.0 microarrays were used. The results of the microarray analysis have been deposited in the Gene Expression Omnibus (GEO, NCBI, accession code GSE30589). Only those genes showing significant expression changes (i.e., 2.0-fold and false discovery rate (FDR)<0.01) at each time point were selected for further investigation. Comparison of gene expression in cells infected with rSARS-CoV with or without E gene versus mock-infected cells showed that more that 800 cellular genes were differentially expressed at late time post-infection (Fig. 2) and that the number of genes differentially expressed increased over time (i.e. in the case of Vero E6 cells, 4940 annotated genes for rSARS-CoV versus mock-infected cells at 15 hpi, compared to 1324 annotated genes at 7 hpi; for MA-104 cells, 971 annotated genes for rSARS-CoV versus mock-infected cells at 65 hpi, compared to 11 annotated genes at 24 hpi). Interestingly, the number of annotated genes differentially expressed in cells infected with rSARS-CoV-ΔE compared to rSARS-CoV, in which the only difference is the expression of E gene, was reduced to 57 (Vero E6 cells) or to 72 (MA-104 cells) at 15 or 65 hpi, respectively (Fig. 2). These genes were classified according to their most commonly accepted functions (Fig. 3). A high number of genes related to stress responses (19 out of 57 in Vero E6 cells, and 19 out of 72 in MA-104 cells) were differentially expressed, with 2 - to 35-fold increases. The pattern of genes upregulated in rSARS-CoV-ΔE compared to rSARS-CoV-infected cells was very similar in Vero E6 and MA-104 cells, and included different isoforms of heat shock protein (hsp) (hsps-10, -27, -40, -60, -70, -90 and -105/110), and different genes encoding ubiquitins and chaperonins (Fig. 3). These data clearly indicated that the cellular stress induced by the infection was significantly reduced in the presence of E protein. Nevertheless, it is worthy to mention that not all cellular stress genes were differentially expressed in cells infected with SARS-CoV lacking E protein versus those infected with rSARS-CoV. In fact, a set of genes coding for different isoforms of hsp40, hsp70, and hsp 90, also modified their expression between −11.0 and and +4.0-fold but to a similar extent in rSARS-CoV-ΔE and rSARS-CoV-infected cells when compared with mock infected ones (Fig. S1).

Differentially expressed genes were also involved in signal transduction, transcription, cell metabolism, immunoregulation, inflammation, apoptosis and cell cycle and differentiation, although to a lower extent (Fig. 3). Among the genes involved in signal transduction, the upregulation of DUSP1 and DUSP10 may be relevant in rSARS-CoV-ΔE attenuation, as these genes are involved in down regulating cellular responses associated with different types of stress. Furthermore, these genes reduce the inflammatory response induced by viral infections by negatively regulating mitogen-activated protein kinase (MAPK) signaling [60]. Accordingly, the expression of the proinflammatory cytokines CCL2 and CXCL2 was reduced in rSARS-CoV-ΔE-infected, compared to rSARS-CoV-infected MA-104 cells.
Consistent with the mRNA results, we detected increases in the levels of representative stress proteins, such as hsp60 and hsp90 although differences were not as great as observed when mRNA levels were assessed (Fig. 4). Lesser effects on protein levels may reflect inhibitory effects of SARS-CoV on non-viral protein synthesis [61] or, alternatively to the presence of pre-existing stress proteins in cells prior to infection.

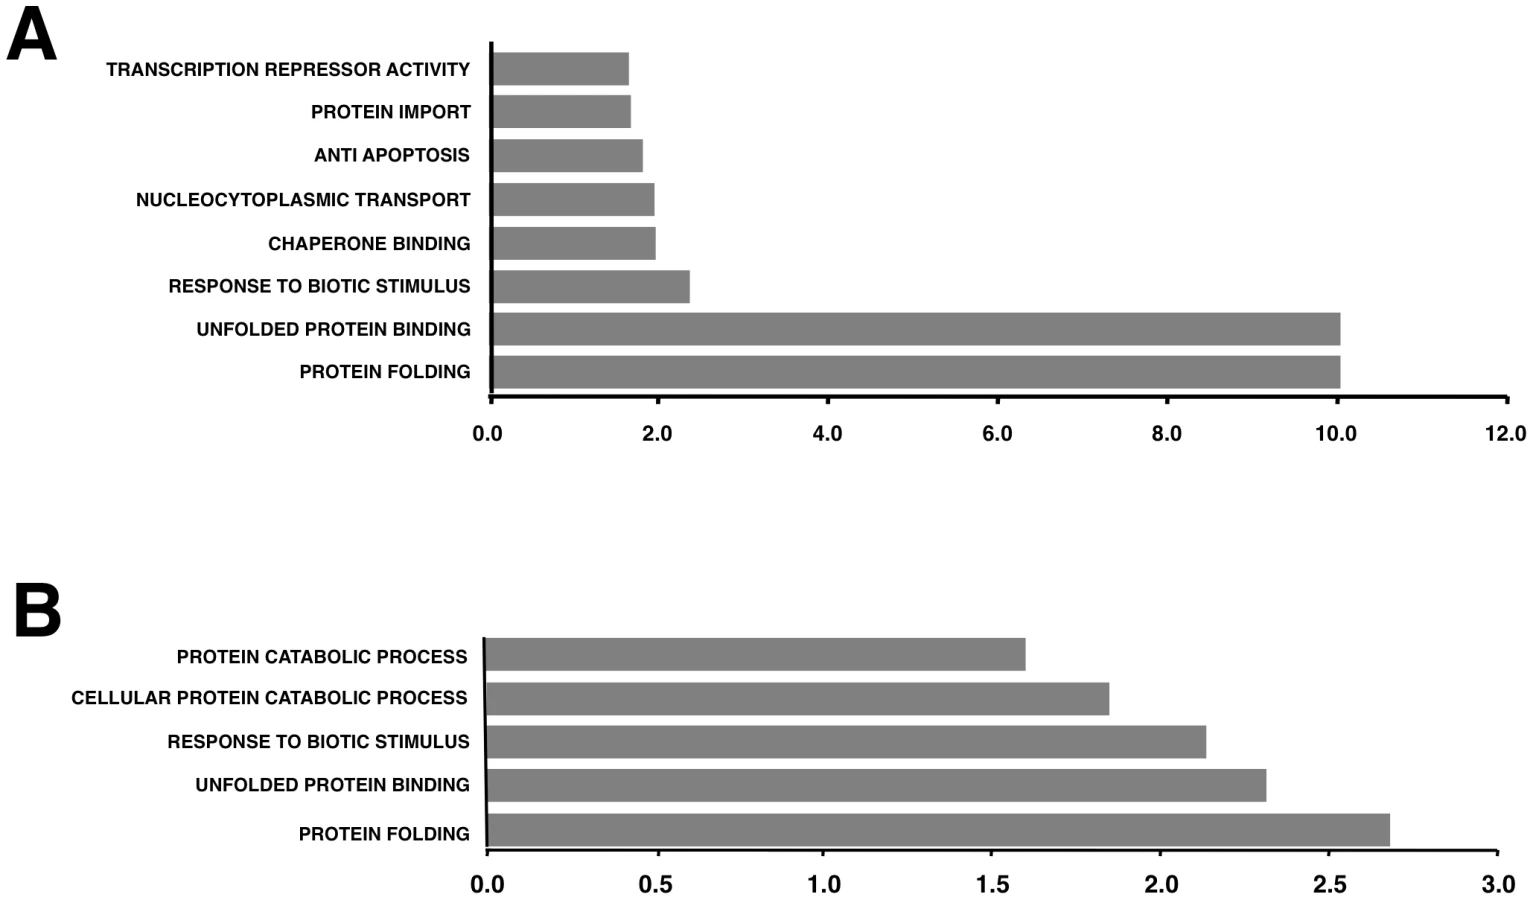
To better understand the biological relevance of the SARS-CoV E protein on host gene expression, all of the genes that were significantly upregulated or downregulated in rSARS-CoV-ΔE-infected compared to rSARS-CoV-infected Vero E6 and MA-104 cells were clustered in functional groups based on gene ontology (GO) classification. A summary is shown in Fig. 5. In contrast, no enriched GO terms were found for genes that were downregulated in MA-104-infected cells. All of the functionally enriched GO terms were related to cellular stress (chaperone binding, response to biotic stimulus, unfolded protein binding, protein folding), cellular death (anti-apoptosis), cellular transport (protein import, nucleocytoplasmic transport), transcription (transcription repressor activity) and metabolism (protein catabolic process, cellular protein catabolic process). Remarkably, similar, highly significant (FDR<0.01) changes in levels of genes related to cellular stress response to biotic stimulus, unfolded protein binding and protein folding were identified in both Vero E6 and MA-104-infected cells (Fig. 5).
To validate the results obtained with the cDNA microarrays, the differential expression of a wide set of cellular genes observed in cells infected with rSARS-CoV with or without the E gene was evaluated by qRT-PCR. 18S ribosomal RNA (rRNA) was used in all cases to normalize the data because differences in levels of this RNA were always lower than 1.5-fold and because the 18S rRNA has also been used successfully in similar reports [62], [63]. The patterns of differential gene expression obtained by qRT-PCR analysis were similar to those observed with the microarray data (Figs. 3 and 6), validating the results obtained with both techniques. Nevertheless, in the case of genes with large differences in expression between rSARS-CoV and rSARS-CoV-ΔE-infected cells determined using microarrays, changes were even larger when evaluated by qRT-PCR.

Influence of SARS-CoV E protein on cell stress response
To confirm the effect of the E protein on the stress response, total RNA from infected cell cultures were analyzed at different times pi (15, 22 and 28 hpi in the case of Vero E6 cells, and 24, 48, 65 and 75 hpi, in the case of MA-104 cells) for the expression of genes related to cytosolic (hsp70 A1B and hsp90 AB1), ER (hspA5/GRP78), and mitochondrial (hsp60 D1) stress by qRT-PCR. Maximal differences in the upregulation of the three types of stress responses in rSARS-CoV-ΔE compared to rSARS-CoV were observed at 22 and 65 hpi in Vero E6 and MA-104 cells, respectively (Fig. S2). Consequently, these time points were selected to further analyze the stress responses elicited by these viruses (Fig. 6). Using microarrays, we observed that nineteen genes involved in cytosolic stress were upregulated at least 2.5-fold (FDR<0.01) in rSARS-CoV-ΔE-infected compared to rSARS-CoV-infected Vero E6 cells (15 hpi) and MA-104 cells (65 hpi). Changes in expression of these cytosolic stress genes were confirmed by qRT-PCR (Fig. 6) and shown to be highly significant (from 2.4 to 42.5-fold in Vero E6 cells, and from 3.1 to 372.3-fold in MA-104 cells). In addition, we confirmed the effect of E protein on ER (GRP78, GRP94, DNAJC3 and SERPINH1) and mitochondrial (hspA9, hsp10 E1, and hsp60 D1) stress, using infected Vero E6 and MA-104 cells (Fig. 6), with differences in gene expression that were up to 23.4 or 13.0-fold greater for ER and mitochondrial stress, respectively. These data reinforced the conclusion that SARS-CoV E protein reduced cellular stress induced by SARS-CoV, and that this reduction affected the cytosol, ER, and mitochondria.
In the experiments described above, virus without E protein was passaged 16 times, resulting in a virus with a 10-fold increase in titer, and a single point mutation in the S gene. To rule out the possibility that the mutation in the S gene was responsible for the observed increase in cellular stress, and not the absence of E protein, the induction of stress genes in cells infected with rSARS-CoV-ΔE-p1, which has an RNA genome sequence identical to that of the parental virus except for the deletion of gene E, was analyzed. Total RNA from Vero E6 cultures infected with the original viruses (P1) with or without E protein, and with the virus lacking E protein passaged 16 times, was extracted at 22 hpi. The expression of cellular genes involved in cytosolic, ER, and mitochondrial stress was evaluated by qRT-PCR. Cellular stress genes were upregulated to similar extents in cells infected with the viruses lacking the E gene (either from P1 or P16) compared to cells infected with virus expressing the E gene (Fig. S3). These data indicated that the mutation in gene S was not responsible for the observed differences in stress response, and confirmed that E protein itself down regulated the cellular stress in virus-infected cells.
To reinforce the conclusion that SARS-CoV E protein was responsible for the reduction of cellular stress, we transfected the E gene into rSARS-CoV-ΔE-infected cells together with controls. Vero E6 cells were infected with viruses lacking the E gene (P1 and P16) or with virus expressing the E gene, and 90 min later, cells were transfected with the plasmid pcDNA3.1-E, encoding the E protein, or with empty plasmid as a control. E protein was expressed in cells transfected with plasmids expressing this protein, although levels were 10-fold lower than in SARS-CoV infected cells, as shown by Western-blot analysis (Fig. 7A). As an additional control, the effect of E protein expression on the replication of SARS-CoV with or without E gene was studied (Fig. 7B). E protein added in trans had no significant effect on rSARS-CoV-P16 or rSARS-CoV-ΔE titers, indicating that the absence of E protein in rSARS-CoV-ΔE, and not the amount of virus produced, was responsible for the increase in cell stress response. The expression of stress genes hsp70 A1A, hsp90 AA1, hspH1, SERPINH1, and hsp10 E1 in cells infected with rSARS-CoV-ΔE viruses (P1 and P16) or rSARS-CoV, in the presence or absence of the transfected E gene, was analyzed by qRT-PCR (Figs. 7C and S4). The expression of all analyzed stress-induced genes was clearly upregulated in cells infected with virus lacking E protein, compared to those infected with rSARS-CoV. When E protein was provided in trans, the expression of these genes in rSARS-CoV-ΔE-infected cells was clearly reduced. To analyze whether the decreased expression of stress-related genes in the presence of E protein was specific, the expression of the gene encoding DNA polymerase theta (polQ) was evaluated. No significant differences were observed in the expression of polQ, irrespective of the presence or absence of E protein (Figs. 7C and S4), suggesting that the reduction of stress-related genes was specific. In addition, the expression of 18S rRNA was analyzed as an endogenous control for the amount of RNA in all samples (Figs. 7C and S4). These data indicated that E protein reduced the stress caused by SARS-CoV infection.

To analyze whether E protein alone could reduce the cellular stress caused by another virus, the effect of SARS-CoV E protein on the stress induced by RSV was analyzed. Vero E6 cells were transfected with a plasmid encoding E protein or with empty plasmid as control. At 24 hours post-transfection (hpt), Vero E6 cells were infected with RSV or left uninfected, and RNA was extracted at the indicated hpi. The expression of E protein in cells infected with RSV was confirmed by Western-blot analysis and the levels were similar to those of rSARS-CoV infected cells (Fig. 8A). In addition, no significant effect of E protein expression on RSV titers was detected. The expression of the stress response genes hsp90 AA1, UBB, hspH1, SERPINH1 and hsp10 E1 was analyzed in the presence or absence of SARS-CoV E protein by qRT-PCR (Fig. 8B). The expression of these stress response genes was significantly induced by RSV infection at almost all times (Fig. 8B). In the presence of E protein, the induction of these stress genes was significantly reduced (Fig. 8B) in a specific manner as no significant differences were observed in the expression of polQ gene, irrespective of the presence or absence of E protein (Fig. 8B). These data indicated that SARS-CoV E protein alone reduced different types of stress, such as cytosolic (genes hsp90 AA1, UBB, hspH1), ER (gene SERPINH1) and mitochondrial stress (gene hsp10 E1), produced by infection with at least two different respiratory viruses (SARS-CoV and RSV).

Coronavirus infection induces ER stress [64] due to the extensive use of intracellular membranes for the generation of replication complexes and for the assembly of virus particles [36], [65]. In addition, viral glycoproteins can induce ER stress during infection as a result of incomplete glycosylation and incorrect folding or accumulation in the ER lumen [66], [67]. Accordingly, we decided to focus our attention on ER stress. To determine whether E protein alone was responsible for the downregulation of the ER stress response, Vero E6 and MA-104 cells were transfected with a plasmid encoding SARS-CoV E protein or with empty plasmid as a control. At 24 hpt cell cultures were treated with thapsigargin and tunicamycin, which induce ER stress by altering intracellular Ca++ levels or by preventing protein glycosylation, respectively [68], for 8 or 20 h, or left untreated. The levels of E protein were monitored by Western-blot analysis and were similar to E protein levels after SARS-CoV infection of Vero E6 (Fig. 9A) or MA-104 cell (data not shown). Total cellular RNAs were collected and the expression of the ER-stress inducible genes GRP78 and GRP94 was evaluated by qRT-PCR. The effect of E protein expression at the times post-induction when upregulation of these genes was highest is shown (Fig. 9B and C). Treatment with thapsigargin and tunicamycin clearly induced the expression of ER stress genes in Vero E6 and MA-104 cells transfected with the empty plasmid (Fig. 9B and C). The expression of GRP78 and GRP94 was significantly reduced in the presence of E protein (Fig. 9B and C). No decrease in the expression of polQ gene was observed in the presence of E gene, suggesting that the reduction in the expression of stress related genes was specific (Fig. 9B and C). These data indicated that E protein alone was sufficient to reduce cellular stress caused by different mechanisms.

Modulation of UPR by SARS-CoV E protein
Cells induce the UPR to reduce the burden imposed by unfolded or misfolded proteins in the ER. To analyze the mechanisms by which the E protein can reduce ER stress, the effect of E protein on the three branches of the UPR (PERK, ATF6, and IRE-1) was analyzed. The PERK pathway involves the phosphorylation and subsequent activation of this kinase. Accordingly, the levels of phosphorylated PERK in Vero E6 cells infected with rSARS-CoV-ΔE or rSARS-CoV were compared at different times pi. As a control, levels of the house-keeping gene GAPDH were measured and used for normalization. Phosphorylated PERK was detectable in rSARS-CoV-ΔE and wt-infected cells at 6 hpi, in contrast to mock-infected cells, in which no phosphorylated PERK was detected. No significant differences in the phosphorylation levels of PERK were detected between cells infected with rSARS-CoV with or without E protein (Fig. S5), suggesting that E protein had no significant influence on the phosphorylation of PERK.
To analyze whether E protein inhibited the ATF6 pathway, the extent of ATF6α processing in cells infected with rSARS-CoV with or without the E gene, or mock-infected cells was measured by Western blot using an ATF6-specific antibody that recognizes the full-length and the cleaved N-terminal domain of the protein. No significant activation of ATF6 was observed in infected cells, compared to mock-infected cells (data not shown), suggesting that SARS-CoV infection did not efficiently activate this pathway.
Activation of IRE-1 mediates cytoplasmic splicing of the mRNA encoding the transcription factor XBP-1, leading to a frame shift and subsequent translation of a functional XBP-1 transcription factor. To evaluate whether SARS-CoV E protein has an impact on the activation of this pathway, Vero E6 cells were infected with rSARS-CoV with or without the E gene and RNA was collected at different times pi. RT-PCR was used to amplify fragments representing both the unspliced (u) and spliced (s) forms of XBP-1 mRNA, differing by 26 nt [69] (Fig. 10). The relative abundance of these XBP-1 mRNAs was independent of PCR efficiency as the corresponding mRNAs were amplified using the same primer pair. A third slowly migrating species (h), corresponding to a heterohybrid formed by the amplified unspliced and spliced forms was also detected (Fig. 10). The activation of IRE-1 was estimated as a ratio between the spliced and unspliced forms of XBP-1. Levels of spliced XBP-1 were higher in rSARS-CoV-ΔE-infected compared to rSARS-CoV infected cells from 15 to 28 hpi (Fig. 10). This result indicated that in the presence of E protein, activation of the XBP-1 pathway was reduced.

Inhibition of apoptotic cell death by SARS-CoV E protein
Persistent or intense ER stress can trigger apoptosis [41]. To analyze whether SARS-CoV E protein modulated apoptosis induced by SARS-CoV infection, the induction of apoptosis was analyzed in cells infected with rSARS-CoV lacking or expressing E gene. Cells infected either with rSARS-CoV or rSARS-CoV-ΔE were simultaneously stained with propidium iodide (PI) and Annexin V, and monitored by flow cytometry. Mock infected cells remained viable (Annexin V−, PI−) throughout the experiment, indicating that the treatment did not induce apoptosis by itself (Fig. 11). rSARS-CoV induced low levels of apoptosis (Annexin V+) from 15 hpi, and a minor cell population in late apoptosis (Annexin V+, PI+) was evident from 24 hpi (Fig. 11). rSARS-CoV-ΔE triggered apoptosis more rapidly and to a greater extent than rSARS-CoV, with a 3 to 4-fold increase in early apoptotic cells at 4 and 15 hpi, and a 4 and 5 - fold increase in late apoptotic cells between 15 and 24 hpi (Fig. 11).

Discussion
We previously showed that rSARS-CoV-ΔE is attenuated in vivo [26], [27]. In this work, to identify possible mechanisms for this attenuation, the effect of E protein on host cell responses during virus infection was analyzed by comparing the transcriptome of rSARS-CoV-ΔE and rSARS-CoV-infected cells. Among the genes differentially expressed, a large number of genes corresponding to cellular stress were upregulated in rSARS-CoV-ΔE compared to wt virus infected cells, clearly indicating that the presence SARS-CoV E protein reduced the stress response during infection. Upregulation of the stress response was also confirmed at the protein level, as the expression of representative stress response proteins, such as hsp60 and hsp90 was also increased. The addition of E protein in trans reversed the increase in stress response gene expression observed in rSARS-CoV-ΔE-infected cells, confirming the specific suppression of the stress response by E protein. Interestingly, levels of E protein were 10-fold lower than those expressed in SARS-CoV-infected cells, but were sufficient to reduce the increase in stress response genes, indicating the robust effect of E protein. In addition, rSARS-CoV-ΔE titers were not significantly increased by providing E protein in trans, probably due to the low levels of E protein expressed in rSARS-CoV-ΔE infected cells, indicating that the presence or absence of E protein, and not the amount of virus, was responsible for the increase in stress response and apoptosis. In addition, stress induced by another virus, RSV, was also downregulated by SARS-CoV E protein. Furthermore, expression of E protein in the absence of virus infection reduced stress induced by tunicamycin or thapsigargin. SARS-CoV E protein also inhibited a subset of the stress response. Specifically, E protein inhibited the activation of the XBP-1-mediated pathway of the UPR, and apoptosis induced by SARS-CoV. We have shown that in MA-104 cells infected with rSARS-CoV-ΔE, two important pro-inflammatory cytokines (CCL2/MCP-1 and CXCL2/macrophage inflammatory protein 2 [MIP-2]) were downregulated, indicating that the E protein reduces virus-induced inflammation.
SARS-CoV is the most pathogenic human coronavirus known [70]. Besides pneumonia, SARS-CoV causes diarrhea [71], lymphopenia [72], haematological disorders [47], pulmonary vasculitis, and thrombosis [73], [74]. In previous reports, we showed that rSARS-CoV-ΔE was attenuated in hamsters and hACE2 transgenic mice [26], [27]. The relevance of virus-host interaction in virus attenuation is high as differences in virulence are frequently due to differences in host responses, rather than to virus growth kinetics [75], [76].
Coronavirus infection induces an ER stress response due to the extensive use of ER membranes for RNA synthesis [35], [36] and virion assembly at the ER-Golgi intermediate compartment [64], [77]. Further, it has been shown that SARS-CoV structural proteins S, 6, and 3a [66], [78], [79], [80], and the accessory protein 8ab [81] induce ER stress responses. Using genomic approaches, the upregulation of stress genes in SARS-CoV-infected Huh-7 [82], Vero [59], and blood mononuclear cells [83], [84] has been reported in cell cultures and also in vivo [75], [85]. We show, for the first time, that SARS-CoV E protein limits the stress response elicited by SARS-CoV infection, which probably represents a selective advantage for the virus. In fact, we have shown that rSARS-CoV-ΔE is cleared faster than rSARS-CoV with E protein [26], [27]. We observed that genes related to hsps were upregulated in rSARS-CoV-ΔE infected compared to wt virus-infected cells. The presence of hsps on the cell surface facilitates the elimination of infected cells by natural killer (NK) and T cell subsets [32]. Hsps facilitate the presentation of antigenic peptides by the major histocompatibility complex I (MHC I), helping clearance of infected cells by CD8+ T cells [86].
SARS-CoV E protein expressed in trans reduced the stress response induced by rSARS-CoV-ΔE, by a heterologous virus such as RSV (without affecting the amount of virus in both cases), and by non-viral agents, such as thapsigargin and tunicamycin. Therefore, E protein limited the ER stress caused by the unbalance of ER Ca++ ion concentrations, and by the inhibition of N-glycosylation leading to the accumulation of misfolded or unfolded proteins. Overall, these results showed that the downregulation of the stress response by SARS-CoV E protein was a general phenomenon.
In order to analyze the specific pathways modulated by SARS-CoV E protein, the three branches of the UPR were analyzed. Only the XBP-1 pathway was significantly activated in cells infected with rSARS-CoV-ΔE compared to infection with the wt virus. Possibly, the partial activation of the UPR was not sufficient to alleviate cellular stress, and cell apoptosis was induced to help virus clearance [31], [41]. The ectopic expression of coronavirus E protein induces apoptosis in the absence of infection [87], [88], whereas in this manuscript we describe that the expression of E protein in the context of SARS-CoV infection, limited the levels of apoptosis in infected cells, which may represent an advantage for virus production and dissemination [89]. This is not surprising, as previous experiments were performed in transfected cells and not in the context of viral infection, and as many other viral proteins such as 3C-like protease, spike, membrane, nucleocapsid, 3a, 3b, and 7a (reviewed by Tan et al. in [45]), and proteins 6, 7b, and 8a [78], [90], [91] also elicit apoptosis. Removal of the E gene from SARS-CoV led to an increase in stress responses and UPR. Nevertheless, the stress and UPR responses were not able to balance the homeostasis of the system and apoptosis was increased as a defense mechanism that may have contributed to the attenuation observed in rSARS-CoV-ΔE-infected hamsters and mice [26], [27]. Overall, these data indicate that the regulatory influence of E protein on signaling pathways leading to apoptosis still needs further clarification. The control of the stress response and apoptosis by a viral protein has also been observed in infections by human cytomegalovirus, in which the UL38 protein suppresses ER stress-induced death, preventing premature cell death and facilitating efficient virus replication [92], [93].
The expression of genes leading to exuberant inflammation has been associated with SARS-CoV-induced pathology [75], [76]. The upregulation of stress genes observed in SARS-CoV-infected cells when the E gene was deleted probably diminished proinflammatory processes, leading to a decrease in pathology [94], [95]. In fact, we have observed that MAPK phosphatases DUSP1 and DUSP10 were upregulated in rSARS-CoV-ΔE-infected cells when compared to wt virus-infected cells. DUSP proteins are critical regulators of innate immune responses [96]. Using DUSP1 and DUSP10 knock out cell cultures and mice, it has been shown that these genes limit the expression of inflammatory genes such as TNF, IL-6, CCL2/MCP-1, CCL3, CCL4 and CXCL2/MIP-2 [60], [97], [98], [99]. Interestingly, we observed a decrease in the expression of CXCL2/MIP-2 and CCL2/MCP-1 in rSARS-CoV-ΔE infected MA-104 cells compared to wt virus-infected cells, probably contributing to the reduction of lung inflammation that we observed in vivo [26], [27]. In human SARS, increases in IL-6, CCL2/MCP-1 and CXCL10/IP-10 expression were detected in the lungs of human patients with fatal SARS [48], [49], [100]. Furthermore, persistent expression of CCL2/MCP-1, CXCL9/MIG and CXCL10/IP-10 was observed in the blood of SARS patients with fatal disease [48], [49], [100], reinforcing the idea that elevated expression of proinflammatory cytokines significantly contributes to the pathogenicity of the virus.
In summary, we found that deletion of the E gene from SARS-CoV increased the expression of host genes involved in stress response and immunoregulation, among others, and decreased those involved in inflammation. Further, SARS-CoV E protein reduced the stress caused by two viruses, SARS-CoV and RSV, and by drugs. E protein may represent a novel strategy used by SARS-CoV to increase its virulence and may also serve as a potential therapeutic target in outbreaks of SARS-CoV or other coronaviruses.
Materials and Methods
Virus
rSARS-CoV and rSARS-CoV-ΔE were rescued from infectious cDNA clones as previously described [26], [101]. rSARS-CoV-ΔE was passaged 16 times in Vero E6 cells and characterized in vitro and in vivo (rSARS-CoV-ΔE-P16) [56]. Remarkably, only a single mutation, at position 23312, which resulted in a serine to phenylalanine mutation in the gene S, was detected in the rSARS-CoV-ΔE passaged 16 times [56]. All work with infectious viruses was performed in biosafety level (BSL) 3 facilities by personnel wearing positive-pressure air purifying respirators (3M HEPA AirMate, St. Paul, MN).
Cells
African Green monkey kidney-derived Vero E6 cells were kindly provided by Eric Snijder (Medical Center, University of Leiden, The Netherlands). African monkey kidney-derived MA-104 cells were kindly provided by J. Buesa (Universidad de Valencia, Valencia, Spain). Human colon carcinoma-derived CaCo-2 cells were obtained from the European Collection of Cell Cultures (EACC 86010202). Human hepatocarcinoma-derived Huh7 cells were provided by R. Bartenschlager (Department for Molecular Biology, University of Heidelberg, Germany). Rhesus monkey kidney-derived FRhK-4 cells were obtained from the American Type Culture Collection (ATCC CRL-1688). Porcine kidney-derived PK15 cells were provided by A. Carrascosa (Centro de Biología Molecular, Madrid, Spain). Human hepatocarcinoma-derived HepG2 cells were provided by M. Esteban (Centro Nacional de Biotecnología, Madrid, Spain). Human kidney-derived 293 cells were obtained from the American Type Culture Collection (ATCC CRL-1573). The 293-derived clone 293T, which expresses the SV40 T antigen, was obtained from the American Type Culture Collection (ATCC CRL-11268). In all cases, cells were grown in Dulbecco's modified Eagle's medium (GIBCO) supplemented with 25 mM HEPES and 10% fetal bovine serum (Biowhittaker). Virus titrations were performed in Vero E6 cells following standard procedures using closed flasks or plates sealed in plastic bags, as previously described [26].
rSARS-CoV growth kinetics
Subconfluent monolayers (90% confluency) of Vero E6 and MA-104 cells were infected at an moi of 2 with rSARS-CoV-ΔE, or rSARS-CoV. Culture supernatants were collected at different hpi and virus titer was determined as previously described [26].
Indirect immunofluorescence assay
Subconfluent Vero E6, MA-104, CaCo-2, Huh7, FRhK-4, PK15, HepG2, 293 and 293T cells grown in 9 cm2 flasks were infected at an moi of 1, 3 or 5. At different times pi, cells were washed in ice-cold phosphate-buffered saline (PBS) and fixed with 4% paraformaldehyde for 30 min at room temperature. The cells were then permeabilized with 0.2% saponin in blocking solution (PBS, pH 7.4, containing 10% FBS) for 1 h at room temperature and incubated with a SARS-CoV N protein-specific monoclonal antibody (SA46-4), kindly provided by Ying Fang (Center for Infectious Disease Research and Vaccinology, Brookings, South Dakota, USA) for 90 min at room temperature. Cells were then washed three times with PBS, incubated with Alexa 488-conjugated mouse antibodies (Molecular Probes) at 1∶500 dilution in blocking solution for 30 min at room temperature and washed five times with PBS. The slides were removed, mounted with glass coverslips and analyzed with a Zeiss Axiophot fluorescence microscope.
Microarray analysis
Vero E6 or MA-104 cells were mock-infected or infected at an moi of 2 with rSARS-CoV or rSARS-CoV-ΔE. Total RNA was extracted using a RNeasy mini kit (Qiagen) according to the manufacturer's instructions and RNA integrity was measured in a bioanalyzer (Agilent Technologies, Inc.). RNAs were biotin-labeled using the One cycle target-labeling kit (Affymetrix, Santa Clara, CA). Briefly, cDNA was synthesized from 5 µg total RNA using an oligo-dT primer with a T7 RNA polymerase promoter site added to the 3′ end. After second-strand synthesis, in vitro transcription was performed using T7 RNA polymerase to produce biotin-labeled cRNA. cRNA preparations (15 µg) were fragmented at 94°C for 35 min into 35–200 bases in length and added to a hybridization solution (100 mM 4-morpholinopropanosulfonate acid, 1 M Na+, 20 mM EDTA and 0,01% Tween-20). The cRNAs (10 µg) were hybridized to Human Genome U133 plus 2.0 Arrays (Affymetrix, Santa Clara, CA) at 45°C for 16 hours. The arrays were stained with streptavidin-phycoerythrin and read at 1.56 µm in a GeneChip Scanner 3000 7G System (Affymetrix, Santa Clara, CA). Three independent microarrays were hybridized for each experiment.
Microarray data analysis
Data analysis was performed with the system affylma GUI R [102]. Robust Multi-array Analysis (RMA) algorithm was used for background correction, normalization and presentation of the expression levels [103]. Next, analysis of differential expression was performed with the Bayes t-statistics using microarray data (limma) linear models, included in the affylmGUI package. P-values were corrected for multiple-testing using the Benjamini-Hochberg's method (False Discovery Rate) [104], [105]. Genes were considered differentially expressed if the FDR were <0.01. In addition, only genes with a signal log ratio of more than one or less than minus one were considered for further analysis.
Gene Set Enrichment Analysis of DNA microarray results
To understand the biological significance underlying the gene expression data, gene set enrichment analysis (GSEA) was used [106]. This method analyzes all of the gene expression data to identify genes coordinately regulated in predefined gene sets. GSEA was applied independently to gene expression results obtained at 15 hpi and to those obtained at 65 hpi. Gene expression results were sorted by their logRatios. Gene Sets based on Gene Ontology keywords as defined in the subset C5 of Molecular Signatures Database (MSigDB v2.5) [106] were used. 1402 Gene Sets containing more than 4 and less than 501 members were considered. 1000 permutations were performed. In each case, the top 20 Gene Sets showing positive correlation with upregulated genes in our data were further analyzed.
RNA analysis by qRT-PCR
Total RNA from Vero E6, or MA-104-infected cells was extracted using the Qiagen RNeasy kit according to the manufacturer's instructions and used to determine N gene subgenomic (sg) mRNA and genomic RNA levels by qRT-PCR. Reactions were performed at 37°C for 2 h with a High Capacity cDNA transcription kit (Applied Biosystems) using 100 ng of total RNA and the antisense primers Q-NsgSARS-RS (5′-TGGGTCCACCAAATGTAATGC-3′), complementary to nt 44 to 64 of N gene; and Q-SARS-2015-RS (5′ - ATGGCGTCGACAAGACGTAAT-3′), complementary to nt 1995 to 2015 of genomic RNA. cDNAs were amplified by PCR using the Power SYBR Green PCR Master Mix (Applied Biosystems) and oligonucleotides Q-NsgSARS-VS (5′-AAGCAACCAACCTCGATCTC-3′), complementary to the virus leader sequence, and Q-SARS-1931-VS (5′-ACCACTCAATTCCTGATTTGCA-3′), complementary to nucleotides 1931 to 1952 of genomic RNA, and the oligonucleotides RS previously described [1]. All the primers were designed using Primer Express software (Applied Biosystems). Data were acquired with an ABI PRISM 7000 sequence detection system (Applied Biosystems) and analyzed with ABI PRISM 7000 SDS version 1.0 software. Levels of viral RNAs are represented in comparison to reference levels from cells infected with rSARS-CoV at 0 hpi.
For qRT-PCR of cellular genes, total RNA from Vero E6, and MA-104-infected cells was extracted as described above. Reactions were performed at 37°C for 2 h using a High Capacity cDNA transcription kit (Applied Biosystems) using 100 ng of total RNA and random hexamer oligonucleotides. Cellular gene expression was analyzed using TaqMan gene expression assays (Applied Biosystems) specific for human or monkey genes (Table 1). Data were acquired with an ABI PRISM 7000 sequence detection system (Applied Biosystems) and analyzed with ABI PRISM 7000 SDS version 1.0 software. Gene expression in rSARS-CoV-ΔE and rSARS-CoV-infected cells were compared. Alternatively, gene expression in rSARS-CoV-ΔE or SARS-CoV-infected cells was compared to mock-infected cells. Quantification was achieved using the 2−ΔΔCt method, which is a convenient way to analyze relative changes in gene expression in qPCR experiments [107]. The data represent the average of three independent experiments.

Transfection of pcDNA3.1-E and infection with rSARS-CoV
Vero E6 cells grown to 90% confluence in M24 wells, were infected at an moi of 0.5 with rSARS-CoV-ΔE-P1 and -P16 and rSARS-CoV. Ninety min after infection, cells were transfected with 1 µg of the plasmid pcDNA3.1-E expressing the SARS-CoV E protein [77], or empty plasmid as control, using 1 µg of Lipofectamine 2000 (Invitrogen) according to manufacturer's instructions. Total RNA from mock - infected or rSARS-CoV-infected cultures was extracted at different times pi as described above and used to quantify the expression of the stress-response genes hspA1A, hsp90AA1, hspH1, SERPINH1 and hspE1 by qRT-PCR as described.
Transfection of pcDNA3.1-E and infection with RSV
Vero E6 cells grown to 90% confluence in M24 multiwell plates were transfected with 1 µg of the plasmid pcDNA3.1-E, or empty plasmid as control, using 1 µg of Lipofectamine 2000 (Invitrogen) according to the manufacturer's instructions. After an incubation period of 5 h at 37°C, the transfection media were replaced and cells were incubated at 37°C for 24 h. Then, the cells were infected at an moi of 2 with RSV, Long strain [108]. RSV was provided by Dr. Blanca Garcia-Barreno (National Institute of Microbiology, Madrid), and titrated on Hep-2 cells as previously described [109]. Total RNA from mock-infected or RSV-infected cultures was extracted at different times pi as described above and used to quantify the expression of the stress-response genes hspAA1, UBB, hspH1, SERPINH1 and hspE1 by qRT-PCR as described.
Transfection of pcDNA3.1-E and treatment with thapsigargin and tunicamycin
Vero E6 and MA-104 cells were transfected with plasmid pcDNA3.1-E or empty plasmid as above. Twenty-four hpt, cells were cultured in media containing 1000 nM thapsigargin, or 2 µg/ml of tunicamycin and incubated for another 8 or 20 hours, before analysis of expression of the UPR-induced genes, GRP78 and GRP94.
Western blotting
Cell lysates were analyzed by sodium dodecyl sulfate-polyacrylamide gel electrophoresis (SDS-PAGE). Proteins were transferred to a nitrocellulose membrane with a Bio-Rad mini protean II electroblotting apparatus at 150 mA for 2 h in 25 mM Tris-192 mM glycine buffer, pH 8.3, containing 20% methanol. Membranes were blocked for 1 h with 5% dried skim milk in TBS (20 mM Tris-HCl, pH 7.5, 150 mM NaCl) and incubated with antibodies specific for hsp60 (Cell Signaling, Ref. 4870), hsp90 (Cell Signaling, Ref. 4877), SARS-CoV E protein (kindly provided by Shen Shuo, Institute of Molecular and Cellular Biology, Singapore), phospho-PERK (Santa Cruz Biotechnology, Ref. sc-32577), GAPDH (Abcam, Ref. ab9485), and ATF-6 (Abcam, Refs. ab11909 and ab37149). Bound antibodies were detected with horseradish peroxidase-conjugated goat anti-rabbit or anti-mouse antibodies (Cappel) and the ECL detection system (Amersham Pharmacia Biotech).
RT-PCR analysis of XBP-1 mRNA
Total RNA from mock-infected or rSARS-CoV or rSARS-CoV-ΔE-infected cells was used for RT-PCR analysis of XBP-1 mRNA. cDNA was prepared using the specific oligonucleotide XBP1-RS (5′-CTGGGTCCTTCTGGGTAGAC-3′). cDNAs were amplified by PCR using the sense primer XBP1-VS (5′-CTGGAACAGCAAGTGGTAGA-3′), and XBP1-RS, flanking the splicing region of XBP-1 mRNA [69]. The RT-PCR products were resolved by electrophoresis in 2% agarose gels.
Analysis of apoptosis in rSARS-CoV-infected cells
Vero E6 cells were grown to confluence in 12.5 cm2 flasks and infected at an moi of 4 with rSARS-CoV or rSARS-CoV-ΔE. At 4, 15 and 24 hpi, cells were treated with fluorescein isothiocyanate (FITC)-conjugated annexin V (Southern Biotech) to identify apoptotic cells measured by flow cytometry, as previously described [110]. Cells were then treated with 1 volume of 4% paraformaldehyde in PBS to inactivate virus. At the end of the process, propidium iodide (PI) staining was performed to differentiate cells in early apoptosis (Annexin V+, PI−) from those in late apoptosis (Annexin V+, PI+) stage.
Supporting Information
Zdroje
1. DrostenCGuntherSPreiserWvan der WerfSBrodtHR 2003 Identification of a novel coronavirus in patients with severe acute respiratory syndrome. N Engl J Med 348 1967 1976
2. FouchierRAKuikenTSchuttenMvan AmerongenGvan DoornumGJ 2003 Aetiology: Koch's postulates fulfilled for SARS virus. Nature 423 240
3. KsiazekTGErdmanDGoldsmithCZakiSPeretT 2003 A novel coronavirus associated with severe acute respiratory syndrome. N Engl J Med 348 1953 1966
4. KuikenTFouchierRAMSchuttenMRimmelzwaanGFvan AmerongenG 2003 Newly discovered coronavirus as the primary cause of severe acute respiratory syndrome. Lancet 362 263 270
5. MarraMAJonesSJMAstellCRHoltRABrooks-WilsonA 2003 The genome sequence of the SARS-associated coronavirus. Science 300 1399 1404
6. PeirisJSMLaiSTPoonLLMGuanYYamLYC 2003 Coronavirus as a possible cause of severe acute respiratory syndrome. Lancet 361 1319 1325
7. RotaPAObersteMSMonroeSSNixWACampganoliR 2003 Characterization of a novel coronavirus associated with severe acute respiratory syndrome. Science 300 1394 1399
8. LauSKWooPCLiKSHuangYTsoiHW 2005 Severe acute respiratory syndrome coronavirus-like virus in Chinese horseshoe bats. Proc Natl Acad Sci U S A 102 14040 14045
9. LiWShiZYuMRenWSmithC 2005 Bats are natural reservoirs of SARS-like coronaviruses. Science 310 676 679
10. WooPCLauSKLiKSPoonRWWongBH 2006 Molecular diversity of coronaviruses in bats. Virology 351 180 187
11. ZiebuhrJ 2005 The coronavirus replicase. EnjuanesL Coronavirus replication and reverse genetics Berlin Heidelberg, Germany Springer-Verlag 57 94
12. ZiebuhrJSnijderEJGorbalenyaAE 2000 Virus-encoded proteinases and proteolytic processing in the Nidovirales. J Gen Virol 81 853 879
13. EnjuanesLGorbalenyaAEde GrootRJCowleyJAZiebuhrJ 2008 The Nidovirales. MahyBWJVan RegenmortelMWalkerPMajumder-RussellD Encyclopedia of Virology, Third Edition Oxford Elsevier Ltd 419 430
14. HuangCItoNTsengCTMakinoS 2006 Severe acute respiratory syndrome coronavirus 7a accessory protein is a viral structural protein. J Virol 80 7287 7294
15. HuangCPetersCJMakinoS 2007 Severe acute respiratory syndrome coronavirus accessory protein 6 is a virion-associated protein and is released from 6 protein-expressing cells. J Virol 81 5423 5426
16. ItoNMosselECNarayananKPopovVLHuangC 2005 Severe acute respiratory syndrome coronavirus 3a protein is a viral structural protein. J Virol 79 3182 3186
17. SchaecherSRMackenzieJMPekoszA 2007 The ORF7b protein of SARS-CoV is expressed in virus-infected cells and incorporated into SARS-CoV particles. J Virol 81 718 731
18. ShenSLinPSChaoYCZhangAYangX 2005 The severe acute respiratory syndrome coronavirus 3a is a novel structural protein. Biochem Biophys Res Commun 330 286 292
19. TorresJParthasarathyKLinXSaravananRLiuDX 2006 Model of a putative pore: the pentameric alpha-helical bundle of SARS coronavirus E protein in lipid bilayers. Biophys J 91 938 947
20. TorresJMaheswariUParthasarathyKNgLLiuDX 2007 Conductance and amantadine binding of a pore formed by a lysine-flanked transmembrane domain of SARS coronavirus envelope protein. Protein Sci 16 2065 2071
21. WilsonLGagePEwartG 2006 Hexamethylene amiloride blocks E protein ion channels and inhibits coronavirus replication. Virology 353 294 306
22. WilsonLMcKinlayCGageP 2004 SARS coronavirus E protein forms cation-selective ion channels. Virology 330 322 331
23. CurtisKMYountBBaricRS 2002 Heterologous gene expression from transmissible gastroenteritis virus replicon particles. J Virol 76 1422 1434
24. OrtegoJCerianiJEPatinoCPlanaJEnjuanesL 2007 Absence of E protein arrests transmissible gastroenteritis coronavirus maturation in the secretory pathway. Virology 368 296 308
25. OrtegoJEscorsDLaudeHEnjuanesL 2002 Generation of a replication-competent, propagation-deficient virus vector based on the transmissible gastroenteritis coronavirus genome. J Virol 76 11518 11529
26. DeDiegoMLAlvarezEAlmazanFRejasMTLamirandeE 2007 A severe acute respiratory syndrome coronavirus that lacks the E gene is attenuated in vitro and in vivo. J Virol 81 1701 1713
27. DeDiegoMLPeweLAlvarezERejasMTPerlmanS 2008 Pathogenicity of severe acute respiratory coronavirus deletion mutants in hACE-2 transgenic mice. Virology 376 379 389
28. KuoLMastersPS 2003 The small envelope protein E is not essential for murine coronavirus replication. J Virol 77 4597 4608
29. SullivanCSPipasJM 2001 The virus-chaperone connection. Virology 287 1 8
30. SantoroMG 2000 Heat shock factors and the control of the stress response. Biochem Pharmacol 59 55 63
31. NollenEAMorimotoRI 2002 Chaperoning signaling pathways: molecular chaperones as stress-sensing ‘heat shock’ proteins. J Cell Sci 115 2809 2816
32. MoseleyP 2000 Stress proteins and the immune response. Immunopharmacology 48 299 302
33. RobertJ 2003 Evolution of heat shock protein and immunity. Dev Comp Immunol 27 449 464
34. GosertRKanjanahaluethaiAEggerDBienzKBakerSC 2002 RNA replication of mouse hepatitis virus takes place at double-membrane vesicles. J Virol 76 3697 3708
35. SnijderEJvan der MeerYZevenhoven-DobbeJOnderwaterJJvan der MeulenJ 2006 Ultrastructure and origin of membrane vesicles associated with the severe acute respiratory syndrome coronavirus replication complex. J Virol 80 5927 5940
36. KnoopsKKikkertMWormSHZevenhoven-DobbeJCvan der MeerY 2008 SARS-coronavirus replication is supported by a reticulovesicular network of modified endoplasmic reticulum. PLoS Biol 6 e226
37. RonDWalterP 2007 Signal integration in the endoplasmic reticulum unfolded protein response. Nat Rev Mol Cell Biol 8 519 529
38. WangXZHardingHPZhangYJolicoeurEMKurodaM 1998 Cloning of mammalian Ire1 reveals diversity in the ER stress responses. EMBO J 17 5708 5717
39. HardingHPZhangYRonD 1999 Protein translation and folding are coupled by an endoplasmic-reticulum-resident kinase. Nature 397 271 274
40. ChenXShenJPrywesR 2002 The luminal domain of ATF6 senses endoplasmic reticulum (ER) stress and causes translocation of ATF6 from the ER to the Golgi. J Biol Chem 277 13045 13052
41. BoyceMYuanJ 2006 Cellular response to endoplasmic reticulum stress: a matter of life or death. Cell Death Differ 13 363 373
42. WeiLSunSXuCHZhangJXuY 2007 Pathology of the thyroid in severe acute respiratory syndrome. Hum Pathol 38 95 102
43. ZhangQLDingYQHeLWangWZhangJH 2003 Detection of cell apoptosis in the pathological tissues of patients with SARS and its significance. Di Yi Jun Yi Da Xue Xue Bao 23 770 773
44. KrahlingVSteinDASpiegelMWeberFMuhlbergerE 2009 Severe acute respiratory syndrome coronavirus triggers apoptosis via protein kinase R but is resistant to its antiviral activity. J Virol 83 2298 2309
45. TanYJLimSGHongW 2007 Regulation of cell death during infection by the severe acute respiratory syndrome coronavirus and other coronaviruses. Cell Microbiol 9 2552 2561
46. HuangKJSuIJTheronMWuYCLaiSK 2005 An interferon-gamma-related cytokine storm in SARS patients. J Med Virol 75 185 194
47. WongRSWuAToKFLeeNLamCW 2003 Haematological manifestations in patients with severe acute respiratory syndrome: retrospective analysis. BMJ 326 1358 1362
48. TangNLChanPKWongCKToKFWuAK 2005 Early enhanced expression of interferon-inducible protein-10 (CXCL-10) and other chemokines predicts adverse outcome in severe acute respiratory syndrome. Clin Chem 51 2333 2340
49. JiangYXuJZhouCWuZZhongS 2005 Characterization of cytokine/chemokine profiles of severe acute respiratory syndrome. Am J Respir Crit Care Med 171 850 857
50. ZhangYLiJZhanYWuLYuX 2004 Analysis of serum cytokines in patients with severe acute respiratory syndrome. Infect Immun 72 4410 4415
51. ReghunathanRJayapalMHsuLYChngHHTaiD 2005 Expression profile of immune response genes in patients with Severe Acute Respiratory Syndrome. BMC Immunol 6 2
52. Gillim-RossLTaylorJSchollDRRidenourJMastersPS 2004 Discovery of novel human and animal cells infected by the severe acute respiratory syndrome coronavirus by replication-specific multiplex reverse transcription-PCR. J Clin Microbiol 42 3196 3206
53. HattermannKMullerMANitscheAWendtSDonoso MantkeO 2005 Susceptibility of different eukaryotic cell lines to SARS-coronavirus. Arch Virol 150 1023 1031
54. LuWZhengBJXuKSchwarzWDuL 2006 Severe acute respiratory syndrome-associated coronavirus 3a protein forms an ion channel and modulates virus release. Proc Natl Acad Sci U S A 103 12540 12545
55. MosselECHuangCNarayananKMakinoSTeshRB 2005 Exogenous ACE2 expression allows refractory cell lines to support severe acute respiratory syndrome coronavirus replication. J Virol 79 3846 3850
56. NetlandJDeDiegoMLZhaoJFettCAlvarezE 2010 Immunization with an attenuated severe acute respiratory syndrome coronavirus deleted in E protein protects against lethal respiratory disease. Virology 399 120 128
57. EmenyJMMorganMJ 1979 Regulation of the interferon system: evidence that Vero cells have a genetic defect in interferon production. J Gen Virol 43 247 252
58. McKimm-BreschkinJLHolmesIH 1982 Conditions required for induction of interferon by rotaviruses and for their sensitivity to its action. Infect Immun 36 857 863
59. LeongWFTanHCOoiEEKohDRChowVT 2005 Microarray and real-time RT-PCR analyses of differential human gene expression patterns induced by severe acute respiratory syndrome (SARS) coronavirus infection of Vero cells. Microbes Infect 7 248 259
60. ZhangYBlattmanJNKennedyNJDuongJNguyenT 2004 Regulation of innate and adaptive immune responses by MAP kinase phosphatase 5. Nature 430 793 797
61. NarayananKHuangCLokugamageKKamitaniWIkegamiT 2008 Severe acute respiratory syndrome coronavirus nsp1 suppresses host gene expression, including that of type I interferon, in infected cells. J Virol 82 4471 4479
62. FriemanMBChenJMorrisonTEWhitmoreAFunkhouserW 2010 SARS-CoV pathogenesis is regulated by a STAT1 dependent but a type I, II and III interferon receptor independent mechanism. PLoS Pathog 6 e1000849
63. SheahanTMorrisonTEFunkhouserWUematsuSAkiraS 2008 MyD88 is required for protection from lethal infection with a mouse-adapted SARS-CoV. PLoS Pathog 4 e1000240
64. BechillJChenZBrewerJWBakerSC 2008 Coronavirus infection modulates the unfolded protein response and mediates sustained translational repression. J Virol 82 4492 4501
65. SalanuevaIJCarrascosaJLRiscoC 1999 Structural maturation of the transmissible gastroenteritis coronavirus. J Virol 73 7952 7964
66. ChanCPSiuKLChinKTYuenKYZhengB 2006 Modulation of the unfolded protein response by the severe acute respiratory syndrome coronavirus spike protein. J Virol 80 9279 9287
67. HeB 2006 Viruses, endoplasmic reticulum stress, and interferon responses. Cell Death Differ 13 393 403
68. WangYShenJArenzanaNTirasophonWKaufmanRJ 2000 Activation of ATF6 and an ATF6 DNA binding site by the endoplasmic reticulum stress response. J Biol Chem 275 27013 27020
69. ShangJLehrmanMA 2004 Discordance of UPR signaling by ATF6 and Ire1p-XBP1 with levels of target transcripts. Biochem Biophys Res Commun 317 390 396
70. WeissSRNavas-MartinS 2005 Coronavirus pathogenesis and the emerging pathogen severe acute respiratory syndrome coronavirus. Microbiol Mol Biol Rev 69 635 664
71. ChengVCHungIFTangBSChuCMWongMM 2004 Viral replication in the nasopharynx is associated with diarrhea in patients with severe acute respiratory syndrome. Clin Infect Dis 38 467 475
72. PeirisJSYuenKYOsterhausADStohrK 2003 The severe acute respiratory syndrome. N Engl J Med 349 2431 2441
73. DingYWangHShenHLiZGengJ 2003 The clinical pathology of severe acute respiratory syndrome (SARS): a report from China. J Pathol 200 282 289
74. NichollsJMPoonLLLeeKCNgWFLaiST 2003 Lung pathology of fatal severe acute respiratory syndrome. Lancet 361 1773 1778
75. RockxBBaasTZornetzerGAHaagmansBSheahanT 2009 Early upregulation of acute respiratory distress syndrome-associated cytokines promotes lethal disease in an aged-mouse model of severe acute respiratory syndrome coronavirus infection. J Virol 83 7062 7074
76. SmitsSLde LangAvan den BrandJMLeijtenLMvanIWF 2010 Exacerbated innate host response to SARS-CoV in aged non-human primates. PLoS Pathog 6 e1000756
77. Nieto-TorresJLDeDiegoMLAlvarezEEnjuanesL 2010 Cellular localization and topology of severe acute respiratory syndome coronavirus (SARS-CoV) envelope protein. Virology 415 69 82
78. YeZWongCKLiPXieY 2008 A SARS-CoV protein, ORF-6, induces caspase-3 mediated, ER stress and JNK-dependent apoptosis. Biochim Biophys Acta 1780 1383 1387
79. MinakshiRPadhanKRaniMKhanNAhmadF 2009 The SARS Coronavirus 3a protein causes endoplasmic reticulum stress and induces ligand-independent downregulation of the type 1 interferon receptor. PLoS One 4 e8342
80. VersteegGAvan de NesPSBredenbeekPJSpaanWJ 2007 The coronavirus spike protein induces endoplasmic reticulum stress and upregulation of intracellular chemokine mRNA concentrations. J Virol 81 10981 10990
81. SungSCChaoCYJengKSYangJYLaiMM 2009 The 8ab protein of SARS-CoV is a luminal ER membrane-associated protein and induces the activation of ATF6. Virology 387 402 413
82. TangBSChanKHChengVCWooPCLauSK 2005 Comparative host gene transcription by microarray analysis early after infection of the Huh7 cell line by severe acute respiratory syndrome coronavirus and human coronavirus 229E. J Virol 79 6180 6193
83. YuSYHuYWLiuXYXiongWZhouZT 2005 Gene expression profiles in peripheral blood mononuclear cells of SARS patients. World J Gastroenterol 11 5037 5043
84. ShaoHLanDDuanZLiuZMinJ 2006 Upregulation of mitochondrial gene expression in PBMC from convalescent SARS patients. J Clin Immunol 26 546 554
85. ZhangLZhangZPZhangXELinFSGeF 2010 Quantitative proteomics analysis reveals BAG3 as a potential target to suppress severe acute respiratory syndrome coronavirus replication. J Virol 84 6050 6059
86. CallahanMKGargMSrivastavaPK 2008 Heat-shock protein 90 associates with N-terminal extended peptides and is required for direct and indirect antigen presentation. Proc Natl Acad Sci U S A 105 1662 1667
87. YangYXiongZZhangSYanYNguyenJ 2005 Bcl-xL inhibits T-cell apoptosis induced by expression of SARS coronavirus E protein in the absence of growth factors. Biochem J 392 135 143
88. AnSChenCJYuXLeibowitzJLMakinoS 1999 Induction of apoptosis in murine coronavirus-infected cultured cells and demonstration of E protein as an apoptosis inducer. J Virol 73 7853 7859
89. BruneW 2010 Inhibition of programmed cell death by cytomegaloviruses. Virus Res 157 144 150
90. ChenCYPingYHLeeHCChenKHLeeYM 2007 Open reading frame 8a of the human severe acute respiratory syndrome coronavirus not only promotes viral replication but also induces apoptosis. J Infect Dis 196 405 415
91. SchaecherSRTouchetteESchriewerJBullerRMPekoszA 2007 Severe acute respiratory syndrome coronavirus gene 7 products contribute to virus-induced apoptosis. J Virol 81 11054 11068
92. TerhuneSTorigoiEMoormanNSilvaMQianZ 2007 Human cytomegalovirus UL38 protein blocks apoptosis. J Virol 81 3109 3123
93. XuanBQianZTorigoiEYuD 2009 Human cytomegalovirus protein pUL38 induces ATF4 expression, inhibits persistent JNK phosphorylation, and suppresses endoplasmic reticulum stress-induced cell death. J Virol 83 3463 3474
94. ChenYVoegeliTSLiuPPNobleEGCurrieRW 2007 Heat shock paradox and a new role of heat shock proteins and their receptors as anti-inflammation targets. Inflamm Allergy Drug Targets 6 91 100
95. JohnsonBJLeTTDobbinCABanovicTHowardCB 2005 Heat shock protein 10 inhibits lipopolysaccharide-induced inflammatory mediator production. J Biol Chem 280 4037 4047
96. WangXLiuY 2007 Regulation of innate immune response by MAP kinase phosphatase-1. Cell Signal 19 1372 1382
97. HammerMMagesJDietrichHServatiusAHowellsN 2006 Dual specificity phosphatase 1 (DUSP1) regulates a subset of LPS-induced genes and protects mice from lethal endotoxin shock. J Exp Med 203 15 20
98. ZhaoQShepherdEGMansonMENelinLDSorokinA 2005 The role of mitogen-activated protein kinase phosphatase-1 in the response of alveolar macrophages to lipopolysaccharide: attenuation of proinflammatory cytokine biosynthesis via feedback control of p38. J Biol Chem 280 8101 8108
99. SalojinKVOwusuIBMillerchipKAPotterMPlattKA 2006 Essential role of MAPK phosphatase-1 in the negative control of innate immune responses. J Immunol 176 1899 1907
100. CameronMJRanLXuLDaneshABermejo-MartinJF 2007 Interferon-mediated immunopathological events are associated with atypical innate and adaptive immune responses in patients with severe acute respiratory syndrome. J Virol 81 8692 8706
101. AlmazanFDeDiegoMLGalanCEscorsDAlvarezE 2006 Construction of a SARS-CoV infectious cDNA clone and a replicon to study coronavirus RNA synthesis. J Virol 80 10900 10906
102. WettenhallJMSimpsonKMSatterleyKSmythGK 2006 affylmGUI: a graphical user interface for linear modeling of single channel microarray data. Bioinformatics 22 897 899
103. IrizarryRABolstadBMCollinFCopeLMHobbsB 2003 Summaries of Affymetrix GeneChip probe level data. Nucleic Acids Res 31 e15
104. BenjaminiYHochbergY 1995 Controlling the false discovery rate: a practical and powerful approach to multiple testing. J Roy Stat Soc B 57 289 300
105. ReinerAYekutieliDBenjaminiY 2003 Identifying differentially expressed genes using false discovery rate controlling procedures. Bioinformatics 19 368 375
106. SubramanianATamayoPMoothaVKMukherjeeSEbertBL 2005 Gene set enrichment analysis: a knowledge-based approach for interpreting genome-wide expression profiles. Proc Natl Acad Sci U S A 102 15545 15550
107. LivakKJSchmittgenTD 2001 Analysis of relative gene expression data using real-time quantitative PCR and the 2(−Delta Delta C(T)) Method. Methods 25 402 408
108. MartinezILombardiaLHerranzCGarcia-BarrenoBDominguezO 2009 Cultures of HEp-2 cells persistently infected by human respiratory syncytial virus differ in chemokine expression and resistance to apoptosis as compared to lytic infections of the same cell type. Virology 388 31 41
109. MartinezILombardiaLGarcia-BarrenoBDominguezOMeleroJA 2007 Distinct gene subsets are induced at different time points after human respiratory syncytial virus infection of A549 cells. J Gen Virol 88 570 581
110. van EngelandMRamaekersFCSchutteBReutelingspergerCP 1996 A novel assay to measure loss of plasma membrane asymmetry during apoptosis of adherent cells in culture. Cytometry 24 131 139
Štítky
Hygiena a epidemiologie Infekční lékařství LaboratořČlánek vyšel v časopise
PLOS Pathogens
2011 Číslo 10
- Parazitičtí červi v terapii Crohnovy choroby a dalších zánětlivých autoimunitních onemocnění
- Vakcíny proti klíšťové encefalitidě
- Kdy je nejlepší očkovat
- Možné vedlejší účinky očkování
- Imunogenita vakcín
Nejčtenější v tomto čísle
- Severe Acute Respiratory Syndrome Coronavirus Envelope Protein Regulates Cell Stress Response and Apoptosis
- The SARS-Coronavirus-Host Interactome: Identification of Cyclophilins as Target for Pan-Coronavirus Inhibitors
- Biochemical and Structural Insights into the Mechanisms of SARS Coronavirus RNA Ribose 2′-O-Methylation by nsp16/nsp10 Protein Complex
- Evolutionarily Divergent, Unstable Filamentous Actin Is Essential for Gliding Motility in Apicomplexan Parasites
Zvyšte si kvalifikaci online z pohodlí domova
Mazová zátka a její řešení
nový kurzVšechny kurzy