
Immune Evasion by : Differential Targeting of Dendritic Cell Subpopulations
CD4+ T cells are essential for the control of Yersinia enterocolitica (Ye) infection in mice. Ye can inhibit dendritic cell (DC) antigen uptake and degradation, maturation and subsequently T-cell activation in vitro. Here we investigated the effects of Ye infection on splenic DCs and T-cell proliferation in an experimental mouse infection model. We found that OVA-specific CD4+ T cells had a reduced potential to proliferate when stimulated with OVA after infection with Ye compared to control mice. Additionally, proliferation of OVA-specific CD4+ T cells was markedly reduced when cultured with splenic CD8α+ DCs from Ye infected mice in the presence of OVA. In contrast, T-cell proliferation was not impaired in cultures with CD4+ or CD4−CD8α− DCs isolated from Ye infected mice. However, OVA uptake and degradation as well as cytokine production were impaired in CD8α+ DCs, but not in CD4+ and CD4−CD8α− DCs after Ye infection. Pathogenicity factors (Yops) from Ye were most frequently injected into CD8α+ DCs, resulting in less MHC class II and CD86 expression than on non-injected CD8α+ DCs. Three days post infection with Ye the number of splenic CD8α+ and CD4+ DCs was reduced by 50% and 90%, respectively. The decreased number of DC subsets, which was dependent on TLR4 and TRIF signaling, was the result of a faster proliferation and suppressed de novo DC generation. Together, we show that Ye infection negatively regulates the stimulatory capacity of some but not all splenic DC subpopulations in vivo. This leads to differential antigen uptake and degradation, cytokine production, cell loss, and cell death rates in various DC subpopulations. The data suggest that these effects might be caused directly by injection of Yops into DCs and indirectly by affecting the homeostasis of CD4+ and CD8α+ DCs. These events may contribute to reduced T-cell proliferation and immune evasion of Ye.
Published in the journal:
. PLoS Pathog 6(11): e32767. doi:10.1371/journal.ppat.1001212
Category:
Research Article
doi:
https://doi.org/10.1371/journal.ppat.1001212
Summary
CD4+ T cells are essential for the control of Yersinia enterocolitica (Ye) infection in mice. Ye can inhibit dendritic cell (DC) antigen uptake and degradation, maturation and subsequently T-cell activation in vitro. Here we investigated the effects of Ye infection on splenic DCs and T-cell proliferation in an experimental mouse infection model. We found that OVA-specific CD4+ T cells had a reduced potential to proliferate when stimulated with OVA after infection with Ye compared to control mice. Additionally, proliferation of OVA-specific CD4+ T cells was markedly reduced when cultured with splenic CD8α+ DCs from Ye infected mice in the presence of OVA. In contrast, T-cell proliferation was not impaired in cultures with CD4+ or CD4−CD8α− DCs isolated from Ye infected mice. However, OVA uptake and degradation as well as cytokine production were impaired in CD8α+ DCs, but not in CD4+ and CD4−CD8α− DCs after Ye infection. Pathogenicity factors (Yops) from Ye were most frequently injected into CD8α+ DCs, resulting in less MHC class II and CD86 expression than on non-injected CD8α+ DCs. Three days post infection with Ye the number of splenic CD8α+ and CD4+ DCs was reduced by 50% and 90%, respectively. The decreased number of DC subsets, which was dependent on TLR4 and TRIF signaling, was the result of a faster proliferation and suppressed de novo DC generation. Together, we show that Ye infection negatively regulates the stimulatory capacity of some but not all splenic DC subpopulations in vivo. This leads to differential antigen uptake and degradation, cytokine production, cell loss, and cell death rates in various DC subpopulations. The data suggest that these effects might be caused directly by injection of Yops into DCs and indirectly by affecting the homeostasis of CD4+ and CD8α+ DCs. These events may contribute to reduced T-cell proliferation and immune evasion of Ye.
Introduction
Host defense against microbial pathogens relies on the concerted action of both antigen-independent innate immunity and antigen-specific adaptive immunity [1]–[3]. Key features of the innate immune system include the ability to rapidly recognize pathogens and/or tissue injury and to signal the presence of danger to cells of the adaptive immune system [4]. Innate immune cells use a variety of receptors to recognize patterns shared between pathogens, e.g. bacterial LPS [5]–[7].
Dendritic cells (DCs) are unique antigen presenting cells that are able to induce primary immune responses, thus permitting the establishment of immunological memory [8]–[11]. Immature DCs are specialized to endocytose antigens [11]. Engagement of toll-like receptors (TLRs) expressed by DCs induces maturation and migration of DCs to secondary lymphoid organs where the antigens are presented to T cells in order to initiate adaptive immune responses. DC maturation is associated with reduced antigen uptake, up-regulation of MHC class II and costimulatory molecules and increased ability to prime T cells [12], [13]. Mouse splenic conventional CD11chi DCs can be subdivided according to surface marker expression into CD4+, CD8α+, and CD4−CD8α− DCs [14]. The administration of LPS in mice causes migration of CD4+, CD8α+, and CD4−CD8α−DCs from the marginal zone into the T-cell zones of the spleen and is associated with apoptosis of DCs [15]–[17]. All splenic DC subpopulations can prime naïve T cells. CD8α+ DCs induce predominantly Th1 responses, while CD8α− DCs promote Th2 responses [18]. CD8α+ DCs seem to be specialized for priming cytotoxic CD8+ T cells [19], [20].
Yersinia enterocolitica (Ye) is a Gram-negative predominantly extracellularly located bacterium that causes food borne acute or chronic gastrointestinal and systemic diseases [21]. Ye invades through M cells of the Peyer's Patches and may eventually disseminate to the lymph nodes, spleen, lung, and liver. The pathogenicity of Ye depends on the type three secretion system (TTSS) by which virulence factors, the so-called Yersinia outer proteins (Yops) are injected into the cytosol of host cells [22]. YopE, YopT and YopO modulate the cytoskeleton of the host cells, and YopH dephosphorylates focal adhesion molecules thereby inhibiting phagocytosis [23]–[26]. YopP inhibits NF-κB and MAP kinase signaling pathways and induces apoptosis in macrophages and bone marrow-derived DCs (BM-DCs) in vitro [27]–[33].
Based on an experimental Ye mouse infection model it was demonstrated that CD4+ and CD8+ T cells are required for control of Ye infection. Accordingly, T-cell deficient mice do not control Ye and die from a fulminant infection. Moreover, the adoptive transfer of Ye-specific CD4+ or CD8+ T cells into T-cell deficient mice confers protection against Ye infection [34], [35]. IFN-γ, TNF, IL-12 and IL-18 are essential for the control of Ye infection [36]–[39], suggesting a critical role of Th1 responses that may activate macrophages via IFN-γ production.
In previous in vitro studies we could show that Ye modulates specific immune functions of BM-DCs including their maturation [27], antigen uptake [40], processing [41] and subsequently CD4+ T-cell activation [27] by Yop injection. YopP induces apoptosis via the activation of caspases, and triggers caspase-independent necrosis in BM-DCs [27], [33]. Moreover, Ye YopP inhibits the up-regulation of costimulatory molecules and the production of proinflammatory cytokines [27]. It was also shown that YopP impairs clathrin-mediated endocytosis by BM-DCs and antigen degradation [40], [41]. Thus, Ye, particularly YopP, inhibits many functions of BM-DCs in vitro. However, Ye infection is usually a self-limiting disease and the question arises whether such profound inhibition of DC functions also occurs upon Ye infection in vivo. Furthermore, disruption of YopP in Ye does not significantly affect virulence of Ye in vivo thereby challenging the physiological relevance of the observations obtained by BM-DCs based in vitro studies [42]. In this study we analyzed the effect of Ye infection on splenic DC subpopulations. Our data show a functionally impaired CD8α+ DC subset regarding antigen uptake and processing associated with a reduced ability to activate CD4+ T cells. Moreover, Ye infection directly affected a major fraction of splenic DCs by injection of Yops leading to reduced expression of MHC class II and CD86 on CD8α+ DCs. Finally Ye infection caused a TLR4-TRIF-dependent indirect loss of CD4+ and CD8α+ DCs, which resulted from faster proliferation and inhibited de novo generation of these DC subpopulations.
Results
Ye reduces CD4+ T cell proliferation in vivo
T-cell responses are essential for the elimination of Ye [34], [35]. Accordingly, an increasing body of evidence derived from in vitro studies indicates that Yersinia may evade immune response by targeting DCs which are essential for triggering T-cell responses. To address whether Ye infection alters the capacity of DCs to induce T-cell proliferation in vivo, mice were infected with Ye wild type strain pYV+ followed by adoptive transfer of CFSE-labeled CD4+ T cells from anti-ovalbumin (OVA) T-cell receptor transgenic mice [43]. 24 h post infection (p.i.) OVA protein was injected intravenously (i.v.) into the mice. CFSE-dilution of proliferating CD4+ T cells was analyzed by flow cytometry three days later. OVA-specific CFSE-labeled CD4+ T cells showed no signs of proliferation in the absence of OVA after in vivo transfer. Infection of mice with Ye significantly reduced the number of proliferating antigen-specific T cells in vivo compared to that of PBS-injected control mice (Fig. 1A). Quantitative analysis of CFSE-dilution revealed a significant reduction of the division of OVA-specific CFSE-labeled CD4+ T cells from Ye-infected mice compared to PBS-treated mice (Fig. 1A). These data suggested that Ye affects the ability of DCs to activate CD4+ T cells in vivo.

To test whether a deficient DC maturation is responsible for the impaired T-cell proliferation, splenic CD4+, CD8α+, and CD4−CD8α− DC subpopulations were sorted 24 h p.i. with Ye and co-cultured with OVA-specific CFSE-labeled CD4+ T cells in the presence of OVA protein (Fig. 1B) or OVA peptide (Fig. 1C). CD8α+ DCs from PBS-treated mice showed more pronounced CD4+ T-cell proliferation than CD4+ and CD4−CD8α− DCs when co-cultured with OVA protein. Interestingly, the Yersinia infection significantly reduced the proliferation of the OVA-specific CD4+ T cells co-cultured with OVA protein (p = 0.0047) or peptide-pulsed (p = 0.037) CD8α+ DCs. In contrast, the T-cell proliferation capacity of CD4+ and CD4−CD8α− DCs from Ye infected mice was unaffected when compared to controls (Fig. 1B & C). These data suggest that Ye affects antigen uptake and/or processing by and maturation of CD8α+ but not CD4+ and CD4−CD8α− DCs.
Ye modulates antigen uptake and degradation by DC subpopulations
To further elucidate whether antigen uptake and/or degradation by DC subpopulations is modulated by Ye in vivo, mice were co-injected i.v. 24 h or three days p.i. with AlexaFluor647-labeled OVA protein to analyze OVA uptake, and DQ-OVA, a self-quenched fluorescently-labeled OVA protein, which emits fluorescence upon proteolytic degradation in endosomes and lysosomes [41]. OVA uptake and degradation was analyzed 1 h post OVA administration by flow cytometry. In line with previous data [20], CD8α+ DCs displayed a higher uptake of OVA-Alexa647 (Fig. 2A) than CD4+ or CD4−CD8α− DCs (Fig. 2A and B). 24 h and three days p.i. with Ye, we observed 20% or 80% less OVA-Alexa647+CD8α+ DCs, respectively, compared to PBS-treated mice. The percentage of OVA-Alexa647+CD4+ and CD4−CD8α− DCs 24 h post Ye infection was similar to that of PBS-treated mice (Fig. 2A and B). Interestingly, we found that the percentage of OVA-Alexa647+CD4+ and CD4−CD8α− DCs was increased 1,5 - to 4-fold three days p.i. with Ye, respectively (Fig. 2A and B).

Furthermore, we determined antigen degradation of DC subpopulations in vivo by analyzing the percentage of OVA-Alexa647+DQ-OVA+ cells related to all cells, which took up OVA-Alexa647 after infection of mice with Ye (Fig. 2A upper right quadrant/upper two quadrants). Overall, 40% of CD4+ and CD8α+ DCs from PBS-treated mice degraded OVA, in contrast to only 15% of CD4−CD8α− DCs (Fig. 2C). 24 h and three days p.i. of mice with Ye, OVA degradation by CD8α+ DCs was slightly but significantly reduced by 15% compared to PBS-treated mice (Fig. 2C). CD4+ and CD4−CD8α− DCs showed similar OVA degradation as PBS-treated mice 24 h post infection. In contrast, three days post Ye infection 70% of all OVA-Alexa647+CD4+ were also positive for DQ-OVA, indicating an increase in OVA degradation. Analyzing the CD4−CD8α− DCs we observed, similar to CD4+ DCs, an increase in OVA degradation from 15% to 45%.
Altogether, these data indicate that Ye specifically reduces antigen uptake and degradation by CD8α+ DCs, while CD4+ and CD4−CD8α− DCs showed an increase in OVA uptake and degradation three days p.i. with Ye.
Ye induces maturation in DC subpopulations in vivo
As maturation of DCs is induced upon the encounter of danger signals such as LPS and is essential for T-cell activation, we analyzed the induction of maturation of DC subpopulations by Ye upon in vivo infection. Mice were infected with Ye and spleen cells were subjected to flow cytometry analysis of MHC class II and the costimulatory molecules CD80, CD86 and CD40 (Fig. 3A). The expression of MHC class II molecules was up-regulated up to two-fold 24 h p.i. in all three DC subsets. However, expression of MHC class II molecules was significantly reduced three days p.i. compared to 24 h p.i. (Fig. 3B). Similar results were found for CD8α+ and CD4−CD8α− DCs in terms of CD80, CD86, and CD40 expression, and for CD4+ DCs in terms of CD86 expression. In contrast, no up-regulation of CD40 and only a slight up-regulation of CD80 was observed for CD4+ DCs upon Ye infection (Fig. 3A). Taken together, Ye induces up-regulation of maturation markers in all splenic cDC subsets 24 h post infection, but this up-regulation is absent three days post infection.

Consistently, infection of mice for 24 h with Ye resulted in the increased production of the proinflammatory cytokines IL-12 and TNF (Fig. 3C) by CD4+ and CD4−CD8α− DCs compared to PBS-treated mice. Interestingly, CD8α+ DCs produced less IL-12 and TNF upon Yersinia infection (Fig. 3C), indicating that Ye specifically targets this cDC subset. In summary, Ye differentially affects splenic DC subpopulations in terms of maturation and cytokine production.
Ye injects bacterial proteins into splenic DCs
Yops are the major pathogenicity factors of Ye and are injected into host cells via the TTSS. By this means, Ye inhibits phagocytosis, antigen presentation and both NF-κB and MAPK signaling cascades [44]. Köberle et al. and others revealed that Ye, Y. pseudotuberculosis and Y. pestis preferentially target macrophages, DCs, and Gr-1+ cells [45]–[47]. To analyze whether Ye preferentially targets a splenic DC subpopulation, we adapted a recently described, new reporter system for monitoring injection of bacterial proteins into host cells via the TTSS [45], [48], [49]. We used Ye wild type strain expressing either a YopE-β-lactamase fusion protein or YopE-OVA as control for mouse infection experiments. Spleen cells were stained with the lipophilic CCF4-AM [50], an esterified form of the CCF4 substrate. After entry into living cells (Figure S1), cytoplasmic esterases rapidly convert CCF4-AM into negatively charged CCF4, which is retained in the cytoplasm. Excitation of CCF4 cumarin residue at 409 nm results in a fluorescence resonance energy transfer (FRET) to the fluorescein residue, leading to emission of green fluorescence at 520 nm. Cleavage of CCF4 substrate by β-lactamase interrupts FRET leading to light emission at 447 nm (blue fluorescence). Therefore, injection of YopE-β-lactamase by Ye into DCs can be determined by analyzing the CCF4-green+blue+ DCs by flow cytometry. 24 h p.i. with Ye YopE-β-lactamase mutant strain, 7.1±1.9% CD11chi cells displayed blue fluorescence (Fig. 4A: R1 in dot plots), indicating injection of the YopE-β-lactamase fusion protein into the cells. No β-lactamase+ cells (R1) and only 0.1±0.1% β-lactamase+ cells (R1) could be detected in mice either treated with PBS or infected with the control Ye mutant strain YopE-OVA, respectively. Flow cytometry analysis of the different DC subpopulations for injection of the YopE-β-lactamase revealed that significantly more CD8α+ DCs (11.4±1.2%) were Yop injected compared to CD4+ (6.2±0.4%) and CD4−CD8α− DCs (6.4±0.5%) 24 h p.i. (Fig. 4 A).

To further elucidate direct effects of Yop-injection into the DC subsets we analyzed the β-lactamase+ (R1 in Fig. 4A) and β-lactamase− DC subpopulations (R2 in Fig. 4A) from mice infected with the Ye E40 YopE-β-lactamase mutant strain for their expression of MHC class II and CD86. Overall, the expression of these markers by all DC subpopulations from Ye E40 YopE-β-lactamase mutant strain-infected mice (R1 as well as R2) was increased compared to DCs from uninfected control mice (Fig. 4B). These results are similar to that from mice infected with Ye WA-314 pYV+ wild type strain (Fig. 3A & B) used in all other experiments of this study. The expression of MHC class II was higher (by 15%) in β-lactamase+CD4+ and β-lactamase+CD4−CD8α− DCs compared to the β-lactamase− cells, while the MHC class II expression of β-lactamase+CD8α+ DCs was 15% less than that of β-lactamase−CD8α+ DCs (Fig. 4B). In contrast, CD86 expression of β-lactamase+CD8α+ and CD4−CD8α− DCs was reduced by 40% or 15%, respectively, compared to the corresponding β-lactamase− cells. CD86 expression by CD4+ DCs was independent of Yop-injection.
In conclusion, Ye directly targets a significant fraction of splenic DCs, most frequently the CD8α+ subpopulation, leading to less expression of MHC class II and CD86 by these Yop-injected cells when compared to the Yop-uninjected cells.
Ye induces loss of splenic DC subpopulations
Mice treated with LPS or infected with E. coli showed a transient loss of CD4+ and CD8α+ DCs in the spleen by apoptosis [51]. Here, apoptosis was mediated via TLR4 and TRIF signaling. To elucidate whether Ye induces DC death in vivo, the number of live and dead splenic DC subpopulations from Ye-infected and PBS-treated mice were analyzed (Fig. 5). Upon infection with Ye CD4+ (90%) and to a lesser extent CD8α+ DCs (65%) were lost (Fig. 5A and B). Specifically, the number of CD4+ and CD8α+ DCs declined from 1.1×10⁶ cells and 4.7×10⁵/spleen in PBS-treated mice to 1×10⁵ cells and 1.7×10⁵/spleen three days p.i. with Ye, respectively (Fig. 5B). In contrast, the number of CD4−CD8α− DCs in the spleen increased upon Ye infection compared to that in control mice. In addition, we did immunofluorescence microscopy of cryosections from the spleen of Ye or PBS-treated mice analyzing the CD11c+ cells. Ye infection leads to the migration of CD11c+ cells from the marginal zone (PBS-treated mice) to the T-cell zone of the lymphoid follicles and to a reduced number of CD11c+ cells three days p.i. (Fig. 6A). CD4 or CD8α down-regulation on CD4+ or CD8α+ DCs was not observed upon infection of splenocytes with Ye in vitro (Fig. S2), indicating that the loss of DC subpopulations is not due to simple down-regulation of these receptors.
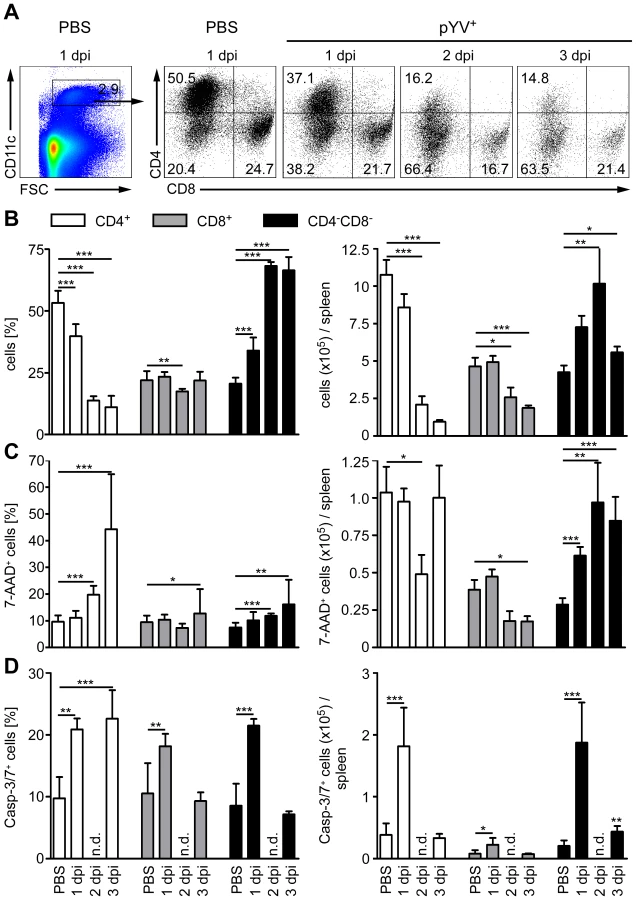

We next examined whether the loss of CD4+ and CD8α+ DCs is due to the induction of cell death upon Ye infection. Therefore, we gated on 7-AAD+ DC subpopulations because 7-AAD is taken up by cells with a damaged cell membrane (gating strategy shown in Fig. S3A and S3B). The percentage of 7-AAD+CD4+ DCs increased from 10% in PBS-treated mice to 44% upon infection with Ye (Fig. 5C left diagram), whereas the total number of 1.0×10⁵ 7-AAD+CD4+ DCs observed in PBS-treated mice was not increased upon Ye infection (Fig. 5C right diagram). This can be explained by the decreased number of CD4+ DCs two and three days post Ye infection. In line with these data, CD4+ DCs displayed an increase in active caspases-3/7+ cells of 20% upon Ye infection, compared to 10% in PBS-treated mice (Fig. 5D left diagram; gating strategy shown in Fig. S3A and S3C). Thus, a significant increase in the number of caspases-3/7+CD4+ DCs could be observed 24 h post infection. Cell death analyses of CD8α+ DCs revealed no increase of 7-AAD+, but a slight increase of caspases-3/7+ DCs 24 h post Ye infection, compared to PBS-treated mice. Ye induced cell death in CD4−CD8α− DCs as shown by the increase of the percentage and absolute numbers of 7-AAD+ and caspases-3/7+ cells.
Furthermore, we used TUNEL staining for cell death detection and found a massive increase of TUNEL+ cells located in Yersinia-induced abscesses. However, only very few single apoptotic DCs (CD11c+TUNEL+) were found in Yersinia-induced abscesses in the spleen of infected mice (Fig. 6B), and total numbers of 7-AAD+ CD4+ and CD8α+ DCs were unaltered upon Ye infection and in PBS-treated control mice.
Hence, Ye-induced apoptosis of CD4−CD8α− DCs results in a rapid recruitment of the exact same DC subtype during infection as the population size does not decline. We also observed an increase in the percentage, but not in total numbers, of cell death in CD4+ and CD8α+ DCs; thus, the Ye-induced loss of CD4+ and CD8α+ DCs in the spleen can only partly be explained by the induction of apoptosis in these splenic DC subpopulations.
Ye-induced loss of CD4+ and CD8α+ DCs is mediated via TLR4 and TRIF signaling
To elucidate whether the loss of CD4+ and CD8α+ DCs induced by Ye is due to TLR signaling, we analyzed the number of live and dead DC subpopulations in the spleen from TLR2−/−xTLR4−/−, MyD88−/−, and TRIF−/− mice. Mice were infected with different doses of Ye to obtain similar bacterial burden in the spleen three days p.i. (Fig. 7A). Similar to C57BL/6 wild type mice, the number of total viable CD4+ and CD8α+ DCs in MyD88−/− mice decreased up to 80% upon Ye infection (Fig. 7B), whereas more or less similar numbers of these subpopulations could be observed in TLR2−/−xTLR4−/− and TRIF−/− mice. Furthermore, the number of CD4−CD8α− DCs per spleen was unchanged upon infection in wild type and MyD88−/− mice, but was significantly increased in TLR2−/−xTLR4−/− and TRIF−/− mice. Hence, Ye-induced loss of CD4+ and CD8α+ DCs in wild type mice is mediated via signaling through TLR4 and TRIF.

Upon Ye infection a dramatic increase of 7-AAD+CD4+ DCs was observed in wild type and TRIF−/− mice, but not in TLR2−/−xTLR4−/− and MyD88−/− mice (Fig. 7C), indicating that the induction of cell death in CD4+ DCs by Ye is mediated via MyD88 signaling. Ye induces a decrease of CD4+ DCs by 60% in MyD88−/− mice, while the cell death rate of this population is less than 10%, indicating that induction of cell death seems not to be responsible for the observed decrease of CD4+ DCs.
Increased proliferation and inhibition of de novo generation of CD4+ DCs upon Ye infection
To determine whether Ye modulates the proliferation capacity of DCs, BrdU incorporation into DC subpopulations from C57BL/6 mice infected with Ye or treated with PBS was analyzed by flow cytometry. As described by others [52], [53] CD8α+ DCs showed a higher BrdU incorporation than CD4−CD8α− and CD4+ DCs (Fig. 8A). Two and three days p.i. with Ye the percentage of BrdU+ DC subpopulations was significantly increased compared to PBS-treated mice. In fact, 81.7±4.1% BrdU+CD4+ DCs could be observed three days p.i. compared to 37.1±3.6% in PBS-treated mice. BrdU+ CD4−CD8α− and CD8α+ DCs increased from 40.8±3.4% to 74.3±5.1% and 64.2±2.6% to 80.1±5.0% 3 days p.i., respectively. In conclusion, Ye induced a faster proliferation of all DC subpopulations.

All splenic DCs examined in this study originate from the same precursors. In the bone marrow myeloid precursors (MPs) differentiate into macrophage and DC precursors (MDPs). They develop into common DC progenitors (CDPs) and then pre-DCs, which give exclusively rise to cDCs [54], [55]. To analyze whether the de novo generation of the DC subpopulations in the spleen is impaired by Ye we used a transgenic mouse model, in which the DC subpopulations, but not their precursors, were ablated by diphtheria toxin (DT) treatment [56]. To this end CD11c.DOG mice were injected once with DT one day prior to Ye infection, and the number of DC subpopulations was analyzed one to three days p.i.. In uninfected CD11c.DOG control mice DT treatment led to 84%, 82%, and 50% reduced numbers of CD4+, CD8α+, and CD4−CD8α− DCs one day after DT treatment, respectively (Fig. 8B). Four days after DT treatment the number of all DC subpopulations increased to normal numbers, indicating that all DCs were recovered in the spleen at this time point. In contrast, in Ye-infected DT-treated CD11c.DOG mice, the number of CD4+ DCs did not recover during the period of observation; in fact, the number of CD4+ DCs one to three days p.i. was even less than that of CD11c.DOG mice after DT treatment, indicating that Ye blocks the de novo generation of CD4+ DCs. Likewise, the number of CD8α+ DCs did not completely recover after Ye infection compared to PBS-treated mice, whereas the number of CD4−CD8α− DCs was even increased one to three days p.i. compared to PBS-treated mice, indicating that Ye infection leads to an increased de novo generation of CD4−CD8α− DCs. To exclude the possibility that these CD4−CD8α− DCs were inflammatory DCs generated from monocytes or monocyte precursors, CD4−CD8α− DCs from DT-treated CD11c.DOG mice were analyzed for monocytic markers three days p.i. with Ye or treatment with PBS (Fig. 8C). The recovered CD4−CD8α− DCs from both Ye-infected as well as PBS-treated mice did not express either iNOS, CD115 or Ly6C. These markers are characteristically expressed by TNF and iNOS producing DCs (Tip-DCs) or inflammatory macrophages but not by CD4−CD8α− DCs [54]. Taken together, Ye stimulates increased proliferation of DCs, but higher cell death rates combined with inhibition of de novo generation lead to loss of CD4+ and CD8α+ DC subsets upon infection.
Discussion
Strong efforts were made to elucidate the function of different splenic DC subsets, but little is known about their roles during bacterial infections. In previous work, we demonstrated that CD4+ T cells are essential in controlling infection by the extracellular bacterial pathogen Ye in mice [34], [35] and that Ye modulates DC functions of BM-DCs in vitro, leading to inhibition of T-cell proliferation [27], [40], [41]. However, infection experiments with BM-DCs can not be used to extrapolate the events operating upon infection of DCs in vivo because here, distinct DC subsets with different tissue distribution and functions exist. This study was aimed to investigate the effects of Ye infection on splenic DC subsets with respect to antigen uptake, antigen processing, cytokine production and subsequently T-cell proliferation in vivo.
Strikingly, we found an impaired ability to induce T-cell proliferation by CD8α+ but not by CD4+ or CD4−CD8α− DCs upon Ye infection in vivo. This is due to a reduction of antigen uptake and degradation, as well as an inhibition of proinflammatory cytokine secretion. Adoptive transfer experiments with antigen-pulsed CD8α+ DCs demonstrated that they promote Th1 responses, whereas CD8α− DCs promote Th2 responses [18], [57], [58]. Therefore, targeting of CD8α+ DCs by Ye may result in immune evasion of the pathogen as infection control requires CD4+ Th1 host responses [34], [37]. IL-12 is the key cytokine responsible for Th1 activation. CD8α+ DCs have been shown to produce high levels of IL-12 in vivo upon microbial stimulation or infection [57], [59]–[63]. On the other hand, CD8α− DCs were also shown to produce IL-12 in response to TLR7 ligands [64] and LPS in the presence of anti-IL-10 [59]. Upon infection with Ye, IL-12 as well as TNF production was induced in CD4+ and CD4−CD8α−, but decreased in CD8α+ DCs, which in turn may account for reduced T-cell priming by CD8α+ DCs.
Macropinocytosis of fluid phase antigen is shown to be down regulated during DC maturation [65]–[67]. Ye infection led to a reduction in OVA uptake by CD8α+ DCs, which could be either due to Yop translocation or induction of DC maturation. Several facts argue against the second possibility: all DC subpopulations display largely mature phenotypes 24 h p.i. but only the CD8α+ DCs show reduced OVA uptake. All DC subpopulations display immature phenotypes 72 h p.i.. At this point OVA uptake by CD8α+ DCs was significantly reduced, but increased in CD4+ and CD4−CD8α− DCs. As CD8α+ DCs are considered to be the most effective splenic DC-type in terms of antigen uptake in vivo [20], the findings suggest that CD8α+ DCs are specifically targeted by Ye. Consistently, OVA uptake was shown to be mediated predominantly via the macrophage-mannose receptor (MR). This process is independent of DC maturation [68], [69]. The MR is expressed only by splenic CD8α+ DCs [68], [69] explaining the 3,5–7 fold higher OVA uptake by CD8α+ DCs compared to CD4+ and CD4−CD8α− DCs in control mice. Previous studies with BM-DCs showed, that Ye YopP inhibits OVA uptake via receptor-mediated endocytosis, suggesting a direct effect of Ye on OVA uptake by CD8α+ DCs [40]. Whether Ye infection causes a down regulation of MR is unknown.
DC maturation is crucial for their ability to activate T cells. Here we found that Ye rapidly induced DC maturation in all DC subsets, which was absent three days p.i.. This could be due to the down-regulation of the maturation markers or a rapid turnover of all DC subsets induced by Ye. In vitro infection of BM-DCs with Ye revealed an inhibition of DC maturation with respect to expression of MHC II and costimulatory molecules as well as proinflammatory cytokine production [27]. These in vitro data differ from the results in this study, but can be explained by a lesser Yop-injection rate into DCs in vivo. Usually, up-regulation of maturation markers is observed upon bacterial infections at different time points, but their down-regulation is not described [70]–[73]. De Trez et al. showed that infection of mice with live or heat-killed apathogenic E. coli induced maturation of splenic DCs 6 to 9 h p.i. in a TLR4 and TRIF signaling dependent manner [51]. In the present study, application of heat-killed Ye did not induce maturation of splenic DCs (data not shown), suggesting that effects other than TLR activation are responsible for DC maturation in Yersinia infection. In Salmonella-infected mice, maturation is induced directly in DCs associated with intracellular Salmonella and indirectly via Salmonella-induced TNF production [71]. Whether TNF-induced maturation plays a role in Ye-induced DC maturation has to be further elucidated. In conclusion, maturation of DCs in vivo is variably regulated in response to different bacterial pathogens.
We and others could show that Ye, Y. pestis and Y. pseudotuberculosis preferentially target professional phagocytes like Gr-1+ cells, macrophages, and DCs in vivo by using a β-lactamase reporter system to detect Yop injection into host cells [45]–[47]. Ye targets specifically CD8α+ DCs, which in turn express less MHC class II and CD86 than non-injected CD8α+ DCs. This implies that Ye induces DC maturation which is then reversed by Yop injection. In contrast, Yop-injected B cells displayed a significantly increased expression of CD69 compared to non-Yop-injected B cells, indicating activation of these cells by Ye [46]. The fact that CD8α+ DCs are targeted most frequently by Ye is in agreement with their impaired OVA uptake and degradation, and cytokine production leading to less T cell activation. It was shown that YopH specifically inhibits both T and B cell activation in vitro [74], [75]. Whether Yops secreted into T cells have a direct effect on T-cell proliferation in vivo remains to be shown. It also remains to be determined why Yops are specifically injected into CD8α+ DCs and how this affects DC functions like cytokine production and T cell priming in vivo. The DC subsets may differ in their ability to chemotax towards bacteria. Moreover, as binding of Ye to β1-integrins is essential for Yop injection [46] the expression of β1-integrins by DC subsets, could result in the selection for a specific DC subset.
The reduction in CD4+ and CD8α+ DCs in the spleen upon Ye infection is dependent on TLR4-TRIF signaling. Upon infection of mice with E. coli or treatment with LPS, the number of CD4+ and CD8α+ DCs was markedly reduced 48 hours later [15], [51], a result of TLR4-TRIF signaling induced apoptosis [51]. Recent findings demonstrate that Type I IFN regulate the turnover of splenic conventional DCs in vivo [76]. Whether Type I IFNs are involved in the turnover of conventional DCs upon Ye infection was not analyzed. Furthermore, oral infection of mice with Salmonella typhimurium specifically induces death of CD8α+ DCs, but not of CD8α− DCs, via MyD88 and TNFR1 signaling [77]. However, Ye induced death of predominantly CD4+ DCs in a MyD88 dependent manner. Recently it was shown that Y. pseudotuberculosis induces caspase-1-dependent pyroptosis in activated macrophages in vivo [78]. Caspase-1 activation might be responsible for some of the loss of DCs upon Ye infection, particularly on day 3 p.i. when only a fraction of the 7-AAD+ cells are caspase-3/7+. Unfortunately, the β-lactamase reporter system can only be used in viable cells and the detection of Yop-injection into apoptotic cells in vivo is limited.
Here we show for the first time that a bacterial pathogen affects the homeostasis of specific DC subpopulations. It is likely that the increased proliferation in combination with the impaired de novo generation of CD4+ and CD8α+ DCs cause the Ye-induced loss of these DC subpopulations. Recently, Hochweller et al. could show that DC depletion led to enhanced DC generation as a result of increased differentiation rates from pro-DCs to pre-DCs and conventional DCs in the spleen [79]. This suggests, that the higher proliferation of all DC subpopulations upon Ye infection is due to an increased differentiation of precursor cells into conventional DCs. Upon infection of mice with Listeria monocytogenes or Leishmania major recruited inflammatory monocytes differentiate into Tip-DCs at sites of infection in a CCR2-dependent manner [80]–[82]. Interestingly, the observed increased numbers of CD4−CD8α− DCs upon Ye infection do not represent Tip-DCs. Nevertheless, more detailed studies are needed to uncover the mechanism responsible for the disturbed CD4+ DC homeostasis upon Ye infection. Furthermore, it must be stressed that the observed changes in DC functions described herein occurred upon infection with high doses of bacteria; it might well be that the quantity of bacterial pathogenicity factors operating might be important for the observed effects.
In summary, this study demonstrates that Ye affects splenic DC subpopulations in different ways: Ye directly injects Yops into a portion of all DC subpopulations. In addition, infection of mice with Ye leads to a massive reduction of CD4+ DCs in a TLR4 - and TRIF-dependent manner. Moreover, we cannot exclude that DC subpopulations are differentially susceptible or resistant to pathogenicity factors such as Yops of Ye. Nevertheless, the direct and indirect effects of Ye on DC subpopulations may contribute to reduced T-cell proliferation and thus immune evasion of the pathogen.
Our data and published reports (e.g. Mycobacterium tuberculosis, Salmonella typhimurium, E. coli [15], [51], [62], [83]) suggest that (i) splenic DC subsets are differentially affected by various bacterial pathogens, and (ii) primarily indirect effects exerted by systemic infection contribute to alterations of the majority of DCs in vivo rather than direct interactions of DCs with pathogens. This together with different functions of the DC subpopulations leads to the variability of DC responses to various bacterial infections.
Materials and Methods
Mice and infection
Ethics statement: Animal experiments were performed in strict accordance with the German regulations of the Society for Laboratory Animal Science (GV-SOLAS) and the European Health Law of the Federation of Laboratory Animal Science Associations (FELASA). The protocol was approved by the Regierungspräsidium Tübingen (Permit Number: IM5/08). All efforts were made to minimize suffering.
Female C57BL/6JolaHsd mice were purchased from Harlan Winkelmann (Borchen, Germany). TLR2−/−xTLR4−/−, TRIF−/− (LPS2) [84], MyD88−/− [85], OT-II [43], and CD11c.DOG [56] mice with a genetic C57BL/6 background were bred under specific pathogen-free conditions in the animal facilities of the University Clinic of Tübingen and the University of Tübingen. Mice used for experiments were between 6–9 weeks of age and were provided food and water ad libitum.
Mice were infected with the indicated amount of Ye WA-314 (serotype 0∶8) from frozen stock suspensions in 200 µl PBS into the tail vein. As a control, mice were infected only with 200 µl PBS. For the translocation experiments mice were infected with Ye 5×10⁵ E40-YopE53-βlactamase or E40-YopE53-OVA [46] as control one h after treatment of the mice with 2.5 mg desferoxamine mesylate salt (Sigma) in PBS i.v.. The bacterial load in the spleen was assessed after plating serial dilutions of the cell suspensions obtained on Müller-Hinton agar plates and was comparable for all mouse strains. For systemic DC depletion BAC transgenic CD11c.DOG mice, that express the human diphtheria toxin receptor under control of the CD11c promoter, were injected intraperitoneally with 8 ng/g bodyweight of diphteria toxin (Sigma) in PBS one day before Ye infection.
Cell preparation
Spleens were cut into small pieces and then digested for 30 min at 37°C in 2 ml modified RPMI 1640 + 2% FCS medium containing collagenase (1 mg/ml; type IV; Sigma-Aldrich) and DNase I (150 µg/ml, Roche). To disrupt DC-T cell complexes, EDTA (0.1 ml, 0.1 M (pH 7.2)) was added, and mixing continued for 5 min. Single cell suspensions were made by pipetting the digested organs. Undigested fibrous material was removed by filtration and erythrocytes were lysed with lysis buffer (150 mM NH4Cl, 10 mM KHCO3, 2 mM NaEDTA). The total number of cells was determined by trypan blue exclusion. Spleen cells were prepared from individual mice for all experiments except those of Fig. 1B and 1C. In these experiments, CD11c-expressing cells were enriched from single cell suspensions of spleen pooled from 3 or 7 mice by MACS technology using N418 magnetic beads (Miltenyi Biotec) following the manufacturer's protocol. Cells were blocked and stained with CD11c-APC, CD4-PE, and CD8α-FITC in PBS. Then the DC subpopulations were sorted on a FACS Aria cell sorter (BD Biosciences), reanalyzed on a Canto-II flow cytometer and used for co-culture experiments in vitro (as described below).
Flow cytometry
FACS buffer in PBS containing 1% FBS (Sigma-Aldrich) and 0.09% NaN3 (Sigma-Aldrich) was used for all incubations and washing steps. Before staining, cells were incubated for 15 min at 4°C with hybridoma supernatant from 2.4G2 cell line producing anti-FcgRII/III mAb. Cells were then stained with FITC, PE, APC, PE-Cy7, APC-Alexa700, pacific blue, or biotinylated conjugates of anti-CD11c (HL3, BD Biosciences, Miltenyi Biotec), CD8α (53-6.7, BD Biosciences), CD4 (RM4-5), CD3 (145.2C11), CD80 (16-10A1, BD Biosciences), CD86 (GL-1, BD Biosciences), CD40 (HM40-3, BD Biosciences), MHC II (M5/114.15.2, eBiosciences) for 20 min at 4°C. To exclude dead cells, 7-aminoactinomycin D (7-AAD; Sigma-Aldrich) was used in the case of surface staining and aqua life dead (Invitrogen) in the case of intracellular cytokine staining. When biotinylated mAb were used, cells were stained a second time with streptavidin-pacific orange or streptavidin-PE. To detect intracellular production of TNF, IL-6, IL-12, cells were seeded at 1×10⁶ cells/well in low adherence, 24-well plates (BD Falcon) and incubated for three to four h with brefeldin A (Biolegend) at a final concentration of 5 µg/ml. Cells were then stained for surface phenotype, fixed with 1% paraformaldehyde (Sigma-Aldrich) in PBS, permeabilized with 0,1% saponin (Sigma-Aldrich) and 0,5% BSA (Sigma-Aldrich) in PBS, and stained for intracellular cytokines with anti-TNF (MP6-XT22; BD Biosciences), IL-6 (MP5-20F3; Biolegend), IL-12p40 (C15.6; BD Biosciences) for 15 min at 4°C. Samples were acquired for 6 to 8-colour analysis using a Canto-II flow cytometer (BD Biosciences) with DIVA software (BD Biosciences) and further analyzed using FlowJo 7.5 software (TreeStar Inc). A total of 500,000–1,200,000 cells were acquired to ensure the analysis of at least 8,000 viable splenic DCs in each sample from individual mice.
For the detection of apoptotic DCs 3×10⁶ splenocytes were stained with FITC-Caspases 3 & 7 FLICA Apoptosis Dectection Kit (Immunohistochemistry Technologies, LLC) according to the manufacturer's instructions. Thereafter, cells were stained for cell surface antigens, measured and analyzed as described above.
For the detection of β-lactamase activity, surface molecule staining was performed as described above. Then 4×10⁶ cells were resuspended in 1x CCF4-AM staining solution supplemented with probenecid, prepared according to the manufacturer's instructions (Invitrogen). Following an incubation of 40 min at room temperature in the dark, cells were measured by flow cytometry on a Canto-II flow cytometer (BD Biosciences) and analyzed using FlowJo 7.5 software (Tree Star Inc).
For the detection of the BrdU labeling in vivo mice were daily injected i.v. with 1.0 mg BrdU (BD Biosciences). Surface molecule staining of splenocytes was performed as described above. Then the cells were fixed, permeabilized and BrdU-FITC staining was performed according to the manufacturer's protocol (BD Biosciences).
T cell proliferation assays
CD4+ T cells were purified from spleen of OT-II mice as described previously [27] by using the CD4-negative T cell isolation kit and a magnetic-activated cell sorter system (Miltenyi Biotec). The resulting T cell preparations, containing 95 to 99% CD4+ T cells, were washed twice with ice-cold PBS, incubated with CFSE (5 µM; Invitrogen) in PBS for 5 min at room temperature, and then washed twice with ice-cold heat-inactivated FBS.
For the in vivo proliferation assays, 2×10⁶ CFSE-labeled T cells per mouse were adoptively transferred into the tail vain 6–8 h p.i. with Ye, followed by i.v. injection of ovalbumin protein (500 µg/mouse; Sigma-Aldrich) 24 h post infection. 96 h later T cell proliferation of the CFSE-labeled CD4+ T cells was analyzed by flow cytometry, as described above, after staining with pacific blue-conjugated anti-CD4 (eBiosciences), APC-Vα2 (eBiosciences), and 7-AAD.
For the in vitro stimulation, 1×10⁴ CFSE-labeled T cells were co-incubated with 1×10³ sorted splenic DCs per well in RPMI 1640 medium (Biochrom, Berlin, Germany) supplemented with 10% FBS (Sigma), 2 mM L-glutamine (Invitrogen), 100 U of penicillin/ml, 100 µg/ml of streptomycin (Biochrom), 50 µM β-mercaptoethanol (Sigma), 1% (vol/vol) nonessential amino acids (Biochrom), and 1 mM sodium pyruvate (Biochrom) in 96 V-bottom well plates in the presence of 100 µg/ml ovalbumin protein or 150 ng/ml OVA323–339 peptide. 72 h post incubation at 37°C cells were stained as described for the in vivo proliferation assay and acquired by flow cytometry on a Canto-II (BD Biosciences).
The division index was analyzed using FlowJo Software 7.5. It is defined as the average number of cell divisions that the responding cells underwent (excluding undivided cells).
Measurement of antigen uptake and antigen processing by flow cytometry
For antigen uptake or antigen processing, 100 µg of ovalbumin-AlexaFluor647 and DQ-ovalbumin (both from Molecular Probes) were injected into the tail vain of mice infected for one or three days with Ye as described above. One h later the spleen of the mice was removed and processed for flow cytometry analyses as described above. The measurement of antigen uptake or processing was performed on a FACS Canto II flow cytometer (BD Biosciences) and analyzed using FlowJo Software 7.5 (Tree Star). The OVA processing was quantified as the frequency of OVA-Alexa647+OVADQ+cells/the frequency of OVA-Alexa647+ cells x 100.
Immunofluorescence of cryosections
Tissues were embedded in the Tissue-Tek OCT compound (Sakura) and frozen at −80°C, and 5 µm cryostat sections were prepared. Tissue sections were fixed for 15 min at RT with 4% paraformaldehyde (TUNEL and CD11c staining) or for 10 min with ice cold acetone (CD11c staining), washed twice with PBS and the excess of biotin was blocked with a biotin blocking kit (Vector). Tissue sections were incubated overnight at 4°C with biotin-conjugated anti-CD11c antibody (HL3, 5 µg/ml in PBS-10% FBS), washed and then incubated with streptavidin-AlexaFluor594 (2.5 µg/ml in PBS-10% FBS) for 1 h at 4°C. Slides were further treated to visualize apoptotic cells using FITC-labeled TUNEL kit (Böhringer Mannheim) according to the manufacturer's instructions. Slides were mounted in Mowiol (Carl Roth). Labeled cells were visualized with a DMRE fluorescence microscope (Leica) or an Axiovert 200 M fluorescence microscope (Zeiss).
Statistics
Data were analyzed using the Graph Pad Prism 4.0 software. Diagrams show mean values + SD, except for Fig. 6C where mean values + SEM are shown. Statistical analysis was performed using the unpaired two-tailed Student's t test. Differences were considered as statistically significant if p<0.05 (*), p<0.01 (**), or p<0.005 (***).
Supporting Information
Zdroje
1. FearonDT
LocksleyRM
1996
The instructive role of innate immunity in the acquired immune response.
Science
272
50
53
2. HoffmannJA
KafatosFC
JanewayCA
EzekowitzRA
1999
Phylogenetic perspectives in innate immunity.
Science
284
1313
1318
3. MedzhitovR
JanewayCAJr
1997
Innate immunity: impact on the adaptive immune response.
Curr Opin Immunol
9
4
9
4. MatzingerP
1994
Tolerance, danger, and the extended family.
Annu Rev Immunol
12
991
1045
5. MuzioM
NatoliG
SaccaniS
LevreroM
MantovaniA
1998
The human toll signaling pathway: divergence of nuclear factor kappaB and JNK/SAPK activation upstream of tumor necrosis factor receptor-associated factor 6 (TRAF6).
J Exp Med
187
2097
2101
6. BrightbillHD
LibratyDH
KrutzikSR
YangRB
BelisleJT
1999
Host defense mechanisms triggered by microbial lipoproteins through toll-like receptors.
Science
285
732
736
7. AliprantisAO
YangRB
MarkMR
SuggettS
DevauxB
1999
Cell activation and apoptosis by bacterial lipoproteins through toll-like receptor-2.
Science
285
736
739
8. BanchereauJ
SteinmanRM
1998
Dendritic cells and the control of immunity.
Nature
392
245
252
9. BellD
YoungJW
BanchereauJ
1999
Dendritic cells.
Adv Immunol
72
255
324
10. HartDN
1997
Dendritic cells: unique leukocyte populations which control the primary immune response.
Blood
90
3245
3287
11. SteinmanRM
1991
The dendritic cell system and its role in immunogenicity.
Annu Rev Immunol
9
271
296
12. BanchereauJ
BriereF
CauxC
DavoustJ
LebecqueS
2000
Immunobiology of dendritic cells.
Annu Rev Immunol
18
767
811
13. IwasakiA
MedzhitovR
2004
Toll-like receptor control of the adaptive immune responses.
Nat Immunol
5
987
995
14. VremecD
PooleyJ
HochreinH
WuL
ShortmanK
2000
CD4 and CD8 expression by dendritic cell subtypes in mouse thymus and spleen.
J Immunol
164
2978
2986
15. De SmedtT
PajakB
MurailleE
LespagnardL
HeinenE
1996
Regulation of dendritic cell numbers and maturation by lipopolysaccharide in vivo.
J Exp Med
184
1413
1424
16. De SmedtT
PajakB
KlausGG
NoelleRJ
UrbainJ
1998
Antigen-specific T lymphocytes regulate lipopolysaccharide-induced apoptosis of dendritic cells in vivo.
J Immunol
161
4476
4479
17. IdoyagaJ
SudaN
SudaK
ParkCG
SteinmanRM
2009
Antibody to Langerin/CD207 localizes large numbers of CD8alpha+ dendritic cells to the marginal zone of mouse spleen.
Proc Natl Acad Sci U S A
106
1524
1529
18. Maldonado-LopezR
De SmedtT
MichelP
GodfroidJ
PajakB
1999
CD8alpha+ and CD8alpha - subclasses of dendritic cells direct the development of distinct T helper cells in vivo.
J Exp Med
189
587
592
19. SchnorrerP
BehrensGM
WilsonNS
PooleyJL
SmithCM
2006
The dominant role of CD8+ dendritic cells in cross-presentation is not dictated by antigen capture.
Proc Natl Acad Sci U S A
103
10729
10734
20. PooleyJL
HeathWR
ShortmanK
2001
Cutting edge: intravenous soluble antigen is presented to CD4 T cells by CD8 - dendritic cells, but cross-presented to CD8 T cells by CD8+ dendritic cells.
J Immunol
166
5327
5330
21. CoverTL
AberRC
1989
Yersinia enterocolitica.
N Engl J Med
321
16
24
22. CornelisGR
2002
Yersinia type III secretion: send in the effectors.
J Cell Biol
158
401
408
23. AiliM
TelepnevM
HallbergB
Wolf-WatzH
RosqvistR
2003
In vitro GAP activity towards RhoA, Rac1 and Cdc42 is not a prerequisite for YopE induced HeLa cell cytotoxicity.
Microb Pathog
34
297
308
24. BarzC
AbahjiTN
TrulzschK
HeesemannJ
2000
The Yersinia Ser/Thr protein kinase YpkA/YopO directly interacts with the small GTPases RhoA and Rac-1.
FEBS Lett
482
139
143
25. BlackDS
BliskaJB
1997
Identification of p130Cas as a substrate of Yersinia YopH (Yop51), a bacterial protein tyrosine phosphatase that translocates into mammalian cells and targets focal adhesions.
EMBO J
16
2730
2744
26. IriarteM
CornelisGR
1998
YopT, a new Yersinia Yop effector protein, affects the cytoskeleton of host cells.
Mol Microbiol
29
915
929
27. ErfurthSE
GrobnerS
KramerU
GunstDS
SoldanovaI
2004
Yersinia enterocolitica induces apoptosis and inhibits surface molecule expression and cytokine production in murine dendritic cells.
Infect Immun
72
7045
7054
28. OrthK
PalmerLE
BaoZQ
StewartS
RudolphAE
1999
Inhibition of the mitogen-activated protein kinase kinase superfamily by a Yersinia effector.
Science
285
1920
1923
29. PalmerLE
HobbieS
GalanJE
BliskaJB
1998
YopJ of Yersinia pseudotuberculosis is required for the inhibition of macrophage TNF-alpha production and downregulation of the MAP kinases p38 and JNK.
Mol Microbiol
27
953
965
30. RuckdeschelK
RoggenkampA
LafontV
MangeatP
HeesemannJ
1997
Interaction of Yersinia enterocolitica with macrophages leads to macrophage cell death through apoptosis.
Infect Immun
65
4813
4821
31. AdkinsI
SchulzS
BorgmannS
AutenriethIB
GrobnerS
2008
Differential roles of Yersinia outer protein P-mediated inhibition of nuclear factor-kappa B in the induction of cell death in dendritic cells and macrophages.
J Med Microbiol
57
139
144
32. GrobnerS
AdkinsI
SchulzS
RichterK
BorgmannS
2007
Catalytically active Yersinia outer protein P induces cleavage of RIP and caspase-8 at the level of the DISC independently of death receptors in dendritic cells.
Apoptosis
12
1813
1825
33. GrobnerS
AutenriethSE
SoldanovaI
GunstDS
SchallerM
2006
Yersinia YopP-induced apoptotic cell death in murine dendritic cells is partially independent from action of caspases and exhibits necrosis-like features.
Apoptosis
11
1959
1968
34. AutenriethIB
TingleA
Reske-KunzA
HeesemannJ
1992
T lymphocytes mediate protection against Yersinia enterocolitica in mice: characterization of murine T-cell clones specific for Y. enterocolitica.
Infect Immun
60
1140
1149
35. AutenriethIB
HantschmannP
HeymerB
HeesemannJ
1993
Immunohistological characterization of the cellular immune response against Yersinia enterocolitica in mice: evidence for the involvement of T lymphocytes.
Immunobiology
187
1
16
36. BohnE
HeesemannJ
EhlersS
AutenriethIB
1994
Early gamma interferon mRNA expression is associated with resistance of mice against Yersinia enterocolitica.
Infect Immun
62
3027
3032
37. BohnE
AutenriethIB
1996
IL-12 is essential for resistance against Yersinia enterocolitica by triggering IFN-gamma production in NK cells and CD4+ T cells.
J Immunol
156
1458
1468
38. BohnE
SingA
ZumbihlR
BielfeldtC
OkamuraH
1998
IL-18 (IFN-gamma-inducing factor) regulates early cytokine production in, and promotes resolution of, bacterial infection in mice.
J Immunol
160
299
307
39. AutenriethIB
HeesemannJ
1992
In vivo neutralization of tumor necrosis factor-alpha and interferon-gamma abrogates resistance to Yersinia enterocolitica infection in mice.
Med Microbiol Immunol
181
333
338
40. AutenriethSE
SoldanovaI
RosemannR
GunstD
ZahirN
2007
Yersinia enterocolitica YopP inhibits MAP kinase-mediated antigen uptake in dendritic cells.
Cell Microbiol
9
425
437
41. AdkinsI
KoberleM
GrobnerS
AutenriethSE
BohnE
2008
Y. enterocolitica inhibits antigen degradation in dendritic cells.
Microbes Infect
10
798
806
42. TrulzschK
SporlederT
IgweEI
RussmannH
HeesemannJ
2004
Contribution of the major secreted yops of Yersinia enterocolitica O:8 to pathogenicity in the mouse infection model.
Infect Immun
72
5227
5234
43. BarndenMJ
AllisonJ
HeathWR
CarboneFR
1998
Defective TCR expression in transgenic mice constructed using cDNA-based alpha - and beta-chain genes under the control of heterologous regulatory elements.
Immunol Cell Biol
76
34
40
44. CornelisGR
2002
The Yersinia Ysc-Yop ‘type III’ weaponry.
Nat Rev Mol Cell Biol
3
742
752
45. MarketonMM
DePaoloRW
DeBordKL
JabriB
SchneewindO
2005
Plague bacteria target immune cells during infection.
Science
309
1739
1741
46. KoberleM
Klein-GuntherA
SchutzM
FritzM
BerchtoldS
2009
Yersinia enterocolitica targets cells of the innate and adaptive immune system by injection of Yops in a mouse infection model.
PLoS Pathog
5
e1000551
47. DurandEA
Maldonado-ArochoFJ
CastilloC
WalshRL
MecsasJ
2010
The presence of professional phagocytes dictates the number of host cells targeted for Yop translocation during infection.
Cell Microbiol
48. CharpentierX
OswaldE
2004
Identification of the secretion and translocation domain of the enteropathogenic and enterohemorrhagic Escherichia coli effector Cif, using TEM-1 beta-lactamase as a new fluorescence-based reporter.
J Bacteriol
186
5486
5495
49. GeddesK
CruzF
HeffronF
2007
Analysis of cells targeted by Salmonella type III secretion in vivo.
PLoS Pathog
3
e196
50. ZlokarnikG
NegulescuPA
KnappTE
MereL
BurresN
1998
Quantitation of transcription and clonal selection of single living cells with beta-lactamase as reporter.
Science
279
84
88
51. De TrezC
PajakB
BraitM
GlaichenhausN
UrbainJ
2005
TLR4 and Toll-IL-1 receptor domain-containing adapter-inducing IFN-beta, but not MyD88, regulate Escherichia coli-induced dendritic cell maturation and apoptosis in vivo.
J Immunol
175
839
846
52. KamathAT
PooleyJ
O'KeeffeMA
VremecD
ZhanY
2000
The development, maturation, and turnover rate of mouse spleen dendritic cell populations.
J Immunol
165
6762
6770
53. KamathAT
HenriS
BattyeF
ToughDF
ShortmanK
2002
Developmental kinetics and lifespan of dendritic cells in mouse lymphoid organs.
Blood
100
1734
1741
54. GeissmannF
ManzMG
JungS
SiewekeMH
MeradM
2010
Development of monocytes, macrophages, and dendritic cells.
Science
327
656
661
55. LiuK
WaskowC
LiuX
YaoK
HohJ
2007
Origin of dendritic cells in peripheral lymphoid organs of mice.
Nat Immunol
8
578
583
56. HochwellerK
StrieglerJ
HammerlingGJ
GarbiN
2008
A novel CD11c.DTR transgenic mouse for depletion of dendritic cells reveals their requirement for homeostatic proliferation of natural killer cells.
Eur J Immunol
38
2776
2783
57. PulendranB
SmithJL
CasparyG
BraselK
PettitD
1999
Distinct dendritic cell subsets differentially regulate the class of immune response in vivo.
Proc Natl Acad Sci U S A
96
1036
1041
58. Maldonado-LopezR
De SmedtT
PajakB
HeirmanC
ThielemansK
1999
Role of CD8alpha+ and CD8alpha - dendritic cells in the induction of primary immune responses in vivo.
J Leukoc Biol
66
242
246
59. Maldonado-LopezR
MaliszewskiC
UrbainJ
MoserM
2001
Cytokines regulate the capacity of CD8alpha(+) and CD8alpha(-) dendritic cells to prime Th1/Th2 cells in vivo.
J Immunol
167
4345
4350
60. DalodM
Salazar-MatherTP
MalmgaardL
LewisC
Asselin-PaturelC
2002
Interferon alpha/beta and interleukin 12 responses to viral infections: pathways regulating dendritic cell cytokine expression in vivo.
J Exp Med
195
517
528
61. MaroofA
KayePM
2008
Temporal regulation of interleukin-12p70 (IL-12p70) and IL-12-related cytokines in splenic dendritic cell subsets during Leishmania donovani infection.
Infect Immun
76
239
249
62. YrlidU
WickMJ
2002
Antigen presentation capacity and cytokine production by murine splenic dendritic cell subsets upon Salmonella encounter.
J Immunol
169
108
116
63. Reis eSousa
HienyS
Scharton-KerstenT
JankovicD
CharestH
1997
In vivo microbial stimulation induces rapid CD40 ligand-independent production of interleukin 12 by dendritic cells and their redistribution to T cell areas.
J Exp Med
186
1819
1829
64. EdwardsAD
DieboldSS
SlackEM
TomizawaH
HemmiH
2003
Toll-like receptor expression in murine DC subsets: lack of TLR7 expression by CD8 alpha+ DC correlates with unresponsiveness to imidazoquinolines.
Eur J Immunol
33
827
833
65. GarrettWS
ChenLM
KroschewskiR
EbersoldM
TurleyS
2000
Developmental control of endocytosis in dendritic cells by Cdc42.
Cell
102
325
334
66. SteinmanRM
SwansonJ
1995
The endocytic activity of dendritic cells.
J Exp Med
182
283
288
67. WestMA
PrescottAR
EskelinenEL
RidleyAJ
WattsC
2000
Rac is required for constitutive macropinocytosis by dendritic cells but does not control its downregulation.
Curr Biol
10
839
848
68. BurgdorfS
Lukacs-KornekV
KurtsC
2006
The mannose receptor mediates uptake of soluble but not of cell-associated antigen for cross-presentation.
J Immunol
176
6770
6776
69. BurgdorfS
KautzA
BohnertV
KnollePA
KurtsC
2007
Distinct pathways of antigen uptake and intracellular routing in CD4 and CD8 T cell activation.
Science
316
612
616
70. SponaasAM
CadmanET
VoisineC
HarrisonV
BoonstraA
2006
Malaria infection changes the ability of splenic dendritic cell populations to stimulate antigen-specific T cells.
J Exp Med
203
1427
1433
71. SundquistM
WickMJ
2005
TNF-alpha-dependent and -independent maturation of dendritic cells and recruited CD11c(int)CD11b+ Cells during oral Salmonella infection.
J Immunol
175
3287
3298
72. TamMA
WickMJ
2006
Differential expansion, activation and effector functions of conventional and plasmacytoid dendritic cells in mouse tissues transiently infected with Listeria monocytogenes.
Cell Microbiol
8
1172
1187
73. TamMA
SundquistM
WickMJ
2008
MyD88 and IFN-alphabeta differentially control maturation of bystander but not Salmonella-associated dendritic cells or CD11cintCD11b+ cells during infection.
Cell Microbiol
10
1517
1529
74. YaoT
MecsasJ
HealyJI
FalkowS
ChienY
1999
Suppression of T and B lymphocyte activation by a Yersinia pseudotuberculosis virulence factor, yopH.
J Exp Med
190
1343
1350
75. GerkeC
FalkowS
ChienYH
2005
The adaptor molecules LAT and SLP-76 are specifically targeted by Yersinia to inhibit T cell activation.
J Exp Med
201
361
371
76. MatteiF
BracciL
ToughDF
BelardelliF
SchiavoniG
2009
Type I IFN regulate DC turnover in vivo.
Eur J Immunol
39
1807
1818
77. SundquistM
WickMJ
2009
Salmonella induces death of CD8{alpha}+ dendritic cells but not CD11cintCD11b+ inflammatory cells in vivo via MyD88 and TNFR1.
J Leukoc Biol
85
225
234
78. BergsbakenT
CooksonBT
2007
Macrophage activation redirects yersinia-infected host cell death from apoptosis to caspase-1-dependent pyroptosis.
PLoS Pathog
3
e161
79. HochwellerK
MiloudT
StrieglerJ
NaikS
HammerlingGJ
2009
Homeostasis of dendritic cells in lymphoid organs is controlled by regulation of their precursors via a feedback loop.
Blood
114
4411
4421
80. JiaT
SerbinaNV
BrandlK
ZhongMX
LeinerIM
2008
Additive roles for MCP-1 and MCP-3 in CCR2-mediated recruitment of inflammatory monocytes during Listeria monocytogenes infection.
J Immunol
180
6846
6853
81. SerbinaNV
Salazar-MatherTP
BironCA
KuzielWA
PamerEG
2003
TNF/iNOS-producing dendritic cells mediate innate immune defense against bacterial infection.
Immunity
19
59
70
82. De TrezC
MagezS
AkiraS
RyffelB
CarlierY
2009
iNOS-Producing Inflammatory Dendritic Cells Constitute the Major Infected Cell Type during the Chronic Leishmania major Infection Phase of C57BL/6 Resistant Mice.
PLoS Pathog
5
e1000494
83. NeuenhahnM
KerksiekKM
NauerthM
SuhreMH
SchiemannM
2006
CD8alpha+ dendritic cells are required for efficient entry of Listeria monocytogenes into the spleen.
Immunity
25
619
630
84. HoebeK
DuX
GeorgelP
JanssenE
TabetaK
2003
Identification of Lps2 as a key transducer of MyD88-independent TIR signalling.
Nature
424
743
748
85. HemmiH
KaishoT
TakeuchiO
SatoS
SanjoH
2002
Small anti-viral compounds activate immune cells via the TLR7 MyD88-dependent signaling pathway.
Nat Immunol
3
196
200
Štítky
Hygiena a epidemiologie Infekční lékařství LaboratořČlánek vyšel v časopise
PLOS Pathogens
2010 Číslo 11
- Parazitičtí červi v terapii Crohnovy choroby a dalších zánětlivých autoimunitních onemocnění
- Vakcíny proti klíšťové encefalitidě
- Kdy je nejlepší očkovat
- Možné vedlejší účinky očkování
- Imunogenita vakcín
Nejčtenější v tomto čísle
- Zn Inhibits Coronavirus and Arterivirus RNA Polymerase Activity and Zinc Ionophores Block the Replication of These Viruses in Cell Culture
- The Female Lower Genital Tract Is a Privileged Compartment with IL-10 Producing Dendritic Cells and Poor Th1 Immunity following Infection
- Crystal Structure and Size-Dependent Neutralization Properties of HK20, a Human Monoclonal Antibody Binding to the Highly Conserved Heptad Repeat 1 of gp41
- The Arabidopsis Resistance-Like Gene Is Activated by Mutations in and Contributes to Resistance to the Bacterial Effector AvrRps4
Zvyšte si kvalifikaci online z pohodlí domova
Mazová zátka a její řešení
nový kurzVšechny kurzy