
A Molecular Mechanism for Eflornithine Resistance in African Trypanosomes
Human African trypanosomiasis, endemic to sub-Saharan Africa, is invariably fatal if untreated. Its causative agent is the protozoan parasite Trypanosoma brucei. Eflornithine is used as a first line treatment for human African trypanosomiasis, but there is a risk that resistance could thwart its use, even when used in combination therapy with nifurtimox. Eflornithine resistant trypanosomes were selected in vitro and subjected to biochemical and genetic analysis. The resistance phenotype was verified in vivo. Here we report the molecular basis of resistance. While the drug's target, ornithine decarboxylase, was unaltered in resistant cells and changes to levels of metabolites in the targeted polyamine pathway were not apparent, the accumulation of eflornithine was shown to be diminished in resistant lines. An amino acid transporter gene, TbAAT6 (Tb927.8.5450), was found to be deleted in two lines independently selected for resistance. Ablating expression of this gene in wildtype cells using RNA interference led to acquisition of resistance while expression of an ectopic copy of the gene introduced into the resistant deletion lines restored sensitivity, confirming the role of TbAAT6 in eflornithine action. Eflornithine resistance is easy to select through loss of a putative amino acid transporter, TbAAT6. The loss of this transporter will be easily identified in the field using a simple PCR test, enabling more appropriate chemotherapy to be administered.
Published in the journal:
. PLoS Pathog 6(11): e32767. doi:10.1371/journal.ppat.1001204
Category:
Research Article
doi:
https://doi.org/10.1371/journal.ppat.1001204
Summary
Human African trypanosomiasis, endemic to sub-Saharan Africa, is invariably fatal if untreated. Its causative agent is the protozoan parasite Trypanosoma brucei. Eflornithine is used as a first line treatment for human African trypanosomiasis, but there is a risk that resistance could thwart its use, even when used in combination therapy with nifurtimox. Eflornithine resistant trypanosomes were selected in vitro and subjected to biochemical and genetic analysis. The resistance phenotype was verified in vivo. Here we report the molecular basis of resistance. While the drug's target, ornithine decarboxylase, was unaltered in resistant cells and changes to levels of metabolites in the targeted polyamine pathway were not apparent, the accumulation of eflornithine was shown to be diminished in resistant lines. An amino acid transporter gene, TbAAT6 (Tb927.8.5450), was found to be deleted in two lines independently selected for resistance. Ablating expression of this gene in wildtype cells using RNA interference led to acquisition of resistance while expression of an ectopic copy of the gene introduced into the resistant deletion lines restored sensitivity, confirming the role of TbAAT6 in eflornithine action. Eflornithine resistance is easy to select through loss of a putative amino acid transporter, TbAAT6. The loss of this transporter will be easily identified in the field using a simple PCR test, enabling more appropriate chemotherapy to be administered.
Introduction
Human African trypanosomiasis (HAT) is a neglected tropical infectious disease transmitted by biting tsetse flies and is prevalent in sub-Saharan Africa [1], [2]. In humans, the disease is caused by two sub-species of the protozoan Trypanosoma brucei – T. b. gambiense and T. b. rhodesiense. T. b. gambiense is responsible for around 95% of all cases of the disease. An alarming resurgence of the disease in the latter part of the twentieth century stimulated a renewed interest in HAT control [2].
There are two stages of HAT. The first stage is characterised by parasite proliferation in the blood and lymph, while the second stage occurs when parasites enter the CSF (cerebrospinal fluid) and brain, resulting in symptoms that include confusion, depression, personality changes and the altered sleep-wake patterns that give the disease its common name of sleeping sickness. Death follows, inevitably, without treatment. Chemotherapy in stage two HAT requires melarsoprol, a melaminophenyl arsenical, or eflornithine, an amino acid analogue which inhibits the polyamine biosynthetic enzyme ornithine decarboxylase (ODC).
Melarsoprol is exceedingly toxic, killing 5% of recipient HAT patients [2]. Furthermore, treatment failure with melarsoprol has led to its being superseded by eflornithine. Recently, nifurtimox use with eflornithine has been recommended [3], [4] and the combination added to the WHO list of essential medicines.
Eflornithine targets ornithine decarboxylase in trypanosomes [5], [6], and this causes diminished polyamine biosynthesis [5] and reduced production of the trypanosome specific redox active metabolite trypanothione [7]. Accumulation of S-adenosyl methionine has been reported in eflornithine treated cells, which might perturb cellular methylation reactions [8] although recent data identified increased levels of decarboxylated S-adenosyl methionine, but not its precursor [9]. How eflornithine enters trypanosomes is a subject of debate. An early report that eflornithine uptake by trypanosomes was not saturable established the idea that eflornithine enters trypanosomes by passive diffusion [10]. However, studies on eflornithine resistant procyclic trypanosomes showed reduced accumulation of eflornithine [11] and uptake of eflornithine was by a saturable process typical of a transporter. Bellofatto et al [12] also found uptake of eflornithine to be temperature dependent and thus likely to be transporter mediated. Indeed as a zwitterionic, charged amino acid, eflornithine would not be expected to diffuse across membranes and transport mediated uptake would be a pre-requisite for uptake. In T. brucei loss of transport has been shown to be a key determinant in resistance to melaminophenylarsenicals [13] and diamidine drugs [14]–[16].
Given the increased use of eflornithine, alone or in combination with nifurtimox, a better understanding of the risk of resistance is critical. Such an understanding may help limit its spread and allow the development of diagnostic tools such as those described for melarsoprol resistance [15], [16].
We have investigated the mechanism of resistance to eflornithine and show that acquisition of selected resistance is accompanied by loss of a specific transporter. We further show, using genetic manipulation, that this transporter mediates uptake of eflornithine and that its loss confers resistance, whilst its expression in resistant lines restores sensitivity.
Results
Selection of eflornithine resistant bloodstream form T. brucei
Eflornithine resistant parasites were derived in vitro from a wildtype bloodstream form T. brucei brucei strain 427 by growth in increasing concentrations of drug. It took two months (24 passages) to attain a line expressing forty fold less sensitivity to drug, based on the IC50 value of eflornithine in the drug sensitive parent strain (Fig. 1A) and no growth phenotype was observed. Two independent cell lines were generated in this way. There was no cross-resistance with other currently used trypanocides (Table 1), although there was a significant increase in sensitivity to pentamidine, which we cannot explain at this juncture. The resistant lines also grew in female ICR (Institute for Cancer Research) mice and exhibited resistance to both the minimum curative dose of 2% w/v and a higher 5% w/v eflornithine whilst mice infected with wildtype cells were cured with the lower 2% w/v dose. Resistant cells remained susceptible to pentamidine (4 mg kg−1, four daily doses) (Fig. 1B). This demonstrates that the in vitro selected mechanism for resistance is also operative in vivo. Interestingly, isobologram analyses (Fig. 2) revealed that nifurtimox and eflornithine are not synergistic to one another's activity in vitro. The average fractional inhibitory concentration (FIC) is used as a measure of interaction between two drugs and is a sum of the IC50 of the drug acting in combination divided by the IC50 of the drug acting alone. An FIC of 1.5 was recorded for eflornithine and nifurtimox, where a value ≥1.4 is taken as antagonistic [17]). This was a surprise given the theory that eflornithine would deplete cellular trypanothione thus rendering the cells more susceptible to oxidative stress induced by nifurtimox.


Polyamine pathway metabolite levels are unchanged in eflornithine resistant cells
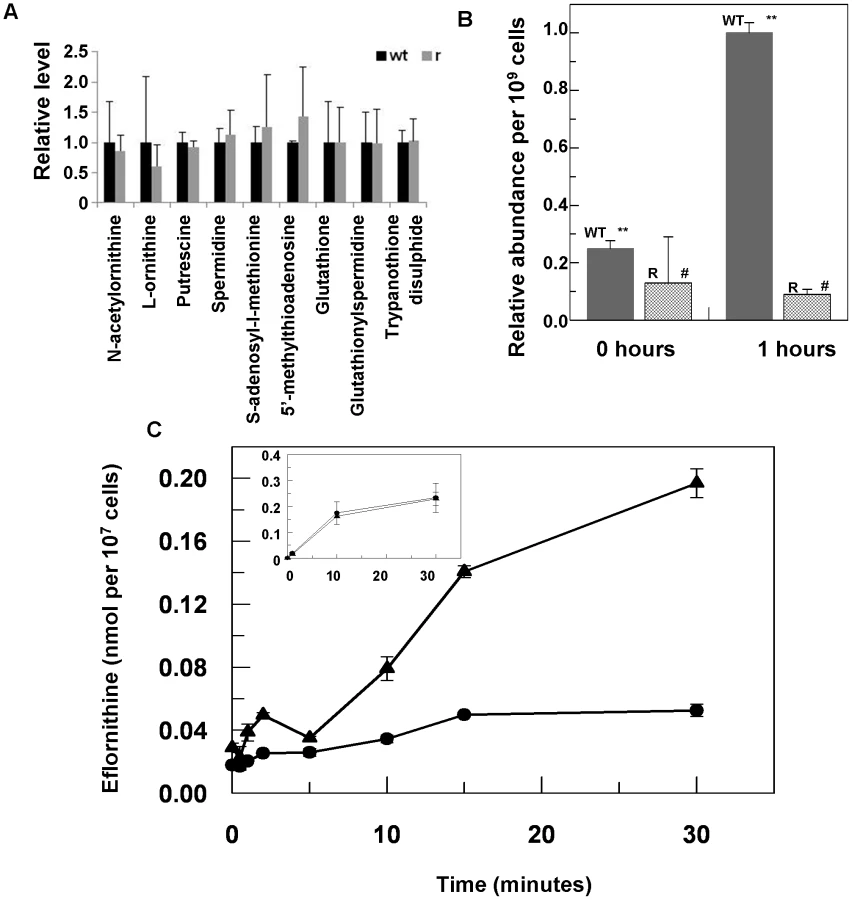
Eflornithine's target is the enzyme ornithine decarboxylase. Alterations to the amino acid composition of proteins is often responsible for drug resistance as variants with diminished ability to bind drug are selected [18]. We therefore amplified the ODC gene from the wildtype and the resistant cell line (DFMOR1 and R2) and found no differences in the sequence or copy number. Earlier work [19] had pointed to possible changes in S-adenosyl methionine and polyamine metabolism relating to refractoriness to eflornithine. We therefore subjected wildtype and resistant cells to untargeted metabolomic analysis to determine whether changes in relative levels of key metabolites could be determined (Figure S1 and Table S1). Significant differences between the untargeted metabolite profiles of wildtype and resistant cells were not apparent using multivariate statistical analysis, nor were changes seen in any of the identified polyamine pathway metabolites including S-adenosyl methionine (Fig. 3A). However, in a targeted analysis of eflornithine (m/z = 183.0940) accumulation, it was evident that eflornithine levels were greatly reduced in resistant cells compared to wildtype (Fig. 3B). This result indicated that exclusion of drug from the resistant line (DFMOR1) rather than changes to metabolism were responsible for loss of sensitivity.
Loss of eflornithine accumulation into resistant cells
To determine quantitatively the relative transport rates of the drug in wildtype and resistant cells, 3H-eflornithine was used to measure accumulation in each cell type. A greater rate of eflornithine uptake was observed in the wildtype cell line compared to the resistant line (DFMOR1), with around five fold more drug taken into wildtype cells after 30 minutes (Fig. 3C).
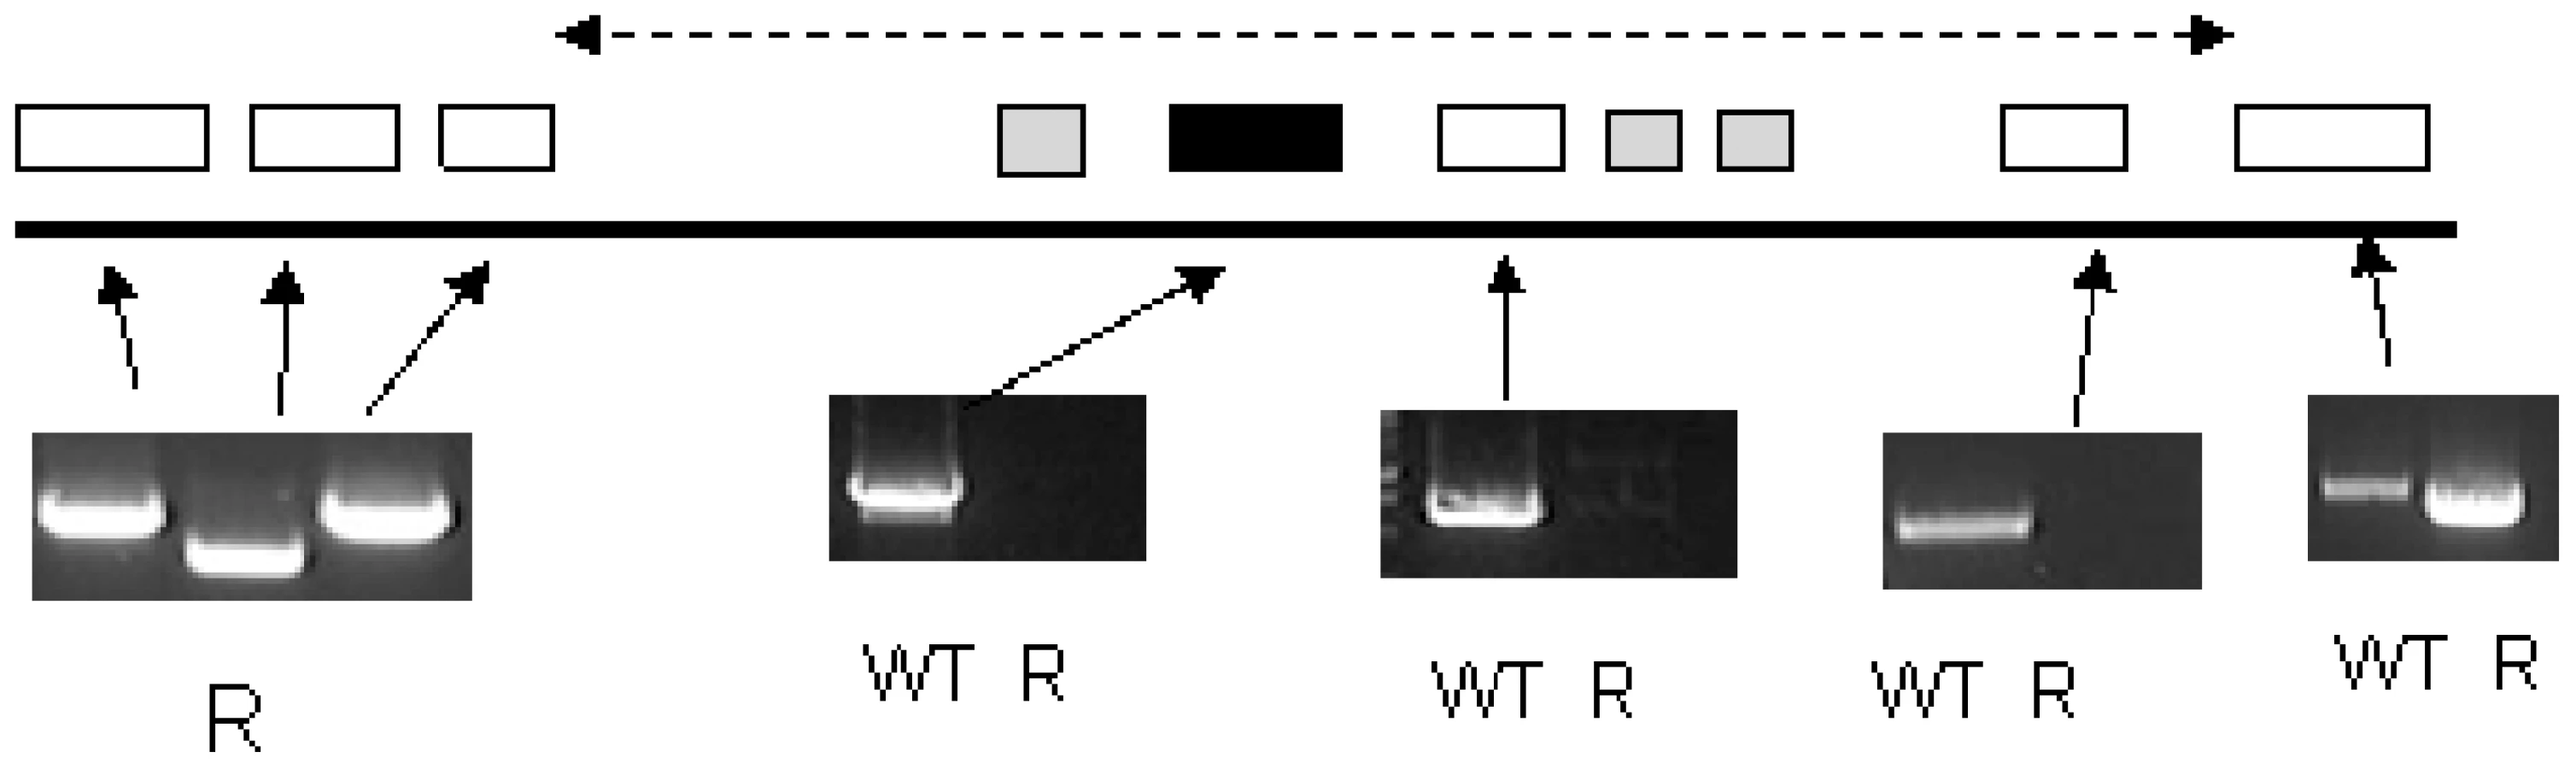
These data indicated a transporter phenotype, as seen previously in selection of resistance to melamine based arsenicals [13] and diamidines [14], [16], [20], [21]. As eflornithine is an amino acid analogue (Fig. 4), we hypothesised loss of an amino acid transporter. To test this, members of the amino acid permease gene family (Fig. 5) in the T. brucei genome [22] were systematically amplified from both wildtype and each of the two independently selected resistant lines. In each of the independently selected lines only one single copy amino acid transporter gene, TbAAT6 (Tb927.8.5450), was shown to be absent (Fig. 5). PCR analysis indicated a deletion of this, and surrounding genes, from both resistant lines (DFMOR1, Fig. 6, R2 not shown). This result indicated the possibility that the TbAAT6 gene could play a role in eflornithine's entry into T. brucei and that its loss was responsible for drug resistance. The gene was amplifiable at day 34 (Fig. 1A), but by day 50 (Fig. 1A) was no longer amplifiable.


Functional confirmation of a role for TbAAT6 in eflornithine resistance
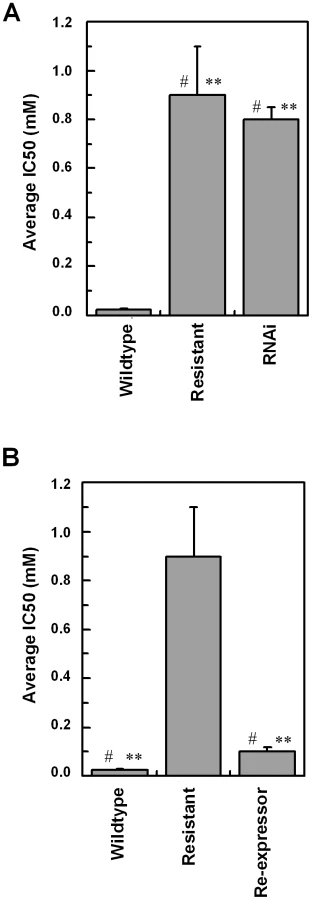
To confirm a role for TbAAT6 in eflornithine resistance we used RNA interference [23] to ablate its expression in Trypanosoma brucei. A cloned line was selected and this TbAAT6RNAi mutant became resistant to eflornithine to an extent similar to the lines selected for resistance to the drug (40.1×resistance factor) (Fig. 7A) when expression was ablated by addition of tetracycline. Next, we expressed the TbAAT6 gene in the eflornithine selected trypanosomes using vector pHD676 [24]. Cloned cells in which the gene was re-expressed regained levels of eflornithine sensitivity similar to wildtype (Fig. 7B). Loss of expression of TbAAT6 is therefore both necessary and sufficient to confer resistance to eflornithine and its re-expression in defective lines capable of restoring sensitivity, regardless of other changes to the cell.
Discussion
Human African trypanosomiasis, also known as sleeping sickness in its second stage when parasites have invaded the brain, is a neglected tropical disease [1]. Major epidemics at the end of the twentieth century were brought under control largely through increased efforts in distribution and treatment with the few drugs available to treat the disease [2]. An alarming increase in the incidence of treatment failure with melarsoprol has led to its being replaced with eflornithine as first line treatment for stage 2 HAT [2]. Combination therapy using eflornithine with the nitrofuran, nifurtimox, licensed for use in Chagas' disease has been added to the World Health Organisation's list of essential medicines as part of the nifurtimox-eflornithine combination therapy for HAT [3]. Although several initiatives are underway to develop new drugs for human African trypanosomiasis, none are currently in human trials and a minimum of five years will elapse before a new drug could complete trials and reach the market place. The loss of eflornithine, alone or in the nifurtimox combination, would represent a calamity in terms of sustaining control of HAT.
The data presented here show that resistance to eflornithine is easily selected in the laboratory. Selection of resistance in two independently derived lines led to deletion of the TbAAT6 gene. Eflornithine uptake was lost indicating that this gene encodes a transporter capable of carrying the drug into trypanosomes. The loss of TbAAT6 either by gene deletion as observed in the selected drug resistance lines, or by RNAi is sufficient to render trypanosomes over 40 fold less sensitive to eflornithine than wildtype cells. Furthermore, ectopic expression of TbAAT6 in trypanosomes that have deleted the gene is sufficient to restore wildtype levels of eflornithine sensitivity confirming that loss of TbAAT6 alone is necessary and sufficient to generate resistance.
We have, as yet, been unable to assign a physiological function to TbAAT6 in African trypanosomes, and this is a topic of ongoing research. However, it is one of a large family of related genes described in the kinetoplastida belong to the amino acid transporter 1 superfamily. Only a few other members of the family have been functionally characterised. These include an arginine transporter in Leishmania donovani [25], an arginine transporter in T. cruzi [26] and polyamine transporters in L. major [27] and T. cruzi [28]. The AAT6 gene is not syntenic with genes in Leishmania spp. or T. cruzi. Furthermore, the evolution of the AAT family [22] makes it impossible, currently, to define specific functionality to any of these transporters based on homology alone.
Previous work with bloodstream and procyclic form trypanosomes also revealed a relative simplicity in selecting eflornithine resistance [11], [12], [29]. In procyclic forms reduced rates of eflornithine uptake were identified [11], [12] with possible changes to other transporters for ornithine and putrescine also suggested. In bloodstream forms reduction in eflornithine uptake was noted in two of six eflornithine refractory T. b. rhodesiense lines [29], but in the majority of cases no difference in eflornithine uptake was noted leading the authors to dismiss altered drug uptake as an underlying mechanism for the natural refractoriness of many strains of T. b. rhodesiense in the field [30]. Possible changes to S-adenosylmethionine metabolism instead were inferred as being significant in that study [29]. Our metabolomics experiments showed that none of the measured polyamine pathway metabolites differed significantly between wildtype and resistant lines in our study. Furthermore, as noted above, the reduced uptake of eflornithine by trypanosomes lacking TbAAT6, without further requirement of changes in metabolism, is both necessary and sufficient to yield a resistance phenotype without any requirement for changes to metabolic pathways which will be essentially unchanged as drug no longer accumulates to inhibitory levels in trypanosomes. Recently, two groups have employed high throughput RNAi screening to determine whether knockdown of any genes correlate with to resistance to various trypanocides including eflornithine. In both instances, TbAAT6 was implicated in loss of sensitivity to eflornithine (David Horn, London School of Hygiene and Tropical Medicine, personal communication) and Isabel Roditi [31].
Since eflornithine has only recently been implemented as first line treatment for stage two HAT, formal published reports of clinical resistance have not yet appeared, although unpublished data (Enock Matovu (Makerere University), personal communication) points to a substantial increase in eflornithine treatment failures in Northern Uganda. Furthermore, given that the actions of nifurtimox and eflornithine are not synergistic, trypanosomes already bearing resistance, through loss of transport, to eflornithine would effectively be subject to nifurtimox monotherapy even in combination chemotherapy. Nifurtimox resistance has been selected in vitro and has been shown to be cross resistant with another emerging trypanocide, fexinidazole, currently in clinical trials [32]. Given nifurtimox's lack of efficiency [33], eflornithine resistance alone is likely to lead to large numbers of treatment failures from the combination. If the loss of TbAAT6 is involved in resistance in the field, then it will be possible to implement a simple PCR-based test for resistance, allowing for more suitable treatments to be administered.
Materials and Methods
Ethics statement
This study was undertaken in adherence to experimental guidelines and procedures approved by the UK Home Office under Project Licence No. 60/3760 as complying with the Animals (Scientific Procedures) Act 2006 entitled Biochemistry, genetics and immunology of parasitic protozoa.
Culturing bloodstream form trypanosomes
Wildtype 427 bloodstream form trypanosomes were cultured in HMI-9 (Biosera) [34] supplemented with 10% foetal calf serum (Biosera) at 37°C, 5% CO2. Eflornithine resistant parasites were selected in increasing concentrations of drug starting at 15 µM. When cells were growing at a rate comparable to wildtype they were cloned by limiting dilution and subcultured into double the drug concentration.
In vitro drug treatment
The Alamar blue assay developed by Raz et al. [35] for bloodstream form trypanosomes was used. Bloodstream form parasites were seeded 4×10⁴ cells per ml into a serial dilution of eflornithine (a gift from Pere Simarro, WHO) starting at 20 mM. Plates were incubated for 48 hours at 37°C, 5% CO2 then 20 µL Resazurin dye (Sigma) at 0.49 µM was added to each well. Plates were incubated for a further 24 hours then read on a fluorimeter (emission 530, excitation 595) (FLUOstar Optima, BMG Labtech). IC50 values were calculated using Graphpad Prism5 Software and defined as the concentration of drug required to diminish fluorescence output by 50%. Significance was determined using an unpaired t-test with a Dunnett's post hoc test. For the isobologram analysis Alamar blue assays were conducted using nifurtimox in serial dilution under eflornithine concentrations of 2.5 µM, 15 µM and 25 µM.
In vivo drug treatment
Four groups of mice (three mice per group) were inoculated with T. brucei 427 wildtype and another four groups with one of the selected eflornithine resistant lines (termed DFMOR2). Each inoculum consisted of 1×10⁶ parasites per animal (i.e. 200 µL of 5×10⁶ cells mL−1) which was administered via intraperitoneal injection. The groups of mice infected with T. brucei 427 wildtype and T. brucei eflornithine resistant clones were treated in parallel to each other 24 hours post-infection with the different treatment groups as described below following earlier protocols [30]. (a) Eflornithine 2% w/v for six days in drinking water with the eflornithine solution being refreshed every three days; (b) Eflornithine, 5% w/v for six days in drinking water, with the eflornithine solution being refreshed every three days; (c) Pentamidine 4 mg kg−1 injected daily via intraperitoneal route for four days (200 µL per injection); and (d) Untreated (i.e. no treatment administered). The exact dosing of eflornithine was determined by daily water consumption measurements. Parasitaemia levels of each animal were monitored daily via venepunctures and microscopic observations of subsequent blood smears. In instances where infection reaches ∼108 cells mL−1 or at the end of the experiment, mice were euthanised using a Schedule 1 method.
PCR analysis
Genomic DNA was denatured at 94°C for two minutes, followed by 30 cycles of 94°C for 15 seconds, annealing (50–55°C depending on specific oligonucleotide) for 15 seconds and extension at 72°C for 30 seconds/500 bases. A final elongation of 7 minutes was used. See Text S1 for primer sequences used.
Transfection of trypanosomes
2T1 bloodstream form cells were used to create the RNAi cell line with the pRPaSLi stem loop construct [23]. Eflornithine resistant cells (derived from wildtype 427) were used with the pHD676 [24] construct to create the re-expressor line. Linearised plasmid was transfected into the cells using programme X-001 on an Amaxa Nucleofector II. For the RNAi construct, selection was with hygromycin (15 µg/ml) (Sigma). Cells positive for the re-expression construct were selected with hygromycin (15 µg/ml) (Roche) were added after 24 hours and clones were obtained.
Amino acid uptake
Uptake was analysed using tritiated substrate and eflornithine accumulation using a mass spectrometry approach. In the mass spectrometry approach cells were harvested in mid-log growth phase and resuspended at 1×10⁹ in HMI-9 with added eflornithine at 0.1 mM. These were incubated for 30 minutes, washed in HMI-9 and quenched in hot ethanol. The cell lysate was then run on the Orbitrap mass spectrometer as detailed below.
Tritiated eflornithine was obtained from Moravek Biochemicals with a specific activity of 1.6 Ci/mmol, 1mCi/ml. Mid-logarithmic growth phase cells were grown up to attain sufficient cell densities to permit use of 2×10⁷ cells per reaction. Cells were washed in CBSS buffer (25 mM HEPES, 120 mM NaCl, 5.4 mM KCl, 0.55 mM CaCl.2H2O, 0.5 mM MgSO4.7H2O, 5.6 mM Na2HPO4, 11.1 mM D-glucose) and resuspended to a density of 1×10⁸/ml. A rapid oil/stop spin protocol, previously described by Carter & Fairlamb [13], was used. 100 µl of oil (1-Bromodo-decane, density: 1.066 gcm-3) (Aldrich) and 100 µl radiolabelled eflornithine in CBSS buffer was added to 0.5 ml Eppendorf tubes. These were centrifuged briefly to remove bubbles. Cells were added to the tubes at room temperature and centrifuged through the oil at 16, 000 RCF for one minute to stop the uptake after various time points. The resulting cell pellet was flash frozen in liquid nitrogen and the base of the tube containing the pellet was cut into 200 µl of 2% SDS in scintillation vials and left for 30 minutes. Three ml of scintillation fluid was added to each vial and these were left overnight at room temperature. Samples were read on a 1450 microbeta liquid scintillation counter (Perkin Elmer).
Southern blot
Southern blots performed according to standard procedures [36]. DNA was digested with Eco RI (Promega), blotted using a hybond-N membrane (Amersham) and probed with Easytides 32P-ATP (Perkin Elmer) incorporated into TbAAT6 using the Stratagene Prime-it kit.
RNA interference
2Ti bloodstream form cells were used to create the RNAi cell line with the pRPaSLi construct [23]. Cells were induced with 1 µg/ml tetracycline for 8 days before calculation of the IC50 value.
Metabolite extraction and analysis
Cultures were kept in log phase growth (below 1×10⁶/ml). Metabolites were extracted from cell cultures simultaneously by two methods.
In method A, cells were centrifuged at 1,250 RCF for 10 minutes and re-suspended in HEPES-free HMI-9 to a density of 1×10⁹ cells/ml. These cells were left to recover in an incubator for 30 minutes before quenching by addition of 80°C ethanol to the cell suspension at a 4∶1 ratio ethanol∶cell suspension. These were left at 80°C for two minutes to allow the cells to lyse and denature any proteins. Extracts were then transferred to ice and left for 5 minutes and vortexed briefly.
In method B, 4×10⁷ cells were rapidly cooled to 4°C by submersion of the flask in a dry ice/ethanol bath, and kept at 4°C for all subsequent steps. The cold cell culture was centrifuged at 1,000 RCF for 10 minutes, supernatant removed, and the pellet washed in 30 mL HEPES-free HMI-9. The washed cells were then centrifuged and the supernatant completely removed. Cell lysis and protein denaturation was achieved by addition of 200 µL of cold chloroform/methanol/water (ratio 1∶3∶1), followed by vigorous mixing for 1 hour at 4°C.
For both methods, extract mixtures were centrifuged for two minutes at 16,000 RCF, 4°C. The supernatant was collected, frozen and stored at −80°C until further analysis.
Samples were analysed on an LTQ Orbitrap mass spectrometer (Thermo Fisher) in positive mode, coupled to HPLC separation using a ZIC-HILIC column (Sequant) according to the method published by Kamleh et al. [37]. Each sample was also analysed on an Exactive orbitrap mass spectrometer (Thermo Fisher) in both positive and negative modes (rapid switching), coupled to HPLC with a ZIC-HILIC column. Exactive data was acquired at 25,000 resolution, with spray voltages +4.5kV and −2.6kV, capillary temperature 275°C, sheath gas 20, aux gas 15 and sweep gas 1 unit. Minor adjustments were made to the published HPLC mobile phase gradient as follows: Solvent A is 0.1% formic acid in water, and solvent B is 0.1% formic acid in acetonitrile, 80% B (0 min), 50% B (12 min), 50% B (26 min), 20% B (28 min), 20% B (36 min), 80% B (37 min), 80% B (47 min).
Metabolite identification and relative quantitation was undertaken using ToxID software (Thermo Fisher), by searching for peaks that correspond to the accurate mass of metabolite ions within a 3 ppm window (or 5 ppm window for Exactive data). The metabolite lists were obtained from trypanosome-specific databases in Trypanocyc (metacyc.org) and KEGG (www.genome.jp/kegg/), lipids were excluded from the data analysis. Metabolite levels are expressed as mean peak height from 3 biological replicates. Multivariate statistical analysis comprised a principal component analysis based on putatively identified metabolites, and significance for individual metabolites was calculated by t-test (α = 0.05).
Cladogram construction
Cladograms were constructed using the CLC genomics workbench software alignment and tree building tools. A neighbour joining algorithm was used and the tree was bootstrapped 1000 times.
Supporting Information
Zdroje
1. BrunR
BlumJ
ChappuisF
BurriC
2010 Human African trypanosomiasis. Lancet 375 148 159
2. BarrettMP
BoykinDW
BrunR
TidwellRR
2007 Human African trypanosomiasis: pharmacological re-engagement with a neglected disease. British Jounal of Pharmacology 152 1155 1171
3. PriottoG
KasparianS
MutomboW
NgouamaD
GhorashianS
2009 Nifurtimox-eflornithine combination therapy for second-stage African Trypanosoma brucei gambiense trypanosomiasis: a multicentre, randomised, phase III, non-inferiority trial. Lancet 374 56 64
4. OpigoJ
WoodrowC
2009 NECT trial: more than a small victory over sleeping sickness. Lancet 374 7 9
5. BacchiCJ
GarofaloJ
MockenhauptD
McCannPP
DiekemaKA
1983 In vivo effects of alpha-DL-difluoromethylornithine on the metabolism and morphology of Trypanosoma brucei brucei. Molecular and Biochemical Parasitology 7 209 225
6. PhillipsMA
CoffinoP
WangCC
1987 Cloning and sequencing of the ornithine decarboxylase gene from Trypanosoma brucei - implications for enzyme turnover and selective difluoromethylornithine inhibition. Journal of Biological Chemistry 262 8721 8727
7. FairlambAH
HendersonGB
BacchiCJ
CeramiA
1987 In vivo effects of difluoromethylornithine on trypanothione and polyamine levels in bloodstream forms of Trypanosoma brucei. Molecular and Biochemical Parasitology 24 185 191
8. YarlettN
BacchiCJ
1988 Effect of dl-alpha-difluoromethylornithine on methionine cycle intermediates in Trypanosoma brucei brucei. Molecular and Biochemical Parasitology 27 1 10
9. XiaoY
McCloskeyDE
PhillipsMA
2009 RNA interference-mediated silencing of ornithine decarboxylase and spermidine synthase genes in Trypanosoma brucei provides insight into regulation of polyamine biosynthesis. Eukaryotic Cell 8 747 755
10. BitontiAJ
BacchiCJ
McCannPP
SjoerdsmaA
1986 Uptake of alpha-difluoromethylornithine by Trypanosoma brucei brucei. Biochemical Pharmacology 35 351 354
11. PhillipsMA
WangCC
1987 A Trypanosoma brucei mutant resistant to alpha-difluoromethylornithine. Molecular and Biochemical Parasitology 22 9 17
12. BellofattoV
FairlambAH
HendersonGB
CrossGA
1987 Biochemical changes associated with alpha-difluoromethylornithine uptake and resistance in Trypanosoma brucei. Molecular and Biochemical Parasitology 25 227 238
13. CarterNS
FairlambAH
1993 Arsenical resistant trypanosomes lack an unusual adenosine transporter. Nature 361 173 176
14. StewartML
KrishnaS
BurchmoreRJ
BrunR
De KoningHP
2005 Detection of arsenical drug resistance in Trypanosoma brucei with a simple fluorescence test. Lancet 366 486 487
15. MatovuE
GeiserF
SchneiderV
MaserP
EnyaruJC
2001 Genetic variants of the TbAT1 adenosine transporter from African trypanosomes in relapse infections following melarsoprol therapy. Molecular and Biochemical Parasitology 117 73 81
16. BarrettMP
FairlambAH
1999 The biochemical basis of arsenical-diamidine crossresistance in African trypanosomes. Parasitology Today 15 136 140
17. SnyderC
CholletJ
Santo-TomasJ
ScheurerC
WittlinS
2007 In vitro and in vivo interaction of synthetic peroxide RBx11160 (OZ277) with piperaquine in Plasmodium models. Experimental Parasitology 115 296 300
18. FarooqU
MahajanRC
2004 Drug resistance in malaria. Journal of Vector Borne Diseases 41 45 53
19. BacchiCJ
1993 Resistance to clinical drugs in African trypanosomes. Parasitol Today 9 190 193
20. BridgesDJ
GouldMK
NerimaB
MaserP
BurchmoreRJS
2007 Loss of the high-affinity pentamidine transporter is responsible for high levels of cross-resistance between arsenical and diamidine drugs in African trypanosomes. Molecular Pharmacology 71 1098 1108
21. LanteriCA
StewartML
BrockJM
AlibuVP
MeshnickSR
2006 Roles for the Trypanosoma brucei P2 transporter in DB75 uptake and resistance. Molecular Pharmacology 70 1585 1592
22. JacksonAP
2007 Origins of amino acid transporter loci in trypanosomatid parasites. BMC Evolutionary Biology 7 26
23. AlsfordS
HornD
2008 Single-locus targeting constructs for reliable regulated RNAi and transgene expression in Trypanosoma brucei. Molecular and Biochemical Parasitology 161 76 79
24. BiebingerS
WirtzLE
LorenzP
ClaytonC
1997 Vectors for inducible expression of toxic gene products in bloodstream and procyclic Trypanosoma brucei. Molecular and Biochemical Parasitology 85 99 112
25. Shaked-MishanP
Suter-GrotemeyerM
Yoel-AlmagorT
HollandN
ZilbersteinD
2006 A novel high-affinity arginine transporter from the human parasitic protozoan Leishmania donovani. Mol Microbiol 60 30 38
26. CanepaGE
SilberAM
BouvierLA
PereiraCA
2004 Biochemical characterization of a low-affinity arginine permease from the parasite Trypanosoma cruzi. FEMS Microbiol Lett 236 79 84
27. HasneMP
UllmanB
2005 Identification and characterization of a polyamine permease from the protozoan parasite Leishmania major. J Biol Chem 280 15188 15194
28. HasneMP
CoppensI
SoysaR
UllmanB
2010 A high-affinity putrescine-cadaverine transporter from Trypanosoma cruzi. Mol Microbiol 76 78 91
29. BacchiCJ
GarofaloJ
CiminelliM
RattendiD
GoldbergB
1993 Resistance to dl-alpha-difluoromethylornithine by clinical isolates of Trypanosoma brucei rhodesiense - role of S-adenosylmethionine. Biochemical Pharmacology 46 471 481
30. BacchiCJ
NathanHC
LivingstonT
ValladaresG
SaricM
1990 Differential susceptibility to dl-alpha-difluoromethylornithine in clinical isolates of Trypanosoma brucei rhodesiense. Antimicrobial Agents and Chemotherapy 34 1183 1188
31. BurkardGS
JutziP
RoditiI
2010 Genome-wide RNAi screens in bloodstream form trypanosomes identify drug transporters. Mol Biochem Parasitol
32. SokolovaAY
WyllieS
PattersonS
OzaSL
ReadKD
2010 Cross-resistance to nitro-drugs and implications for the treatment of human African trypanosomiasis. Antimicrobial Agents and Chemotherapy
33. JanssensPG
De MuynckA
1977 Clinical trials with “nifurtimox” in African trypanosomiasis. Annales de la Société belge de médecine tropicale 57 475 480
34. HirumiH
DoyleJJ
HirumiK
1977 Cultivation of bloodstream Trypanosoma brucei. Bulletin of the World Health Organization 55 405 409
35. RazB
ItenM
Grether-BuhlerY
KaminskyR
BrunR
1997 The Alamar Blue assay to determine drug sensitivity of African trypanosomes (T.b. rhodesiense and T.b. gambiense) in vitro. Acta Tropica 68 139 147
36. SambrookJ
RussellDW
2001 Preparation and Analysis of Eukaryotic Genomic DNA. Molecular cloning New York Cold Spring Harbor Laboratory Press 6.39 6.58
37. KamlehA
BarrettMP
WildridgeD
BurchmoreRJ
ScheltemaRA
2008 Metabolomic profiling using Orbitrap Fourier transform mass spectrometry with hydrophilic interaction chromatography: a method with wide applicability to analysis of biomolecules. Rapid Communications in Mass Spectrometry 22 1912 1918
Štítky
Hygiena a epidemiologie Infekční lékařství LaboratořČlánek vyšel v časopise
PLOS Pathogens
2010 Číslo 11
- Koronavirus hýbe světem: Víte jak se chránit a jak postupovat v případě podezření?
- Parazitičtí červi v terapii Crohnovy choroby a dalších zánětlivých autoimunitních onemocnění
- Vakcíny proti klíšťové encefalitidě
- Kdy je nejlepší očkovat
- Možné vedlejší účinky očkování
Nejčtenější v tomto čísle
- Zn Inhibits Coronavirus and Arterivirus RNA Polymerase Activity and Zinc Ionophores Block the Replication of These Viruses in Cell Culture
- The Female Lower Genital Tract Is a Privileged Compartment with IL-10 Producing Dendritic Cells and Poor Th1 Immunity following Infection
- Crystal Structure and Size-Dependent Neutralization Properties of HK20, a Human Monoclonal Antibody Binding to the Highly Conserved Heptad Repeat 1 of gp41
- The Arabidopsis Resistance-Like Gene Is Activated by Mutations in and Contributes to Resistance to the Bacterial Effector AvrRps4
Zvyšte si kvalifikaci online z pohodlí domova
Mazová zátka a její řešení
nový kurzVšechny kurzy