
All-Cause Mortality of Low Birthweight Infants in Infancy, Childhood, and Adolescence: Population Study of England and Wales
In a population study, Sailesh Kotecha and colleagues investigate associations between birthweight, all-cause, and cause-specific mortality by birthweight in England and Wales.
Published in the journal:
. PLoS Med 13(5): e32767. doi:10.1371/journal.pmed.1002018
Category:
Research Article
doi:
https://doi.org/10.1371/journal.pmed.1002018
Summary
In a population study, Sailesh Kotecha and colleagues investigate associations between birthweight, all-cause, and cause-specific mortality by birthweight in England and Wales.
Introduction
Low birthweight (LBW) (birthweight < 2,500 g) is associated with increased morbidity and mortality in infancy and in adulthood [1–3]. These outcomes have become of greater importance as increasing numbers of extremely LBW and very LBW (VLBW) infants (defined as birthweight < 1,000 g and < 1,500 g, respectively) survive the neonatal period [4,5]. Earlier studies have investigated the relationship between LBW and mortality and morbidity in adulthood [6–8]. Risnes et al. in their systematic review included 15 cohorts with ~40,000 deaths among 400,000 individuals [9]. The cohorts spanned a large range of birth dates and participant ages, although none included children or adolescents. Overall, there was a 6% lower risk of death per kilogramme increase in birthweight. This association was strongest for mortality from cardiovascular disease but weaker for mortality from neoplasms. Class et al., reporting on almost 3.3 million births in Sweden between 1973 and 2007, studied death after the first year of life up to 2012 [10]. They noted 0.73%, 0.44%, 0.35%, and 0.32% mortality in the ≤2,500 g, 2,501–3,000 g, 3,001–3,500 g, and >3,500 g birthweight groups, respectively. Furthermore, LBW was associated with cardiovascular and respiratory disorders, stroke, and type 2 diabetes.
Whilst LBW newborns have increased mortality in the perinatal period and in infancy, it is less clear if there is continuing increased mortality during childhood and adolescence. Due to the increased survival of infants born with extremely LBW (<1,000 g) or VLBW (<1,500 g), longer term outcomes, including morbidity, have become of increasing importance. Our recent data show that both prematurity and fetal growth restriction in term-born infants are associated with later respiratory morbidity [11,12]. However, it is less clear if LBW is associated with increased mortality in childhood and adolescence. Therefore, utilising what we believe to be the largest and most recent cohort to date, we investigated the association between all-cause mortality and birthweight and identified major causes of mortality for different birthweight groups between birth and 18 y of age.
Methods
The study used anonymised data obtained after formal application to the Office for National Statistics (ONS); thus, the authors did not have access to any identifiable data. Data for the All Wales Perinatal Survey are collected after Confidentiality Advisory Group and ethical approvals. Anonymised data for all live births and deaths up to 18 y of age occurring in England and Wales between 1 January 1993 and 31 December 2011 were available (ONS). The data included birthweight (babies are routinely weighed shortly after birth on calibrated scales) and the covariates gender, Index of Multiple Deprivation (IMD) score, maternal age, and singleton/multiple birth, as these have been shown to be associated with increased mortality [13,14]. In addition, the data included age at time of death and cause of death. ONS data for infant deaths were provided already classified into early neonatal, late neonatal, and post-neonatal deaths; beyond infancy, age in completed years at time of death was provided. Gestational age at birth is not routinely recorded for deaths, but was available for the Welsh data. Welsh data were obtained from the All Wales Perinatal Survey (https://awpsonline.uk/), as a separate cohort for the same time period. International Classification of Diseases (ICD) codes (version 9 up to 1999 and version 10 from 2000 onwards) were used to identify cause of death. Birthweights were classified into four groups: 500–1,499 g (VLBW), 1,500–2,499 g (LBW), 2,500–3,499 g, and ≥3,500 g. The latter two groups were merged for some analyses. The IMD, which is based on a combined measure of deprivation including wealth, schooling, and home ownership in a specific area [15], was divided into quintiles separately for England and Wales then combined into a single variable. There were few missing values for the covariates (maximum of 22,061 [0.2%] for the IMD), and these missing values were unlikely to influence the overall conclusions due to the large dataset.
Cox proportional hazards regression was specified as a means of analysing these data through estimation of hazard ratios and their associated 95% confidence intervals for the birthweight groups for infant mortality (death up to 12 mo of age) and child/adolescent mortality (between 1 and 18 y of age, after censoring deaths occurring in infancy). A Cox model was used to quantify differences between survival rates for the birthweight groups with and without adjustments for relevant covariates. The proportional hazards assumption for the birthweight groups was tested in each model by the addition of an appropriate time-dependant covariate—a product of the system time variable called T_ (SPSS notation) and the variable age. All covariates were categorical to permit possible non-linear responses. Mortality rates are also given in person-years.
Inspired by peer review, we additionally considered how utilisation of birthweight as a continuous variable might change the results. We used Welsh infant mortality data, and continuous birthweight was expressed as a five-knot restricted cubic spline to provide a linear component within the Cox regression [16]. The knots were chosen in terms of birthweight at 0.5, 1.5, 2.5, 3.5, and 4.5 kg to approximately mimic the categorical birthweight bandings. A five-knot spline has X (birthweight) and X2, X3, and X4, which are all functions in X. The hazard function within the survival model is then

Also following a request at peer review, we utilised the completeness of the data up to age 10 y—i.e., every child in the cohort either turned 10 y or died—to calculate the population attributable fraction (PAF) for deaths among 1 to 10 y olds [17–19].
Several sensitivity analyses were conducted. Since congenital malformations are associated with increased mortality [20], the analyses were repeated after exclusion of deaths from congenital malformations. Because there was an overall decrease in mortality over the last two decades that could influence the results, we also confined the analyses to the most recent 5-y period. In addition, deaths were classified according to the age bands 1–5, 6–10, and 11–18 y. Finally, to assess the potential role of gestation period, we repeated the analyses for the Welsh data with this covariate included, as gestation period was available for all births and deaths for the study period. For the Welsh data, we also compared the infant mortality rate between infants who had intrauterine growth restriction (<10% centile for birthweight adjusted for gender and gestational age) and those with appropriate birthweight for their gestational age (20%–80% centile) using LMSgrowth (Medical Research Council, UK) as the standard [21]. All analyses were performed using PASW 20 (SPSS).
Results
All-Cause Mortality
The total cohort included 12,457,528 live births in England and Wales between 1 January 1993 and 31 December 2011. Birthweight data were missing for 92,456 individuals, and data for 9,821 individuals were considered implausible or were outside the limits of analyses, including birthweight of <500 g. The characteristics of the included 12,355,251 individuals, representing 121,208,305 person-years, are shown in Table 1. There were 139,608 (1.1% of all live births), 759,283 (6.1%), 6,511,411 (52.7%), and 4,944,949 (40.0%) live births in the 500–1,499 g, 1,500–2,499 g, 2,500–3,499 g, and ≥3,500 g groups, respectively. In total, 74,890 (0.61%) live births died between birth and 18 y of age, with 77% of deaths occurring in the first 12 mo of life and 23% between 1 and 18 y of age. The mortality rate per 100,000 person-years was 466 for infants and 15.9 for children aged between 1 and 18 y. For the four birthweight groups, there were 25,414 (18.20%), 11,945 (1.57%), 25,750 (0.40%), and 11,781 (0.24%) deaths respectively.
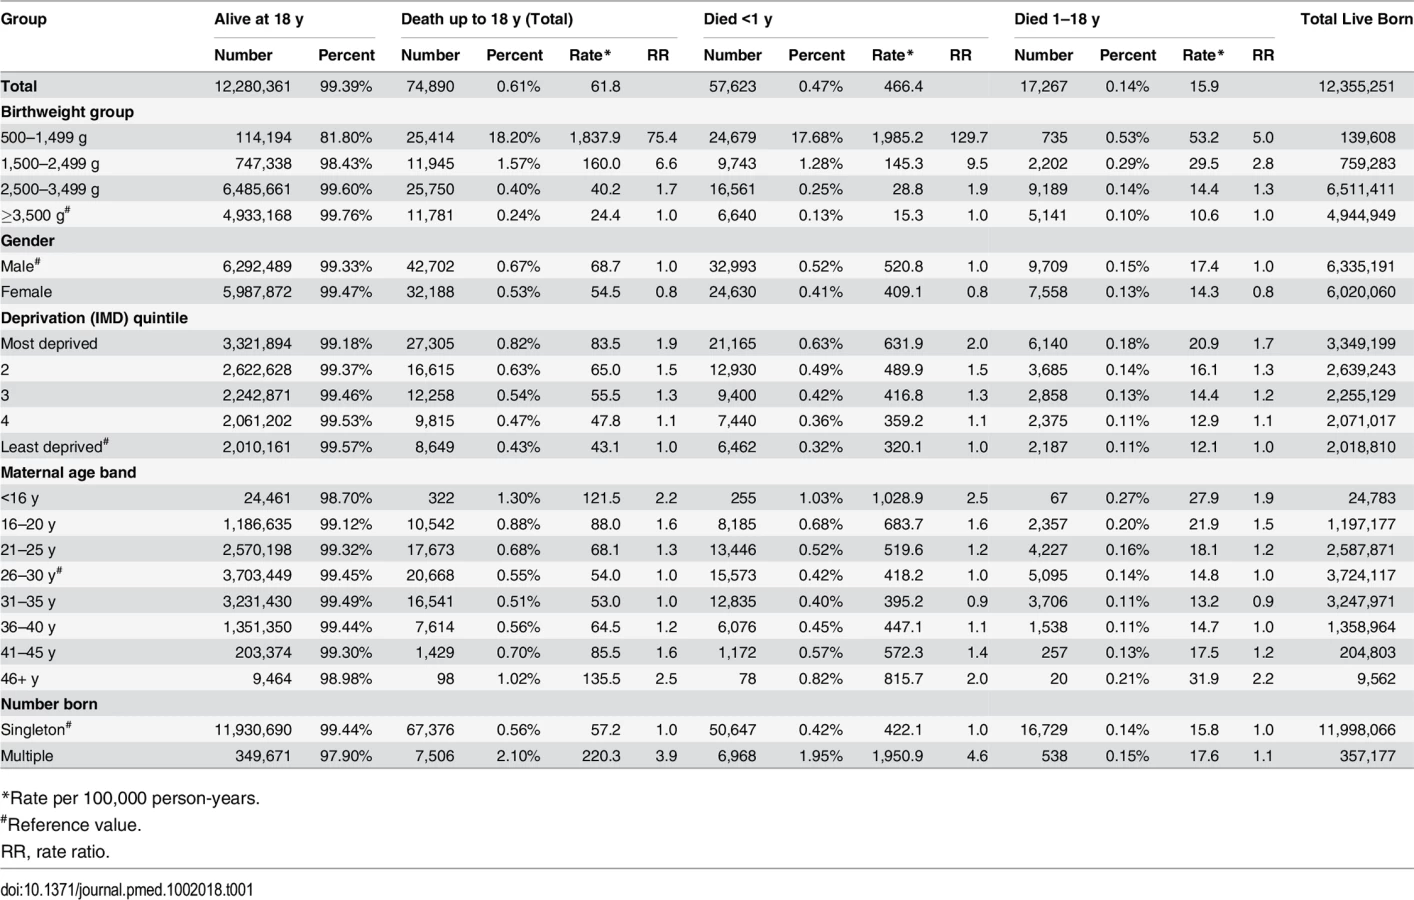
Infant mortality rates were significantly greater in the VLBW and LBW groups: the rate ratio and rate per 100,000 person-years were 129.7 and 1,985.2 for the 500–1,499 g group, 9.5 and 145.3 for the 1,500–2,499 g group, 1.9 and 28.8 for the 2,500–3,499 g group, and 1.0 (reference value) and 15.3 for the ≥3,500 g group, respectively. In addition, boys fared worse than girls (S1 and S2 Figs) even with the exclusion of external conditions (including accidents) as defined by ICD codes. The relative risk ratio of female:male deaths was 0.79 and 0.78 with and without external conditions, respectively, for the <1 y group and 0.82 and 0.87 with and without external conditions, respectively, for the 1–18 y group. Increased deprivation and multiple births were associated with more deaths in all birthweight groups. Maternal age showed a U-shaped relationship, with the greatest mortality in children born to the youngest and oldest mothers (Table 1). The PAF for infant deaths and for deaths between 1 and 10 y of age was 56.6% and 10.7%, respectively, for the comparison between the 500–1,499 g and 1,500–2,499 g groups combined and the ≥2,500 g groups (2,500–3,499 g and ≥3,500 g groups combined), and 51.0% and 3.8%, respectively, when the <1,500 g group and ≥2,500 g groups were compared.
For deaths occurring between 1 and 18 y of age, the rates per 100,000 person-years were 53.2, 29.5, 14.4, and 10.6, respectively, for the 500–1,499 g, 1,500–2,499 g, 2,500–2,499 g, and ≥3,500 g groups. The rate ratios were 5.0, 2.8, and 1.3 for the first three groups, respectively, compared to the ≥3,500 g group. Gender, deprivation, and maternal age bands showed similar patterns as for infant deaths, but the difference between singleton and multiple births was decreased.
Figs 1 and 2 show survival curves for the four birthweight groups in infancy and between 1 and 18 y of age (after censoring of deaths occurring in infancy). In addition to confirming the association of LBW and increased mortality in infancy, the results show that mortality rates were also increased for the lower birthweight groups in childhood/adolescence. Table 2 shows hazard ratios adjusted for deprivation alone and for deprivation, maternal age, multiple birth status, and gender. An inverse relationship was noted between the birthweight groups and mortality, which was largely unaffected after adjustments for covariates.


When Welsh infant mortality data were investigated utilising birthweight splines, we utilised the spline function

The coefficients β2, β3, and β4 were not significant (S9 Table), which implies that the log of the hazard function λ is basically linear in birth weight (see S3 Fig). The actual expression is

When the hazard ratios were calculated at the midpoints between the knots, the values were very close to those noted following Cox regression of the Welsh data using the categorical definitions (see S10 Table).
Cause-Specific Mortality
Fig 3 shows grouped causes of infant death for each birthweight group, with the ≥2,500 g groups combined. In all, 84% of deaths in the <1,500 g group were related to perinatal events, especially prematurity. For the 1,500–2,499 g group, perinatal events were responsible for 31% of deaths, with congenital anomalies explaining 36% of deaths. Perinatal and congenital anomalies explained approximately half of the deaths in the ≥2,500 g groups. Further breakdown of the most prevalent causes of infant deaths is shown in Table 3. Prematurity and hypoxic conditions explained most of the perinatal deaths, and circulatory conditions explained a large number of deaths from congenital anomalies, but with significant contributions related to respiratory, central nervous system, and chromosomal abnormalities. Conditions related to prematurity within perinatal deaths were 1,890 and 10.4 more likely in the VLBW and LBW groups, respectively, compared to the ≥2,500 g groups. For congenital anomalies, there was a 28-fold greater risk of dying in the <1,500 g group and a nearly 10-fold greater risk in the 1,500–2,499 group compared to the ≥2,500 groups.


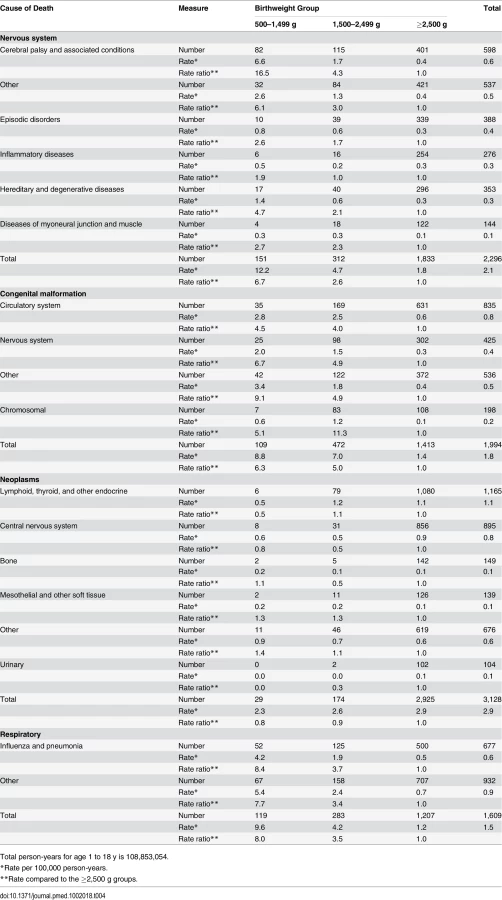
Fig 4 shows grouped causes of death between 1 and 18 y by birthweight group. The causes of death were more diverse, but perinatal causes remained significant in the <1,500 g group and congenital anomalies in the 500–1,499 g and 1,500–2,499 g groups, but less so for the ≥2,500 g groups. Further breakdown of the most prevalent causes of death is shown in Table 4, where conditions associated with the nervous system, particularly cerebral palsy, were prevalent, with a rate ratio for cerebral palsy of 16.5 and 4.3 for the VLBW and LBW groups, respectively, compared to the ≥2,500 g groups. Overall, individuals in the VLBW and LBW groups were 6.3 and 5.0 times more likely to die from congenital anomalies than individuals in the ≥2,500 g groups. Respiratory conditions were responsible for more deaths in the two lower birthweight groups, particularly from influenza/pneumonia, where the rate ratios were 8.4 and 3.7, respectively, compared to the ≥2,500 g groups. Neoplasms were the most common cause of death in the ≥2,500 g groups, explaining 20% of deaths. External conditions including accidents explained 18% of deaths for all birthweight groups; however, an increasing prevalence was observed with increasing birthweight, i.e., 6% of deaths in the 500–1,499 g group increasing to almost 20% in the ≥2,500 g group (Fig 4).

Sensitivity Analyses
Congenital malformations
Results were only slightly different when congenital malformations were removed (S1 and S2 Tables).
Gestational age
Gestational age was available for all Welsh live births via the All Wales Perinatal Survey (https://awpsonline.uk/). For the study period, there were 635,428 live births and 3,836 deaths between birth and 18 y of age for individuals with birthweight above 500 g. For the VLBW group, the median gestation period was 29 wk (10th and 90th percentiles at 25 and 33 wk). Corresponding data for the LBW, 2,500–3,499 g, and ≥3,500 g groups were 36 (32, 39), 39 (37, 41), and 40 (39, 41) wk, respectively. S3 Table shows the Cox regression results for the two age groups, which were very similar to the overall results. For all gestational age groups, there was an increased risk of death in infancy if the infant had intrauterine growth restriction, compared to appropriately grown infants (S4 Table), although the difference was not significant for the 23–28 wk gestation group.
Temporal effects on mortality
The time-varying covariate was significant in all regression models, suggesting that hazard ratios may be temporally affected. The effect of adjustment for the time-varying covariate only slightly increased the hazard ratios (S5 Table). When the data were classified into shorter time periods (1993–1996, 1997–2001, 2002–2006, and 2007–2011), the results remained essentially unchanged, with small increases for each time period (S6 and S7 Tables). When deaths at age 1–18 y were divided into age groups, younger groups had greater mortality (hazard ratio of 8.0 for 1–5 y olds, 4.2 for 6–10 y olds, and 2.7 for 11–18 y olds) (S8 Table).
Discussion
This population-based study included data from 12,457,528 live births occurring in England and Wales between 1993 and 2011. Overall, 0.61% (n = 74,890) died, with 23% of all deaths occurring at 1–18 y of age. Mortality was greater in the two lower birthweight groups than in the two heavier birthweight groups in infancy and between 1–18 y of age, with little modification by covariates. Adjusted hazard ratios for death in infancy were 145 (95% CI 141, 149) and 9.8 (95% CI 9.5, 10.1) for the VLBW and LBW groups, respectively, compared to the ≥3,500 g group, and 6.6 (95% CI 6.1, 7.1) and 2.9 (95% CI 2.8, 3.1) for these birthweight groups for deaths at 1–18 y of age. Gender, maternal age, multiple births, and deprivation also contributed to increased deaths in the two lower birthweight groups. Deaths related to perinatal factors and congenital malformations, especially from cardiovascular causes, were predominant in the two lower birthweight groups in infancy and later in childhood and adolescence.
Increased infant mortality rate has been reported previously for lower birthweight groups [9,22–26]. Horbar et al. reported an infant death rate of 12.4% for the 501–1,500 g birthweight group—compared to 17.7% for the 500–1,499 g group our study—for 669 American hospitals in 2009; the data are not directly comparable as they defined infant mortality as death occurring prior to hospital discharge [27]. Doyle et al. reported that 66.9% of live-born individuals with a birthweight of 500–999 g survived to 2 y of age excluding those with congenital anomalies; when we calculated the same outcome for our data, the result was remarkably similar, at 63.1% [4]. Mortality after infancy in our <2,500 g groups is lower than Class and colleagues’ report of 0.73% mortality in their ≤2,500 g group, most likely due to their follow-up to up to 34 y of age [10]. Of note is the systematic review by Risnes et al., who reported a 6% lower risk of death for every kilogramme increase in birthweight [9].
Power and Li, using a cohort of ~17,000 individuals born in 1958 in Britain, showed an inverse relationship between birthweight and infant mortality but not for deaths occurring >1 y of age [22]. Friedlander et al., in a larger cohort of 92,408 births in Jerusalem between 1964 and 1976, noted a strong relationship between LBW and death before 1 y of age but not between LBW and death at 1–15 y of age [23]. Horta et al. studied 5,914 Brazilian children born in 1982 for over 20 y, noting a significant relationship between LBW and mortality up to 4 y of age but not beyond [28]. Kajantie et al. studied 13,830 individuals born between 1924 and 1944 in Finland, following them from 1971 to a mean age of 56 y. They noted a positive relationship between LBW and all-cause mortality at all ages for women but not for men, for whom only infant mortality was associated with LBW [24]. Many of these studies were constrained by the limited numbers of deaths that occurred, especially beyond infancy.
Furthermore, many of these studies were conducted on populations several decades ago, focusing on the consequences of LBW for adulthood morbidity and mortality. Overall survival rates have improved, especially for infants born with birthweight ≤ 1,500 g, and, more recently, for those with birthweight ≤ 1,000 g; our data, up to 2011, are more recent. By reporting mortality rate data as both hazard ratios and person-years, we have taken into account that children born recently will not have reached the age of 18 y during the study period. Our data show that mortality is increased markedly in the lower birthweight groups compared to the heavier birthweight groups beyond infancy. Even in sensitivity analyses, the conclusions remain robust. Males fared worse in both infancy and beyond. The mechanisms for this gender difference remain unclear. Deprivation, multiple births, and maternal age have previously been shown to be associated with increased mortality in infants, but we confirm their importance for increased mortality also in childhood and adolescence [29–32].
Perinatal causes accounted for 52% of all deaths in infancy but accounted for 84% of deaths in the VLBW group. Perhaps unsurprisingly, prematurity predominated as the cause of death in this group, but of note is the fact that hypoxic/anoxic causes were responsible for a significant number of deaths. Whilst there have been great improvements in maternal and neonatal outcomes over the last two decades, these data suggest that targeting upstream risk factors for LBW remains an important health goal. Congenital malformations were also important causes of infant death, especially in the LBW group and the ≥2,500 g groups, explaining 36% and 23% of deaths, respectively. Whilst congenital heart defects were responsible for a large number of the deaths among those who died due to congenital malformation, disorders of the respiratory and central nervous system and chromosomal afflictions resulted in significant mortality.
For the 1–18 y age group, the causes of death were more diverse, although perinatal causes (precise causes were not recorded) were responsible for 13% of deaths in the VLBW group, and congenital malformations for 10%–21% of deaths in all birthweight groups. Neoplasms and accidents (external conditions) were important causes of death in the ≥2,500 g groups. This concurs with the findings presented in Syddall et al., who noted an increase in neoplasms with increasing birthweight, although their cohort covered a much wider age group (up to age 88 y) than ours [33]. Similar data were also reported by Sidebotham et al. [34,35]. Rates of respiratory causes of death were similar between the groups. Hazard ratios were greater for almost all causes of death (except neoplasms and external causes) in the VLBW and LBW groups compared to the ≥2,500 g groups, thus suggesting that LBW has consequences well beyond early childhood and that preventing LBW remains an important heath target. Whilst our aim was to establish whether there is continuing mortality after low weight at birth and, if so, the underlying causes for the increased mortality, it is clearly important to establish which upstream casual factors such as tobacco smoke and deprivation lead to delivery of LBW infants. Medical factors may also contribute to earlier delivery, resulting in LBW infants; thus, caution is required not to interpret LBW as being necessarily on the causal pathway to later mortality. Furthermore, additional information is also required, as many deaths in the VLBW and LBW groups were reported as being due to prematurity. In our study, maternal age, multiple births, and deprivation all appeared to be associated with increased later mortality associated with LBW, thus providing additional interventional targets to improve mortality related to LBW. Although we did not have information on antenatal maternal smoking exposure, it has been shown to be associated with LBW and clearly provides another target for intervention [36]. In addition, infant deaths were increased in growth-restricted infants compared to appropriately grown infants (S4 Table). Clearly, any factor—including maternal, fetal, and placental factors and also medical interventions—leading to growth-restricted infants at birth is associated with adverse longer term outcomes and provides an opportunity to investigate the upstream casual factors resulting in LBW.
Crump et al. concluded from analyses of 674,820 births in Sweden from 1973 to 1979 that cause-specific mortality was significantly related to gestational age at birth in their 1–5 y age group but not for older age groups, although the latter conclusion may be due to limited numbers of deaths [37]. It has been suggested that relating mortality outcomes to gestational age may be preferable to relating them to birthweight as gestational age reflects the maturity of the infant at birth. Whilst this may be true, we believe that our results are equally valid, especially as birthweight was highly correlated with gestational age, as shown by analyses of the Welsh births, for which both gestational age and birthweight were available. The analyses of these 639,294 live births robustly supported our overall conclusions. Importantly, by investigating the association of birthweight with mortality, we have identified three important areas that need special attention: preterm labour, anoxic/hypoxic conditions of the newborn, and congenital malformations. As major congenital malformations are associated with increased mortality, we conducted sensitivity analyses excluding individuals with these conditions, but the relationship between lower birthweight and mortality remained unchanged.
Survival rates improved over the 19-y study period; thus, we conducted another sensitivity analysis investigating death up to 5 y of age for the most recent 5-y period. The association of VLBW and LBW with later mortality remained, thus suggesting that the overall findings remain robust. We also report the PAF for both infant and post-infant mortality, showing that this fraction, unsurprisingly, is greatest in infancy, but for infants born at <2,500 g, it is nearly 11% for deaths occurring between 1 and 10 y of age. This implies that 11% of deaths between 1 and 10 y of age could be prevented by eliminating LBW.
The major strengths of this study and the reason why it is a relevant addition to the literature in this area are the inclusion of >12 million births and 74,890 deaths and the availability of relevant and recent data up to the age of 18 y. We were also able to identify the underlying causes of death. We had few missing data for the covariates we included, but we did not have data on gestational age or maternal smoking. Since the former is highly correlated with birthweight and the latter with deprivation, we believe that our findings remain robust despite these shortcomings. Additionally, by also treating birthweight as a continuous variable for the Welsh data, we were able to show that there was no disadvantage in using banded, as opposed to continuous, birthweight data.
In conclusion, using what we believe to be the largest and most recent population-based cohort that has been used to investigate this area, we have shown that VLBW and LBW are associated with mortality in infancy and in childhood/adolescence. Major causes of death include perinatal and congenital malformations in infancy, which continue to explain many deaths that occur up to 18 y of age. LBW is clearly associated with later mortality in childhood and adolescence. By understanding and ameliorating the influences of upstream exposures such maternal smoking and deprivation, later mortality can be decreased by reducing the delivery of vulnerable infants with LBW.
Supporting Information
Zdroje
1. Barker DJ (1990) The fetal and infant origins of adult disease. BMJ 301 : 1111. 2252919
2. Barker DJ, Meade TW, Fall CH, Lee A, Osmond C, et al. (1992) Relation of fetal and infant growth to plasma fibrinogen and factor VII concentrations in adult life. BMJ 304 : 148–152. 1737158
3. Barker DJ, Gluckman PD, Godfrey KM, Harding JE, Owens JA, et al. (1993) Fetal nutrition and cardiovascular disease in adult life. Lancet 341 : 938–941. 8096277
4. Doyle LW, Roberts G, Anderson PJ (2011) Changing long-term outcomes for infants 500–999 g birth weight in Victoria, 1979–2005. Arch Dis Child Fetal Neonatal Ed 96: F443–F447. doi: 10.1136/adc.2010.200576 21393312
5. Saigal S, Doyle LW (2008) An overview of mortality and sequelae of preterm birth from infancy to adulthood. Lancet 371 : 261–269. doi: 10.1016/S0140-6736(08)60136-1 18207020
6. Greenough A (2009) Does low birth weight confer a lifelong respiratory disadvantage? Am J Respir Crit Care Med 180 : 107–108. doi: 10.1164/rccm.200904-0643ED 19578139
7. Pilgaard K, Faerch K, Carstensen B, Poulsen P, Pisinger C, et al. (2010) Low birthweight and premature birth are both associated with type 2 diabetes in a random sample of middle-aged Danes. Diabetologia 53 : 2526–2530. doi: 10.1007/s00125-010-1917-3 20859612
8. Hack M, Schluchter M, Cartar L, Rahman M (2005) Blood pressure among very low birth weight (<1.5 kg) young adults. Pediatr Res 58 : 677–684. 16192252
9. Risnes KR, Vatten LJ, Baker JL, Jameson K, Sovio U, et al. (2011) Birthweight and mortality in adulthood: a systematic review and meta-analysis. Int J Epidemiol 40 : 647–661. doi: 10.1093/ije/dyq267 21324938
10. Class QA, Rickert ME, Lichtenstein P, D’Onofrio BM (2014) Birth weight, physical morbidity, and mortality: a population-based sibling-comparison study. Am J Epidemiol 179 : 550–558. doi: 10.1093/aje/kwt304 24355331
11. Kotecha SJ, Watkins WJ, Paranjothy S, Dunstan FD, Henderson AJ, et al. (2012) Effect of late preterm birth on longitudinal lung spirometry in school age children and adolescents. Thorax 67 : 54–61. doi: 10.1136/thoraxjnl-2011-200329 21953066
12. Kotecha SJ, Watkins WJ, Heron J, Henderson J, Dunstan FD, et al. (2010) Spirometric lung function in school-age children: effect of intrauterine growth retardation and catch-up growth. Am J Respir Crit Care Med 181 : 969–974. doi: 10.1164/rccm.200906-0897OC 20093643
13. Dubois L, Girard M (2006) Determinants of birthweight inequalities: population-based study. Pediatr Int 48 : 470–478. 16970785
14. Bonellie SR (2001) Effect of maternal age, smoking and deprivation on birthweight. Paediatr Perinat Epidemiol 15 : 19–26. 11237109
15. Office for National Statistics. UK indices of multiple deprivation—a way to make comparisons across constituent countries easier. Available: http://www.ons.gov.uk/ons/rel/hsq/health-statistics-quarterly/no—53—spring-2012/uk-indices-of-multiple-deprivation.html. Accessed 1 March 2016.
16. Harrell FEJ (2015) Regression modeling strategies with applications to linear models, logistic and ordinal regression, and survival analysis. Switzerland: Springer.
17. Laaksonen M, Härkänen T, Knekt P, Virtala E, Oja H (2010) Estimation of population attributable fraction (PAF) for disease occurrence in a cohort study design. Stat Med 29 : 860–874. doi: 10.1002/sim.3792 20213711
18. Katanoda K, Marugame T, Saika K, Satoh H, Tajima K, et al. (2008) Population attributable fraction of mortality associated with tobacco smoking in Japan: a pooled analysis of three large-scale cohort studies. J Epidemiol 18 : 251–264. 19075498
19. Rockhill B, Newman B, Weinberg C (1998) Use and misuse of population attributable fractions. Am J Public Health 88 : 15–19. 9584027
20. Tennant PW, Pearce MS, Bythell M, Rankin J (2010) 20-year survival of children born with congenital anomalies: a population-based study. Lancet 375 : 649–656. doi: 10.1016/S0140-6736(09)61922-X 20092884
21. H Pan, Cole T (2012) LMSgrowth, version 2.77. Available: http://www.healthforallchildren.com/shop-base/shop/software/lmsgrowth/. Accessed 5 April 2016.
22. Power C, Li L (2000) Cohort study of birthweight, mortality, and disability. BMJ 320 : 840–841. 10731178
23. Friedlander Y, Paltiel O, Deutsch L, Knaanie A, Massalha S, et al. (2003) Birthweight and relationship with infant, child and adult mortality in the Jerusalem perinatal study. Paediatr Perinat Epidemiol 17 : 398–406. 14629323
24. Kajantie E, Osmond C, Barker DJ, Forsen T, Phillips DI, et al. (2005) Size at birth as a predictor of mortality in adulthood: a follow-up of 350 000 person-years. Int J Epidemiol 34 : 655–663. 15764690
25. Lau C, Ambalavanan N, Chakraborty H, Wingate MS, Carlo WA (2013) Extremely low birth weight and infant mortality rates in the United States. Pediatrics 131 : 855–860. doi: 10.1542/peds.2012-2471 23545381
26. Lemons JA, Bauer CR, Oh W, Korones SB, Papile LA, et al. (2001) Very low birth weight outcomes of the National Institute of Child Health and Human Development Neonatal Research Network, January 1995 through December 1996. NICHD Neonatal Research Network. Pediatrics 107: E1. 11134465
27. Horbar JD, Carpenter JH, Badger GJ, Kenny MJ, Soll RF, et al. (2012) Mortality and neonatal morbidity among infants 501 to 1500 grams from 2000 to 2009. Pediatrics 129 : 1019–1026. doi: 10.1542/peds.2011-3028 22614775
28. Horta BL, Gigante DP, Candiota JS, Barros FC, Victora CG (2008) [Monitoring mortality in Pelotas birth cohort from 1982 to 2006, Southern Brazil.] Rev Saude Publica 42 (Suppl 2): 108–114. 19142352
29. Smith LK, Draper ES, Manktelow BN, Field DJ (2009) Socioeconomic inequalities in survival and provision of neonatal care: population based study of very preterm infants. BMJ 339: b4702. doi: 10.1136/bmj.b4702 19952036
30. Singh GK, Kogan MD (2007) Persistent socioeconomic disparities in infant, neonatal, and postneonatal mortality rates in the United States, 1969–2001. Pediatrics 119: e928–e939. 17403832
31. Luke B, Brown MB (2007) Elevated risks of pregnancy complications and adverse outcomes with increasing maternal age. Hum Reprod 22 : 1264–1272. 17289684
32. Glinianaia SV, Obeysekera MA, Sturgiss S, Bell R (2011) Stillbirth and neonatal mortality in monochorionic and dichorionic twins: a population-based study. Hum Reprod 26 : 2549–2557. doi: 10.1093/humrep/der213 21727159
33. Syddall HE, Sayer AA, Simmonds SJ, Osmond C, Cox V, et al. (2005) Birth weight, infant weight gain, and cause-specific mortality: the Hertfordshire Cohort Study. Am J Epidemiol 161 : 1074–1080. 15901628
34. Sidebotham P, Fraser J, Fleming P, Ward-Platt M, Hain R (2014) Patterns of child death in England and Wales. Lancet 384 : 904–914. doi: 10.1016/S0140-6736(13)61090-9 25209490
35. Sidebotham P, Fraser J, Covington T, Freemantle J, Petrou S, et al. (2014) Understanding why children die in high-income countries. Lancet 384 : 915–927. doi: 10.1016/S0140-6736(14)60581-X 25209491
36. Robinson JS, Moore VM, Owens JA, McMillen IC (2000) Origins of fetal growth restriction. Eur J Obstet Gynecol Reprod Biol 92 : 13–19. 10986429
37. Crump C, Sundquist K, Sundquist J, Winkleby MA (2011) Gestational age at birth and mortality in young adulthood. JAMA 306 : 1233–1240. doi: 10.1001/jama.2011.1331 21934056
Štítky
Interní lékařstvíČlánek vyšel v časopise
PLOS Medicine
2016 Číslo 5
- Ivabradin zlepšuje kvalitu života starších pacientů se srdečním selháním
- Fixní kombinace kandesartan/amlodipin v terapii arteriální hypertenze
- Inovace v hojení ran: krytí Zetuvit Plus Silicone Border pro optimální management exsudátu z ran
- Rána vizitkou (nejen) chirurga
- Patogeneze vzniku keloidní jizvy
Nejčtenější v tomto čísle
- Estimating the Risk of Chronic Pain: Development and Validation of a Prognostic Model (PICKUP) for Patients with Acute Low Back Pain
- Prioritizing Surgical Care on National Health Agendas: A Qualitative Case Study of Papua New Guinea, Uganda, and Sierra Leone
- A Revolution in Treatment for Hepatitis C Infection: Mitigating the Budgetary Impact
- Toward a Common Secure Future: Four Global Commissions in the Wake of Ebola
Zvyšte si kvalifikaci online z pohodlí domova
Mazová zátka a její řešení
nový kurzVšechny kurzy