
Long-Term Risk of Incident Type 2 Diabetes and Measures of Overall and Regional Obesity: The EPIC-InterAct Case-Cohort Study
Background:
Waist circumference (WC) is a simple and reliable measure of fat distribution that may add to the prediction of type 2 diabetes (T2D), but previous studies have been too small to reliably quantify the relative and absolute risk of future diabetes by WC at different levels of body mass index (BMI).
Methods and Findings:
The prospective InterAct case-cohort study was conducted in 26 centres in eight European countries and consists of 12,403 incident T2D cases and a stratified subcohort of 16,154 individuals from a total cohort of 340,234 participants with 3.99 million person-years of follow-up. We used Prentice-weighted Cox regression and random effects meta-analysis methods to estimate hazard ratios for T2D. Kaplan-Meier estimates of the cumulative incidence of T2D were calculated. BMI and WC were each independently associated with T2D, with WC being a stronger risk factor in women than in men. Risk increased across groups defined by BMI and WC; compared to low normal weight individuals (BMI 18.5–22.4 kg/m2) with a low WC (<94/80 cm in men/women), the hazard ratio of T2D was 22.0 (95% confidence interval 14.3; 33.8) in men and 31.8 (25.2; 40.2) in women with grade 2 obesity (BMI≥35 kg/m2) and a high WC (>102/88 cm). Among the large group of overweight individuals, WC measurement was highly informative and facilitated the identification of a subgroup of overweight people with high WC whose 10-y T2D cumulative incidence (men, 70 per 1,000 person-years; women, 44 per 1,000 person-years) was comparable to that of the obese group (50–103 per 1,000 person-years in men and 28–74 per 1,000 person-years in women).
Conclusions:
WC is independently and strongly associated with T2D, particularly in women, and should be more widely measured for risk stratification. If targeted measurement is necessary for reasons of resource scarcity, measuring WC in overweight individuals may be an effective strategy, since it identifies a high-risk subgroup of individuals who could benefit from individualised preventive action.
: Please see later in the article for the Editors' Summary
Published in the journal:
. PLoS Med 9(6): e32767. doi:10.1371/journal.pmed.1001230
Category:
Research Article
doi:
https://doi.org/10.1371/journal.pmed.1001230
Summary
Background:
Waist circumference (WC) is a simple and reliable measure of fat distribution that may add to the prediction of type 2 diabetes (T2D), but previous studies have been too small to reliably quantify the relative and absolute risk of future diabetes by WC at different levels of body mass index (BMI).
Methods and Findings:
The prospective InterAct case-cohort study was conducted in 26 centres in eight European countries and consists of 12,403 incident T2D cases and a stratified subcohort of 16,154 individuals from a total cohort of 340,234 participants with 3.99 million person-years of follow-up. We used Prentice-weighted Cox regression and random effects meta-analysis methods to estimate hazard ratios for T2D. Kaplan-Meier estimates of the cumulative incidence of T2D were calculated. BMI and WC were each independently associated with T2D, with WC being a stronger risk factor in women than in men. Risk increased across groups defined by BMI and WC; compared to low normal weight individuals (BMI 18.5–22.4 kg/m2) with a low WC (<94/80 cm in men/women), the hazard ratio of T2D was 22.0 (95% confidence interval 14.3; 33.8) in men and 31.8 (25.2; 40.2) in women with grade 2 obesity (BMI≥35 kg/m2) and a high WC (>102/88 cm). Among the large group of overweight individuals, WC measurement was highly informative and facilitated the identification of a subgroup of overweight people with high WC whose 10-y T2D cumulative incidence (men, 70 per 1,000 person-years; women, 44 per 1,000 person-years) was comparable to that of the obese group (50–103 per 1,000 person-years in men and 28–74 per 1,000 person-years in women).
Conclusions:
WC is independently and strongly associated with T2D, particularly in women, and should be more widely measured for risk stratification. If targeted measurement is necessary for reasons of resource scarcity, measuring WC in overweight individuals may be an effective strategy, since it identifies a high-risk subgroup of individuals who could benefit from individualised preventive action.
: Please see later in the article for the Editors' Summary
Introduction
A higher body mass index (BMI) is a strong predictor of type 2 diabetes (T2D), with a linear increase in diabetes risk across the whole spectrum of BMI [1]. Although diabetes risk is highest in obese people with BMI≥30 kg/m2, a great proportion of future cases comes from the large population of overweight individuals with a BMI between 25 and 30 kg/m2 [2]. Recent national figures from the US and UK suggest that at least a third of the population is now overweight and another third (24% UK) is obese [3],[4], with severe implications for the future burden of diabetes.
The Diabetes Prevention Program has shown that individual-level lifestyle intervention can reduce the incidence of diabetes by over 50% in high-risk individuals [5], an effect that persists for at least 10 y [6]. Current clinical practice generally relies on measurement of BMI to identify individuals at increased risk of diabetes and other adiposity-related morbidity and mortality. However, due to their high prevalence, it is financially and logistically difficult to test and intervene on all overweight and obese individuals.
BMI provides no information about body fat distribution, which distinguishes the large amount of adipose tissue located subcutaneously from the smaller amount of intra-abdominal visceral fat, known to predict the development of diabetes over and above BMI [2],[7],[8]. Waist circumference (WC) is a simple measure that can be used to diagnose abdominal obesity and identify individuals at increased risk of T2D [9]. Information about WC is therefore likely to be useful in distinguishing high - and low-risk individuals at different levels of BMI, which is important for targeting those at highest absolute risk for individually focused lifestyle intervention to prevent T2D.
However, WC is not routinely assessed in clinical practice for a range of reasons [10]. Although measurement is relatively simple and cheap, it does require some training and standardisation, and this has been cited as one reason for its limited use. Another explanation is that practitioners do not appreciate the relevance of the additional information that is derived from measuring WC over and above BMI [10]. This may be because earlier studies were generally too small to estimate T2D incidence rates at different levels of BMI and WC with the precision required to guide clinical decision making or inform policy recommendations. In addition, men and women differ in the distribution of their overall and abdominal body fat, but only large-scale studies including men and women are adequately powered to investigate sex differences in associations of BMI and WC with T2D with confidence.
We use data from the European InterAct study, a case-cohort study of 12,403 cases of incident T2D and a subcohort of 16,154 participants, conducted in 26 centres in eight European countries to estimate the relative and cumulative risk of diabetes at different levels of BMI and WC, separately in men and women.
Methods
Population
The design and methods of the InterAct case-cohort study have previously been described in detail [11]. InterAct Consortium partners identified individuals with T2D in European Prospective Investigation into Cancer and Nutrition (EPIC) cohorts between 1991 and 2007 from eight of the ten countries participating in EPIC (26 centres). Prevalent diabetes was identified on the basis of baseline self-report of a history of diabetes, doctor-diagnosed diabetes, diabetes drug use, or evidence of diabetes after baseline with a date of diagnosis earlier than the baseline recruitment date. All ascertained cases with any evidence of diabetes at baseline were excluded. Ascertainment of incident T2D involved a review of the existing EPIC datasets at each centre using multiple sources of evidence including self-report, linkage to primary-care registers, secondary-care registers, medication use (drug registers), hospital admissions and mortality data. Information from any follow-up visit or external evidence with a date later than the baseline visit was used. To increase the specificity of the case definition, we sought further evidence for all cases with information on incident T2D from fewer than two independent sources at a minimum, which included individual medical records review in some centres. Cases in Denmark and Sweden were not ascertained by self-report, but identified via local and national diabetes and pharmaceutical registers, and hence all ascertained cases were considered to be verified. Follow-up was censored at the date of diagnosis, 31 December 2007, or the date of death, whichever occurred first. A total of 340,234 participants of European descent were followed up for 3.99 million person-years (mean [range] of follow-up 11.7 [0–17.5] y), during which 12,403 verified incident cases of T2D were identified [11]. Individuals without stored blood (n = 109,625) or without reported diabetes status (n = 5,821) were excluded. A centre-stratified, random subcohort of 16,835 individuals was selected; after exclusion of 548 individuals with prevalent diabetes and 133 with unknown diabetes status, the subcohort included 16,154 individuals for analysis. Due to the random selection, this subcohort also included a random set of 778 individuals who had developed incident T2D during follow-up. Participants in the random subcohort were similar to all EPIC participants eligible for inclusion in InterAct [11]. InterAct cases were followed-up for a mean (standard deviation [SD]) of 6.9 (3.3) y; 49.8% were men. The overall incidence in InterAct was 3.8 per 1,000 person-years of follow-up; country-specific rates are included in the InterAct cohort description [11].
Measurements
Weight and height were measured with participants not wearing shoes and in light clothing or underwear in the majority of centres, as described previously [12]. WC was measured either at the narrowest circumference of the torso or at the midpoint between the lower ribs and the iliac crest. Hip circumference was measured horizontally at the level of the largest lateral extension of the hips or over the buttocks. For a subset of the Oxford (UK) participants (n = 363), only self-reported waist and hip circumferences were available. Each participant's body weight and waist and hip circumferences were corrected for the clothing worn during measurement in order to reduce heterogeneity due to protocol differences among centres [13]. Correction included adjustment for self-reporting in Oxford participants using a prediction equation based on a comparison of self-reported and measured data in a sample of 5,000 of the Oxford general population [12],[14]. BMI was calculated as weight (in kilograms)/height (in metres) squared. Waist-hip ratio was calculated and expressed as a percentage. Measures of waist or hip circumference were not performed at the centre in Umea, Sweden (n = 1,845), and were missing in an additional 173 and 193 InterAct participants for waist and hip, respectively.
As part of EPIC, standardised information on education and smoking status was collected by questionnaire at baseline [15]. Physical activity was assessed using a brief questionnaire covering occupation and recreational activity [16],[17].
Statistical Analysis
Characteristics of the subcohort are described using summary statistics (means, SDs, frequencies, and percentages) separately for men and women. Associations between anthropometric variables and the hazard of diabetes were estimated using Prentice-weighted Cox regression models with age as the underlying time scale, separately within each centre and then combined across centres using random effects meta-analysis [11]. We calculated internally derived sex-specific standardised scores based on means and SDs within the subcohort for each anthropometric measure. We divided study participants into normal weight (BMI 18.5–24.9 kg/m2), overweight (25.0–29.9 kg/m2), or obese (≥30 kg/m2) based on current World Health Organization criteria [18], and used sex-specific cut-offs to define WC as normal (<94 cm [<34.6 inches] in men and <80 cm [31.5 inches] in women), moderately increased (94–102 cm [34.6–40 inches] in men and 80–88 cm [31.5–35 inches] in women), or large (≥102 cm [≥40 inches] in men and ≥88 cm [≥35 inches] in women) [18],[19]. We excluded 189 participants (172 subcohort members and 17 cases from outside the subcohort) who were underweight (BMI<18.5 kg/m2) from all analyses. Using standardised, continuous measures and categorical BMI and WC variables, we compared the effect estimates for associations between each anthropometric measure and the risk of diabetes, separately for men and women, before and after adjustments. Adjustments included other anthropometric measures, smoking, education, and physical activity, as specified for all models in the corresponding tables.
Where heterogeneity was observed in the effect estimates between centres, meta-regression was used to explore the extent to which the average age, BMI, or WC in each centre explained the heterogeneity. To assess whether the effect estimate of WC differed between men and women, a sex by WC (continuous variable) interaction term was included in the centre-specific Prentice-weighted Cox regression models, and the estimated interaction coefficients were then combined across centres using random effects meta-analysis. A similar analysis was performed to assess the evidence for a BMI group by WC group interaction using standard, clinical cut-offs.
To investigate the hazard ratio (HR) of diabetes by BMI and WC levels in more detail, we further subdivided study participants who had measures of BMI and WC into six BMI groups (18.5–22.4, 22.5–24.9, 25–27.4, 27.5–29.9, 30.0–34.9, and ≥35 kg/m2). Analyses were performed using Stata version 12 (StataCorp) Within Stata, the –st - suite of commands for performing survival analysis was used.
To estimate the cumulative incidence of diabetes we performed bootstrap sampling using the Stata bsample command to recreate the full cohort by resampling with replacement from the subcohort, according to the BMI and WC distributions within the subcohort. This made it possible to estimate absolute cumulative incidences (one minus the Kaplan-Meier estimate of the survivor function) for normal, increased, and large WC groups separately within the groups of normal, overweight, and obese men and women.
Results
Characteristics of men and women who were part of the subcohort are shown in Tables 1 and 2. A total of 50.0% of men and 33.8% of women were overweight, and 16.4% of men and 15.8% of women were obese. Overweight or obese men and women were shorter and had larger WCs and waist-hip ratios than participants with normal baseline BMI (all p<0.001). Overweight or obese men and women were more likely to be physically inactive and to be educated at primary school level or less (all p<0.001). While obese men were less likely to be never smokers and more likely to be former smokers, the opposite was observed in obese women, who were more likely to be never smokers and less likely to be former or current smokers (all p<0.001).


Contributions of BMI and Waist Circumference to the Hazard of T2D
Significant, positive associations between both BMI and WC and the hazard of T2D were observed across all countries and centres in men and women (Figures 1–4). The pooled effect estimate (HR) for a 1 SD increase in BMI (SD 3.6 kg/m2 in men, 4.4 kg/m2 in women) was 1.93 (95% confidence interval 1.81; 2.06) in men and 2.07 (1.94; 2.21) in women; corresponding estimates for WC (SD 10.0 cm in men, 11.2 cm in women) were 1.95 (1.83; 2.08) in men and 2.43 (2.23; 2.64) in women (Figures 1–4; Table 3). There was heterogeneity between centres in the HRs for both BMI and WC (Figures 1–4), which was not explained by differences in the average age of participants in the different centres. A higher average WC was associated with a lower HR per 1 SD increase in BMI; inclusion of average WC in a meta-regression model reduced the I2 values from 48% to 0% in men and from 59% to 52% in women. However, average BMI did not explain the heterogeneity in the WC to T2D associations in either men or women. There was no significant interaction between BMI and WC in either men (interaction parameter estimate 0.97 [0.85; 1.11], p = 0.66) or women (interaction parameter estimate 1.10 [0.99; 1.22], p = 0.073).


Differences in Associations between Men and Women
The stronger association between WC and incident T2D in women, compared to men, became more apparent in models mutually adjusting for WC and BMI (Table 3). While the independent contributions of a sex-specific SD increase in WC and BMI to the hazard of diabetes were of similar magnitude in men (1.39 [1.19; 1.63] for WC and 1.49 [1.27; 1.73] for BMI), the increased hazard of diabetes conveyed by a larger WC as opposed to higher BMI was much larger in women (2.14 [1.87; 2.45] for WC and 1.15 [1.02; 1.30] for BMI). A disproportionately increased HR of diabetes in women (HR 11.3 [9.15; 13.9]) compared to men (HR 5.36 [4.38; 6.54]; Table 3) was also seen using sex-specific cut-offs clinically used to identify individuals with central adiposity and excess visceral fat (>102 cm [40 inches] in men and >88 cm [35 inches] in women). Consistently greater HRs were observed in women across all study centres (Figure S1), with sex ratios (HRwomen/HRmen) ranging from 1.03 to 3.31 and a pooled sex ratio of 1.69 (1.42; 2.02). The higher hazard associated with greater WC in women was not explained by confounding by BMI, since the BMI adjusted pooled sex ratio was 1.60 (1.34; 1.90).
Hazard Ratio of Diabetes at Different Levels of Waist Circumference and BMI
BMI and WC are highly positively correlated (r = 0.85 in men and 0.87 in women in the subcohort). Therefore, too few men and women with a BMI of 18.5–22.4 kg/m2 had a WC greater than or equal to 94/80 cm (n = 130) and too few men with a BMI of 22.5–24.9 kg/m2 had a WC greater than or equal to 102 cm (n = 13) to contribute to stratified analyses (Tables 4 and 5). The same was true for participants with a BMI of 30–34.9 kg/m2 and a WC lower than 94/80 cm (n = 49), or those with a BMI greater or equal to 35 kg/m2 and a WC lower than 102/88 cm (n = 14).


Compared to those with a BMI of 18.5–22.4 kg/m2 and normal WC, the HR of diabetes was successively higher at greater levels of BMI and WC, ranging from 1.53 (1.20; 1.95) in men and 1.71 (1.39; 2.09) in women with normal weight at BMI 22.5–24.9 kg/m2 and a normal WC, to 22.0 (14.3; 33.8) in men and 31.8 (25.2; 40.2) in women with a BMI greater or equal to 35 kg/m2 and a high WC. The HR of diabetes was generally higher (or similar) when comparing people in a lower BMI but higher WC group to those in the BMI group above with a smaller WC, an effect that was particularly pronounced in women. For example, in overweight women, the HR in those with a BMI of 25.0–27.4 kg/m2 and a large WC (≥88 cm) was 10.3 (8.00; 13.3), but was 5.82 (4.64; 7.31) in those with a BMI of 27.5–29.9 kg/m2 and a moderately increased WC (≥80–87.9 cm).
Cumulative 10-y Incidence of Developing Diabetes
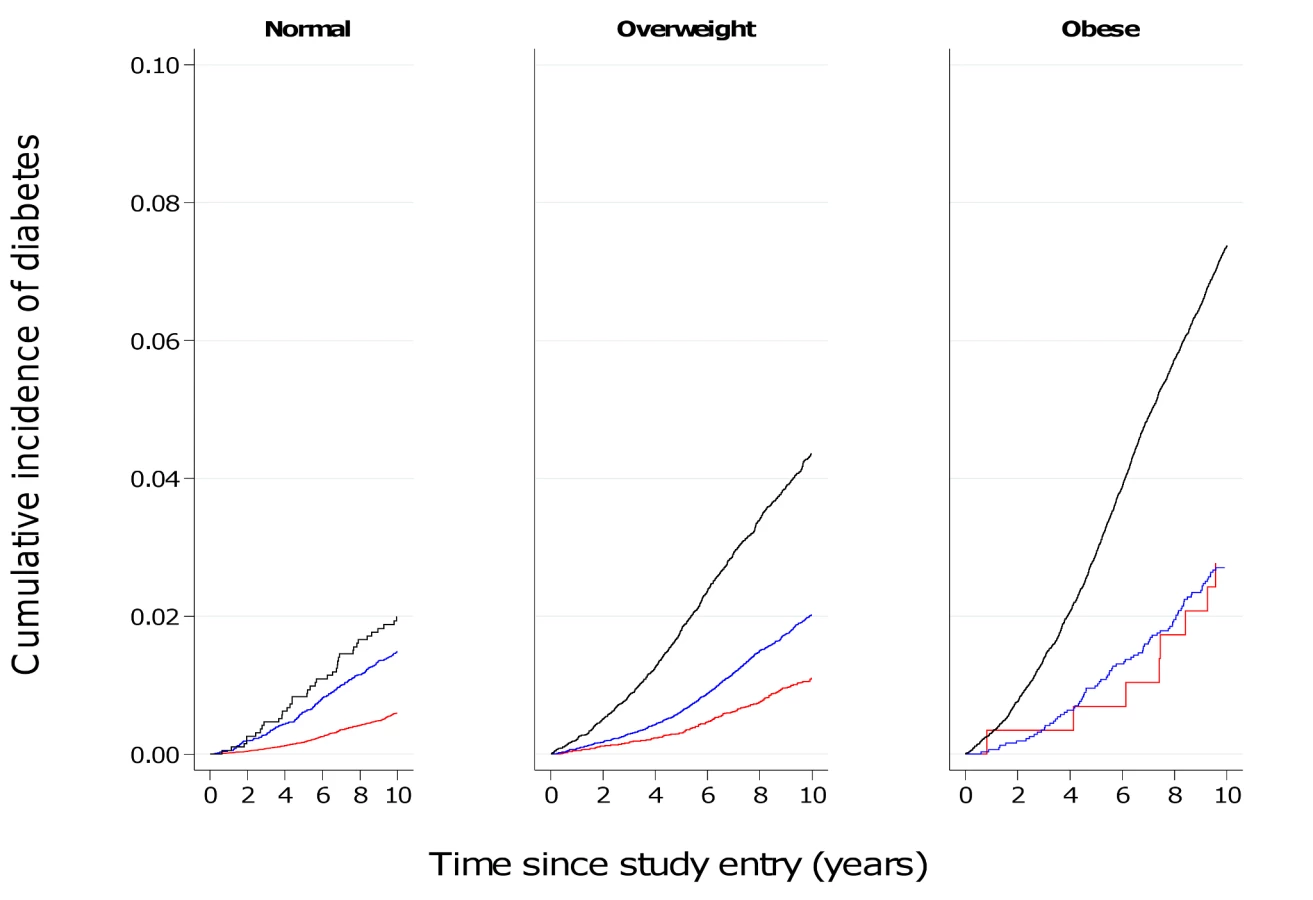
Figures 5 and 6 show the cumulative incidence of T2D over 10 y of follow-up for different groups of BMI and WC, separately in men and women. Tables S1 and S2 additionally include cumulative incidences for three different follow-up times (5, 10, 15 y) together with 95% confidence intervals, numbers of events, and person-years of follow-up. The cumulative 10-y incidences estimated in normal weight participants (BMI 18.5–24.9 kg/m2) were 1.2%, 2.8%, and 2.2% in men with a normal (<94 cm), moderately increased (≥94–101.9 cm), and large (≥102 cm) WC; the corresponding figures for women with a normal (<80 cm), moderately increased (≥80–87.9 cm), and large (≥88 cm) WC were 0.59%, 1.5%, and 2.0%. In overweight individuals, WC distinguished those with incidence rates comparable to normal weight from those with rates equivalent to obese individuals. Cumulative 10–y incidences for men with normal, moderately increased, and large WC were 2.3%, 3.9%, and 7.0% in overweight men and 5.0%, 4.9%, and 10.3% in obese men. Corresponding figures were 1.1%, 2.0%, and 4.4% in overweight women and 2.8%, 2.7%, and 7.4% in obese women, respectively.

Discussion
Results based on 12,403 incident cases of T2D identified in 26 centres in eight European countries as part of the InterAct case-cohort study show independent, significant contributions of both BMI and WC to the risk of T2D. We found greater HRs for WC in women, compared to men, in analyses of standardised, continuous measures as well as using recommended clinical thresholds for abdominal obesity. In terms of absolute risk, 7% of men and 4.4% of women who were overweight and had a large WC at baseline developed diabetes over a 10-y period, placing them at an absolute risk equivalent to or higher than that of obese participants.
Clinical Implications
In addition to obese and severely obese individuals at high risk of diabetes, more than a third of the population in the US and UK is overweight [3],[4]. These individuals' risk of T2D is much less well defined, despite its potentially greater contribution to the absolute burden of diabetes and related complications. We show that assessment of WC identifies those at high risk of T2D among the large group of individuals who are overweight. Individual lifestyle interventions can reduce diabetes risk [5], but are not feasible in everyone who is overweight or obese. Current clinical practice relies on BMI to identify overweight and obese individuals at increased risk of diabetes and other adiposity-related morbidity and mortality. Although measurement of WC is often recommended in clinical guidelines, it is rarely actually performed. In a survey of practice nurses in the UK, 96% reported measuring BMI in a typical week, but only 12% measured WC [20]. Recommendations to measure WC on everyone are unlikely to be successful since time pressures are cited as one of the explanations for the implementation gap between recommendations and actual clinical practice. Thus risk prediction models for T2D that assume universal measurement are unlikely to be helpful. As an alternative strategy, practice could focus measurement of WC on subgroups in whom the additional information is likely to make a difference to clinical decision making. Our results suggest that current clinical recommendations should consider the introduction of WC measurement amongst all overweight men and women to identify high-risk individuals for early lifestyle intervention. Normal weight men and women were at sufficiently low absolute risk that measurement of WC would not change their risk categorisation. People in the obese group should already be targeted for individualised lifestyle intervention programmes, and measurement of WC would not alter this recommendation. This observation, of course, does not imply that WC is an unimportant aetiological risk factor in normal weight and obese individuals, but rather that its measurement in these groups does not have an impact on clinical decision making.
Public Health Implications
The frequency of diabetes in combination with its severe long-term complications through organ damage and dysfunction, particularly of the cardiovascular system, create a major public health problem and serious burden on health care systems. Obesity is the strongest risk factor for T2D, and World Health Organization projections estimate that by 2015 approximately 2.3 billion adults will be overweight, more than 700 million will be obese, and diabetes deaths will increase by more than 50% worldwide during this time [21]. Prevention strategies for T2D require a balance of investment between population-level interventions aimed at shifting the whole distribution of key risk factors and individually focused lifestyle interventions targeted at high-risk individuals. Our results clearly show the value that measurement of WC may have in identifying which people among the large population of overweight individuals are at highest risk of diabetes.
Comparison with Previous Studies
Previous literature-based reviews have investigated associations between BMI, WC, or other measures of abdominal obesity and incident diabetes [7],[8],[22] and reported similar associations, with risks being approximately twice as large per 1 SD difference in the different obesity measures. Results from the EPIC Potsdam cohort including 1,008 incident T2D cases suggested that the relative risk of T2D associated with WC is smaller in obese than in normal and overweight men and women [23]. We found no evidence for a significant interaction between BMI and WC in men or women in the InterAct study, which includes incident cases from the EPIC Potsdam cohort. Individual studies and meta-analyses investigating the separate and joint contributions of measures of overall and central adiposity have often focused on their respective aetiological relevance [2],[7],[8],[23]. However, it is difficult to draw inference about the specific role of central and abdominal obesity for diabetes development from epidemiological analyses mutually adjusting for BMI and WC given the strong correlation between these measures and differences in their respective measurement errors [9].
Although associations of BMI and WC with T2D incidence did not differ substantially between countries, and effect estimates of BMI and WC appeared largely consistent, we observed significant heterogeneity in our meta-analyses, with I2 values of 48% and 31% for BMI and WC in men and 59% and 69% in women. Meta-regression analyses showed that this heterogeneity was not explained by differences in the average age of participants from the different countries. In contrast, centres with higher average WCs tended to have lower effect estimates of BMI, and inclusion of average WC in meta-regression analyses reduced the I2 in men from 48% to 0% and in women from 59% to 52%. Average BMI did not explain heterogeneity in the association between WC and T2D in men and women.
Sex Differences
We observed a stronger effect estimate for excess abdominal fat in women compared to men using different analytical strategies. This was not due to sex differences in the correlation between WC and BMI, which was similar in both sexes (0.86 in men and 0.87 in women in the subcohort). Also, sex differences in the association between WC and T2D were not explained by height, which was shown to only have a very marginal influence on the association. Previous work has highlighted the value of WC as an index of abdominal fat accumulation when it is interpreted in the context of overall levels of adiposity [24],[25]. In this study, sex differences in the association between WC and T2D were particularly pronounced after adjusting for BMI. This suggests that WC may be a better measure of abdominal fat and diabetes risk in women once differences in overall body size are accounted for, potentially because of a greater contribution of subcutaneous fat to women's WC levels, compared to men.
These results demonstrate that women at greater relative risk of T2D are identified when using recommended, sex-specific WC cut-offs and suggest that cut-offs need to be reviewed if the aim is to target comparable levels of relative risk in men and women. However, if the aim is to target groups based on absolute risk, then the observation that absolute levels of T2D risk are lower in women at any level of WC compared to men is more important.
Strengths and Weaknesses
This is the largest study of incident diabetes to date to investigate the separate and joint contributions of BMI and WC. Advantages of our study include its power, prospective design, and international, multicentre population. Inclusion of over 12,000 incident cases allows investigation of T2D risk for different combinations of BMI and WC cut-offs with greater precision. The prospective design of the InterAct case-cohort study minimises systematic error introduced by recall or treatment bias that cross-sectional and case-control studies are subject to. Investigation on a Europe-wide scale increases the generalisability of our findings. However, while the possibility of examining anthropometric effects across the eight European countries can help to understand factors contributing to any potential heterogeneity, results from our European descent InterAct participants do not allow inferences about BMI - and WC-associated relative or absolute risks of T2D in other ethnic groups with potentially different body composition and T2D incidence. Methods for case ascertainment and verification in InterAct are largely based on a clinical diagnosis of T2D. Estimates of the cumulative incidence in InterAct are therefore an underestimation, potentially differential with regard to obesity levels, as rates are expected to be higher if undiagnosed, asymptomatic diabetes cases were also considered. While our large-scale study had standardised measures of anthropometry available for all except 363 Oxford participants, some differences existed between centres in terms of the WC measurement site or the clothes worn during measurement. Assuming that any misclassification was non-differential with regard to case status, this may have led to an attenuation of the observed associations for WC, highlighting the importance of appropriately designed and powered studies with standardised measures of WC to address its relative importance for the risk of diabetes and other outcomes.
Conclusion
WC is independently and strongly associated with T2D, particularly in women, and should be more widely measured. If targeted measurement is necessary for reasons of resource scarcity, measuring WC in overweight individuals may be an effective strategy since it identifies a high-risk subgroup of individuals who could benefit from individualised preventive action.
Supporting Information
Zdroje
1. Barrett-ConnorE 1989 Epidemiology, obesity, and non-insulin-dependent diabetes mellitus. Epidemiol Rev 11 172 181
2. WangYRimmEBStampferMJWillettWCHuFB 2005 Comparison of abdominal adiposity and overall obesity in predicting risk of type 2 diabetes among men. Am J Clin Nutr 81 555 563
3. FlegalKMCarrollMDOgdenCLCurtinLR 2010 Prevalence and trends in obesity among US adults, 1999–2008. JAMA 303 235 241
4. ZaninottoPHeadJStamatakisEWardleHMindellJ 2009 Trends in obesity among adults in England from 1993 to 2004 by age and social class and projections of prevalence to 2012. J Epidemiol Community Health 63 140 146
5. KnowlerWCBarrett-ConnorEFowlerSEHammanRFLachinJM 2002 Reduction in the incidence of type 2 diabetes with lifestyle intervention or metformin. N Engl J Med 346 393 403
6. KnowlerWCFowlerSEHammanRFChristophiCAHoffmanHJ 2009 10-year follow-up of diabetes incidence and weight loss in the Diabetes Prevention Program Outcomes Study. Lancet 374 1677 1686
7. VazquezGDuvalSJacobsDRJrSilventoinenK 2007 Comparison of body mass index, waist circumference, and waist/hip ratio in predicting incident diabetes: a meta-analysis. Epidemiol Rev 29 115 128
8. FreemantleNHolmesJHockeyAKumarS 2008 How strong is the association between abdominal obesity and the incidence of type 2 diabetes? Int J Clin Pract 62 1391 1396
9. KleinSAllisonDBHeymsfieldSBKelleyDELeibelRL 2007 Waist circumference and cardiometabolic risk: a consensus statement from shaping America's health: Association for Weight Management and Obesity Prevention; NAASO, the Obesity Society; the American Society for Nutrition; and the American Diabetes Association. Diabetes Care 30 1647 1652
10. DunkleyAJStoneMAPatelNDaviesMJKhuntiK 2009 Waist circumference measurement: knowledge, attitudes and barriers in patients and practitioners in a multi-ethnic population. Fam Pract 26 365 371
11. LangenbergCSharpSForouhiNGFranksPWSchulzeMB 2011 Design and cohort description of the InterAct Project: an examination of the interaction of genetic and lifestyle factors on the incidence of type 2 diabetes in the EPIC Study. Diabetologia 54 2272 2282
12. HaftenbergerMLahmannPHPanicoSGonzalezCASeidellJC 2002 Overweight, obesity and fat distribution in 50 - to 64-year-old participants in the European Prospective Investigation into Cancer and Nutrition (EPIC). Public Health Nutr 5 1147 1162
13. PischonTBoeingHHoffmannKBergmannMSchulzeMB 2008 General and abdominal adiposity and risk of death in Europe. N Engl J Med 359 2105 2120
14. SpencerEARoddamAWKeyTJ 2004 Accuracy of self-reported waist and hip measurements in 4492 EPIC-Oxford participants. Public Health Nutr 7 723 727
15. RiboliEHuntKJSlimaniNFerrariPNoratT 2002 European Prospective Investigation into Cancer and Nutrition (EPIC): study populations and data collection. Public Health Nutr 5 1113 1124
16. DayNOakesSLubenRKhawKTBinghamS 1999 EPIC-Norfolk: study design and characteristics of the cohort. European Prospective Investigation of Cancer. Br J Cancer 80 95 103
17. WarehamNJJakesRWRennieKLSchuitJMitchellJ 2003 Validity and repeatability of a simple index derived from the short physical activity questionnaire used in the European Prospective Investigation into Cancer and Nutrition (EPIC) study. Public Health Nutr 6 407 413
18. World Health Organization 2000 Obesity: preventing and managing the global epidemic. Report of a WHO consultation. World Health Organ Tech Rep Ser 894 1 253
19. National Cholesterol Education Program (NCEP) Expert Panel on Detection, Evaluation, and Treatment of High Blood Cholesterol in Adults (Adult Treatment Panel III) 2002 Third report of the National Cholesterol Education Program (NCEP) Expert Panel on Detection, Evaluation, and Treatment of High Blood Cholesterol in Adults (Adult Treatment Panel III) final report. Circulation 2002 106 3143 3421
20. BrownIStrideCPsarouABrewinsLThompsonJ 2007 Management of obesity in primary care: nurses' practices, beliefs and attitudes. J Adv Nurs 59 329 341
21. World Health Organization 2006 Obesity and overweight. Fact sheet number 311. Geneva: World Health Organization
22. AbdullahAPeetersAdeCourtStoelwinderJ 2010 The magnitude of association between overweight and obesity and the risk of diabetes: a meta-analysis of prospective cohort studies. Diabetes Res Clin Pract 89 309 319
23. FellerSBoeingHPischonT 2010 Body mass index, waist circumference, and the risk of type 2 diabetes mellitus: implications for routine clinical practice. Dtsch Arztebl Int 107 470 476
24. DespresJP 2011 Excess visceral adipose tissue/ectopic fat the missing link in the obesity paradox? J Am Coll Cardiol 57 1887 1889
25. BalkauBDeanfieldJEDespresJPBassandJPFoxKA 2007 International Day for the Evaluation of Abdominal Obesity (IDEA): a study of waist circumference, cardiovascular disease, and diabetes mellitus in 168,000 primary care patients in 63 countries. Circulation 2007 116 1942 1951
Štítky
Interní lékařstvíČlánek vyšel v časopise
PLOS Medicine
2012 Číslo 6
- Proces hojení ran krok za krokem a co ho může zkomplikovat
- Limity glykovaného hemoglobinu a význam dalších glykovaných proteinů
- Korelace dávky levothyroxinu s titrem autoimunitních protilátek u primární hypotyreózy
- Plicní hypertenze – syndrom mnoha tváří – vyžaduje přesnou diagnostiku a specializovanou léčbu
- Rána vizitkou (nejen) chirurga
Nejčtenější v tomto čísle
- Tobacco Industry Manipulation of Tobacco Excise and Tobacco Advertising Policies in the Czech Republic: An Analysis of Tobacco Industry Documents
- Why Human Health and Health Ethics Must Be Central to Climate Change Deliberations
- Clinical Trials Have Gone Global: Is This a Good Thing?
- Point-of-Care Tests to Strengthen Health Systems and Save Newborn Lives: The Case of Syphilis
Zvyšte si kvalifikaci online z pohodlí domova
Mazová zátka a její řešení
nový kurzVšechny kurzy