
The Effect of Rural-to-Urban Migration on Obesity and Diabetes in India: A Cross-Sectional Study
Background:
Migration from rural areas of India contributes to urbanisation and may increase the risk of obesity and diabetes. We tested the hypotheses that rural-to-urban migrants have a higher prevalence of obesity and diabetes than rural nonmigrants, that migrants would have an intermediate prevalence of obesity and diabetes compared with life-long urban and rural dwellers, and that longer time since migration would be associated with a higher prevalence of obesity and of diabetes.
Methods and Findings:
The place of origin of people working in factories in north, central, and south India was identified. Migrants of rural origin, their rural dwelling sibs, and those of urban origin together with their urban dwelling sibs were assessed by interview, examination, and fasting blood samples. Obesity, diabetes, and other cardiovascular risk factors were compared. A total of 6,510 participants (42% women) were recruited. Among urban, migrant, and rural men the age - and factory-adjusted percentages classified as obese (body mass index [BMI] >25 kg/m2) were 41.9% (95% confidence interval [CI] 39.1–44.7), 37.8% (95% CI 35.0–40.6), and 19.0% (95% CI 17.0–21.0), respectively, and as diabetic were 13.5% (95% CI 11.6–15.4), 14.3% (95% CI 12.2–16.4), and 6.2% (95% CI 5.0–7.4), respectively. Findings for women showed similar patterns. Rural men had lower blood pressure, lipids, and fasting blood glucose than urban and migrant men, whereas no differences were seen in women. Among migrant men, but not women, there was weak evidence for a lower prevalence of both diabetes and obesity among more recent (≤10 y) migrants.
Conclusions:
Migration into urban areas is associated with increases in obesity, which drive other risk factor changes. Migrants have adopted modes of life that put them at similar risk to the urban population. Gender differences in some risk factors by place of origin are unexpected and require further exploration.
: Please see later in the article for the Editors' Summary
Published in the journal:
. PLoS Med 7(4): e32767. doi:10.1371/journal.pmed.1000268
Category:
Research Article
doi:
https://doi.org/10.1371/journal.pmed.1000268
Summary
Background:
Migration from rural areas of India contributes to urbanisation and may increase the risk of obesity and diabetes. We tested the hypotheses that rural-to-urban migrants have a higher prevalence of obesity and diabetes than rural nonmigrants, that migrants would have an intermediate prevalence of obesity and diabetes compared with life-long urban and rural dwellers, and that longer time since migration would be associated with a higher prevalence of obesity and of diabetes.
Methods and Findings:
The place of origin of people working in factories in north, central, and south India was identified. Migrants of rural origin, their rural dwelling sibs, and those of urban origin together with their urban dwelling sibs were assessed by interview, examination, and fasting blood samples. Obesity, diabetes, and other cardiovascular risk factors were compared. A total of 6,510 participants (42% women) were recruited. Among urban, migrant, and rural men the age - and factory-adjusted percentages classified as obese (body mass index [BMI] >25 kg/m2) were 41.9% (95% confidence interval [CI] 39.1–44.7), 37.8% (95% CI 35.0–40.6), and 19.0% (95% CI 17.0–21.0), respectively, and as diabetic were 13.5% (95% CI 11.6–15.4), 14.3% (95% CI 12.2–16.4), and 6.2% (95% CI 5.0–7.4), respectively. Findings for women showed similar patterns. Rural men had lower blood pressure, lipids, and fasting blood glucose than urban and migrant men, whereas no differences were seen in women. Among migrant men, but not women, there was weak evidence for a lower prevalence of both diabetes and obesity among more recent (≤10 y) migrants.
Conclusions:
Migration into urban areas is associated with increases in obesity, which drive other risk factor changes. Migrants have adopted modes of life that put them at similar risk to the urban population. Gender differences in some risk factors by place of origin are unexpected and require further exploration.
: Please see later in the article for the Editors' Summary
Introduction
In India the urban prevalence of diabetes in adults has risen from 5% in 1984 to just under 15% in 2004 [1],[2]. Markedly lower rural levels of diabetes have been evident for decades, but more recently prevalence appears to have increased from 2% to 6% in rural south India [3]. Underlying these adverse trends in diabetes are increases in obesity affecting urban areas much more than rural areas of India. The 2nd Indian National Family Household Survey in 1998–1999 confirmed the marked rural-urban differences in prevalence of obesity among women [4] and men [5], and also a rising trend between the 2nd and 3rd National Family Household Survey in 2005 [6]. The increasing risks of obesity and diabetes in India and in other low - and middle-income countries have been attributed to increased consumption of saturated fats, sugars, and sedentary behaviour associated with urbanisation and westernisation [7]. However, obesity and diabetes have early life origins that track into adulthood and these may play a critical role in explaining the obesity and diabetes “epidemics” in developing countries [8]. In India urbanisation is caused by urban expansion into peripheral areas and internal migration from rural to urban areas, largely for economic reasons. However, it is not clear how urbanisation increases the risk of obesity and diabetes among people who have had divergent early life experiences, particularly in developing countries. Migration studies are powerful means of identifying environmental causes of common diseases as changes in environment are large and occur at a known time, making causal inferences more feasible. In a major review of the evidence on migration and cardiovascular risk factors and obesity, McKay and colleagues state “it is clear that migrants in general tend to suffer from worse health and display disadvantaged risk factor profiles. In comparison to the host population they are more frequently subject to hypertension, chronic conditions, low birth weight, and obesity etc. Moreover, their ill health and unfavourable risk profiles may worsen with increasing duration of stay” [9]. While the trends of increased risk of obesity and diabetes among both international south Asian migrants are well documented [10],[11], much less is known about the effects of internal rural-to-urban migration in India.
The rising rates of diabetes in both urban and rural India indicate that urbanisation is an important but not a sufficient explanation. Examining the experience of rural-to-urban migrants would help understand what is driving these trends. Migrants would be expected to acquire the high risk of the urban population if the disease is largely environmentally determined and for such trends to be dependent on the duration of time spent in a new environment and the extent to which traditional ways of living are lost—as seen for coronary heart disease among the Japanese moving to the US [12]. Conversely, for some common causes of chronic disease in the country of origin, the environmental changes associated with migration may result in lower risk of hypertensive heart disease, for example [13]. Previous studies are conflicting with some suggesting that changes in cardiovascular risk factors (particularly blood pressure) may occur within a few years [14], whilst others indicating that considerable exposure to urban life is necessary [9]. A recent review of the experience of migrants to the US indicates a complex picture with generally better health among migrants but with heterogeneity between different groups, probably reflecting the duration of stay in the US [15].
Based on these findings, the main hypothesis of our study was that rural-urban migrants would have higher rates of obesity and diabetes than rural nonmigrants and secondary hypotheses were that (a) rural-urban migrants' rates of obesity and diabetes would be intermediate to that of rural and life-long urban dwellers and (b) longer stays in the urban environment would increase rates of obesity and diabetes.
Methods
Using the framework of a cardiovascular risk factor screening study conducted in factories in north, central, and south India [16], we designed a sib-pair comparison study. Details of the design have been reported elsewhere [17]. Briefly, the study was in four Indian factories (Lucknow, Hindustan Aeronautics Ltd; Nagpur, Indorama Synthetics Ltd; Hyderabad, Bharat Heavy Electricals Ltd; and Bangalore, Hindustan Machine Tools Ltd) situated in the north, centre, and south of the country. Factory workers and their coresident spouses were recruited if they were rural-urban migrants using employer records as the sampling frame. Each migrant worker and spouse was asked to invite one nonmigrant full sibling of the same sex and closest to them in age still residing in their rural place of origin. Precedence was given to gender over age and where multiple same-sex sibs were available the one closest in age was invited. This strategy resulted in rural dwelling sibs being drawn from 20 of the 29 states in India, reflecting the migration patterns of the factory workforce and their spouses. A 25% random sample of nonmigrants was invited to participate in the study. Nonmigrants were also asked to invite a sib who resided in the same city but did not work in the factory. Information sheets were translated into local languages and signed (or a thumb print used if the individual was illiterate), and through this, informed consent obtained. Ethics committee approval was obtained from the All India Institute of Medical Sciences Ethics Committee, reference number A-60/4/8/2004. Field work began in March 2005 and was completed by December 2007.
Measurement of Cardiovascular Risk Factors
Standing height was measured with mandibular stretch at end expiration using a plastic stadiometer (Leicester height measure; Chasmors Ltd), and weight was measured in light clothes with shoes off using a digital scale (Model PS16). Skinfold thickness was measured three times at the triceps, subscapular, and medial calf using Holtain calipers and the average of the three measures used. Subscapular and triceps skinfolds were used to calculate percent body fat using a standard formula [18]. Waist and hip circumferences were measured using a nonstretch narrow metal tape with a blank lead in (Chasmors metallic tape), taking the average of two readings. Blood pressure was measured using an Omron M5-I automatic machine in the sitting position using the right upper arm and an appropriate sized cuff after a period of 5 min rest. Participants were interviewed using a structured questionnaire to obtain information about tobacco use and alcohol consumption.
Obesity - and Diabetes-Related Outcomes
Obesity was defined as body mass index (BMI) greater than 25 kg/m2 (Indian adult population standard) [19]. A diagnosis of diabetes was made using the World Health Organization (WHO) fasting plasma glucose criterion of >7.0 mmol/l [20] or report of a doctor diagnosis of diabetes. Homeostasis model assessment (HOMA) scores to estimate insulin resistance were calculated from fasting blood glucose and serum insulin levels using a standard formula of plasma glucose (mol/l) × plasma insulin (mU/l)/22.5), on the basis of the original approach [21]. HOMA has been validated by comparison with biochemical markers of insulin resistance in healthy Indian people, yielding moderate correlations [22].
Dietary Assessment
Diet was assessed by an interviewer-administered semiquantitative food frequency questionnaire (FFQ). The questionnaire assessed frequency of intake (daily, weekly, monthly, yearly/never) of 184 commonly consumed food items. In order to assess the reliability of the FFQ, subsamples were asked to complete the questionnaire 1–2 mo (n = 185), as well as 12 mo (n = 305) after completion of the questionnaire during the original period of data collection. Kappa coefficients ranging from 0.26–0.71 were obtained, which are similar to values obtained in other reliability studies [23],[24]. Another 530 participants (53.9% males) were administered a reference method of three 24-h recalls, which was used to validate the FFQ. Most food items yielded validities that were acceptable. Fat intake (g/d) was reliably measured and is presented here as an indicator of dietary change.
Physical Activity
An interviewer-administered questionnaire was used to assess physical activity of the past month across multiple domains including discretionary leisure time, household chores, work, sleep, sedentary activities, and other common daily activities. For each activity the average amount of time and the frequency were documented. Participants reported frequencies to fixed categories of “daily,” “once a week,” “2–4 times a week,” “5–6 times a week,” “once a month,” and “2–3 times a month.” Metabolic equivalent tasks (METs) were estimated as the ratio of resting metabolic rate where 1 MET is equivalent to the energy expenditure value of sitting quietly. When all the activities reported did not cumulatively account for 24 h, a standard MET of 1.4 was applied to the residual time [25]. For manual occupational activity an integrated energy index (IEI) of the activity was applied instead of the absolute MET value. IEI take into account “rest” or “pause” periods, which individuals are likely to take when engaged in these manual activities [26]. Validation of the questionnaire was conducted in 49 rural and 45 urban participants by making comparisons with uni-axial accelerometers and a 24-h activity diary. Physical activity showed acceptable validity with these reference methods with little evidence of bias although correlations were only modest (accelerometer r = 0.28; p<0.01; 24-h activity diary r = 0.30; p<0.01) [27]. Activity data were summarised as METs hours per day.
Socioeconomic Position
A subset of 14 of 29 questions were used from the Standard of Living Index (SLI), a household level asset-based scale devised for Indian surveys [5], selecting those we believed most informative for our study population. They comprised: quality of house; toilet facilities; source of lighting and drinking water; possession of clock, radio, television, bicycle, motorcycle, car, tractor, refrigerator, telephone; and weighted to give a maximum score of 38. Weights of items for the SLI were developed by the International Institute of Population Sciences in India [5], and were based on a priori knowledge about the relative significance of the items. These same weights were used for the Indian Migrants Study analysis. Measurement at the household level is appropriate in the Indian context, in which the individual's socioeconomic position has less impact on their material wealth. This asset-based score was considered a more appropriate indicator of socioeconomic position for these analyses than education, income, or occupation because it is more likely to reflect the changes that migrants experience following their move to urban areas. A low SLI is associated with tobacco use [28] and with mortality [29], indicating its validity as a socioeconomic marker.
Laboratory Assays
Participants were asked to attend fasting and the time of last meal was recorded. Blood samples, with the exception of glucose assays, were separated and stored at −20°C locally and transported monthly to the All India Institute of Medical Sciences (AIIMS), Delhi. Glucose was measured on the day of sample collection in local laboratories at each site with the GOD-PAP method using RANDOX kits [30]. Serum HDL cholesterol was estimated directly by an elimination method [31], total cholesterol was estimated by an enzymatic endpoint method, and triglycerides by GPO-PAP method. The quality of local assays was checked with regular external standards and internal duplicate assays and monitored by AIIMS. For quality assurance the Cardiac Biochemistry Lab, AIIMS, is part of the UK National External Quality Assessment (http://www.ukneqas.org.uk/).
Statistical Analyses
As the study is based on factory workers, their spouses, and a sibling of each factory worker and spouse these data cannot be treated as coming from independent individuals and the data structure must be accounted for in the statistical analysis. The focus of the present analyses was the comparison between the three groups: urban, migrants, and rural. Of these, the migrant and rural groups were paired with each other (with a sibling in each group), while the urban group of siblings was an independent referent not paired to the other two groups. A general model framework that can accommodate this data structure was therefore required, leading us to use multilevel (i.e., random effects) models [32]. In the multilevel model the between-pair variation is specified explicitly and included in the model. The models include a random shift in the intercept applied to both siblings from a pair. This makes two siblings similar (within-pair correlation) and at the same time different to individuals from other sib pairs (between-pair variation). Comparisons were made between nonmigrant urban dwellers, rural-urban migrants, and nonmigrant rural dwellers using linear random effects models for the continuous outcomes and for the binary outcomes logistic regression with a pair-specific random effect to estimate the within-pair comparisons.
Men and women were analysed separately as we anticipated that there might be gender differences in migration effects. Separate analyses of men and women were also more readily interpreted given the statistical dependency between husbands and wives produced by the study design. Adjustments were made for factory and the interaction between age and age group in all comparisons. As the urban group was expected to have the highest and the rural group the lowest levels of risk factors and disease, trend tests were carried out scoring the groups 1 to 3 and using likelihood ratio tests. As a secondary hypothesis, tests of whether the effects in the urban and migrant groups were equal were also made. All analyses were conducted using STATA 10.
Results
Response Rates
Employee records indicated that 21,662 workers and spouses at the four factories were available for study. A total of 15,596 (72%) of these individuals were identified as still working in the factory and were contacted, of whom 13,695 (88%) completed an assessment of their eligibility for the study. Of those who completed this initial assessment, 7,594 (55%) were eligible for inclusion as they had a rural dwelling sib or were selected as part of a random 25% sample of urban nonmigrants. Of eligible individuals, 7,102 (94%) agreed in principle to complete the clinical examination with their sibling, of whom 3,537 (50%) sib-pairs eventually participated by the close of field work. Factory workers who lived in rural areas and commuted to work (n = 519) and 38 urban-rural migrants were excluded from these analyses (see Figure S1). Failure to participate was largely due to unwillingness of rural sibs to travel and competing time pressures (school exams, harvest season). Limited data were available from the initial screening interview to make comparisons between responders, nonresponders, and those unwilling to consent in the full clinical study. No differences in marital status, mean age, distance from rural place of origin, and migrant status were found (see Table S1). Self-reported prevalence of cardiovascular diseases was lower in nonresponders (14.8%), but higher in nonconsenters (21.1%), than in responders (19.3%). There were differences in smoking habits between responders and other groups.
Demographic and Socioeconomic Characteristics
A total of 6,510 participants were included in analyses of whom 2,723 (42%) were women; overall 2,287 were nonmigrant urban dwellers, 2,112 rural-urban migrants, and 2,111 nonmigrant rural dwellers (see Table 1). Urban men were older than rural men but of similar age to migrant men. Education to at least primary school level was near universal among urban men and women, and migrant men, but was less likely for rural women. The median standard of living index was similar for both urban and migrant households but was considerably lower for rural ones. Most migrants had spent a considerable time in the urban environment (median, range: men 26 y [1–55 y] and women 21 y [<1–49 y]) with 9.3% (95% confidence interval [CI] 7.6–11.0) of men and 21.3% (95% CI 18.7–23.9) of women spending ≤10 y (see Figure S2).

Comparisons between Urban, Migrant, and Rural Groups
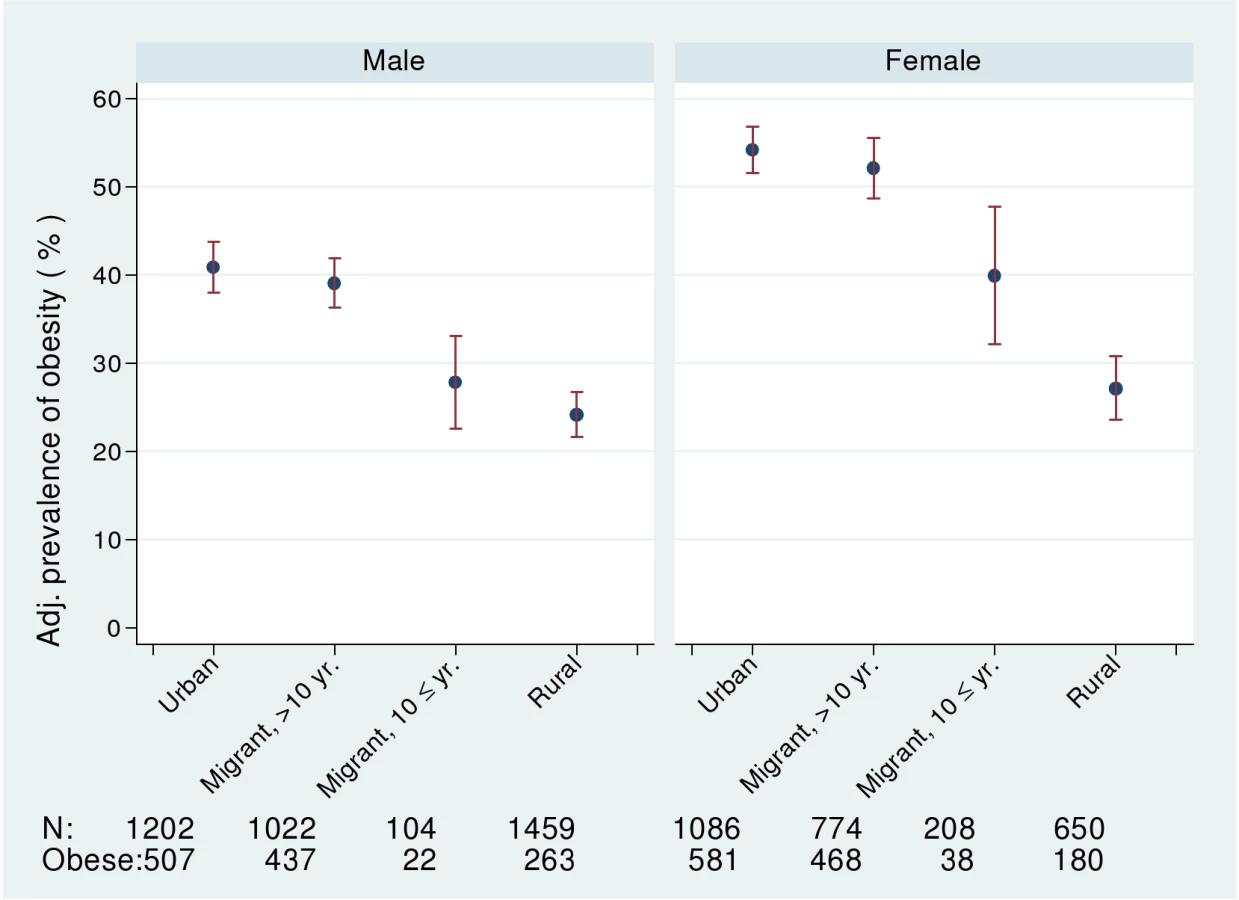
Comparisons of risk factors and health problems between urban, migrant, and rural groups are shown in Tables 2 and 3 with a random effect to take account of the sib-pair design. There was strong evidence in both men and women of differences in BMI (weight/height2) between urban, migrant, and rural people (ptrend <0.0001) as shown in Table 2. Obesity prevalence (BMI >25 kg/m2) was greatest in urban women (53.5%, 95% CI 50.5–56.5) and lowest in rural men (18.0%, 95% CI 17.0–21.0), with migrants in an intermediate position (see Figure 1). The age, occupation, and factory adjusted odds of obesity were between 3 - and 4-fold greater in migrant than rural men and women (Table 3). Percentage body fat estimated from skinfold thicknesses showed markedly higher values among women than men, with similar levels among urban and migrant groups, but lower levels among rural dwellers.


The urban and migrant groups were both very similar regarding MET h/d of physical activity, whereas the rural group had a higher average MET h/d (Table 2). This pattern was still seen after adjusting for BMI (Table 4). Participants were considered to be physically inactive if they belonged to the lowest third of MET h/d (for men and women separately). There was a significant trend over the three groups for men with the highest odds of being physically inactive in the urban group (see Table 3). There was no clear pattern for women. For both men and women the urban group had the highest levels of fat intake followed by the migrants and the rural group had the lowest level (Tables 2 and 4).

Smoking and drinking alcohol were rare among women; among men, migrants reported the lowest prevalence of smoking and rural men the highest. Alcohol use was highest among migrant men and lowest in rural men. Odds of hypertension (i.e., doctor diagnosis, on blood pressure lowering drugs, or blood pressure >140/90) in urban and migrant men were almost twice those of rural men and evidence of increased odds were also seen in women. Blood cholesterol and triglycerides were similar in urban and migrant groups but values were lower in rural men (ptrend <0.0001), with no differences observed in these variables in women.
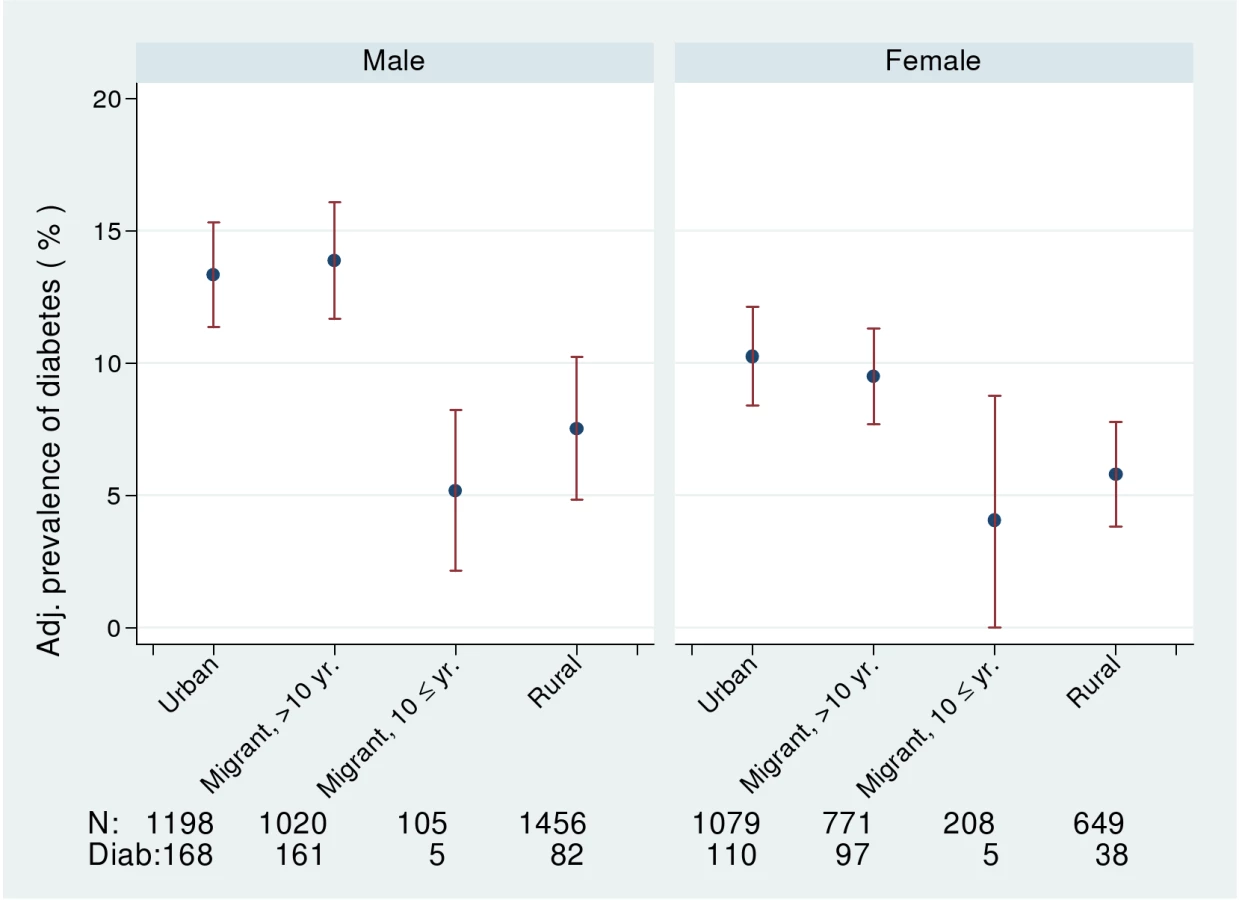
In both men and women, fasting blood glucose levels were similar in urban and migrant groups and lowest in rural groups (ptrend <0.0001). In men, but not women, fasting insulin levels and HOMA scores showed a downward trends (ptrend ≤0.0001) from urban, migrant, to rural. The prevalence of diabetes (i.e., doctor diagnosis, on treatment, or fasting blood glucose >7.0 mmol/l) was higher in urban and migrant groups than the rural group (see Figure 2). Both urban and migrant men and women had over 2-fold increased odds of diabetes compared with rural participants.
Further adjustment for BMI in men weakened the associations between place of origin and systolic blood pressure, hypertension, total cholesterol, and triglycerides but did not reduce the strength of associations with fasting blood glucose, HOMA, or the prevalence of diabetes (see Table 4). In women, further adjustment for BMI weakened the associations between place of origin and hypertension. Adjustment for percent body fat computed from skinfold thicknesses instead of BMI produced similar effects on associations (unpublished data).
Between Sib-Pair Differences
Data in Table 5 correspond to Tables 2–4 but focus on the estimated contrasts between migrant and rural sibs. The values shown represent the average difference between the migrant and nonmigrant rural sib. For example, the BMI of the male migrant sib group was 2.10 kg/m2 (95% CI 1.84–2.37 kg/m2) greater than that of the rural sib group of the same age. Among men the migrant sib group had consistently more adverse measures of obesity, lipids, and diabetes than the rural sib group. The between sib group differences were modest, 4.08% (95% CI 3.7–4.47) difference in body fat, 2.2 mmHg (95% CI 1.0–3.4 mmHg) in systolic blood pressure, and 0.20 mmol/l (95% CI 0.11–0.28 mmol/l) in total cholesterol. Comparing the migrant with the rural male sibs, HOMA scores were 1.25 - (95% CI 1.16–1.34) fold higher, triglycerides were 1.08 - (95% CI 1.04–1.12) fold higher, and fasting glucose was 1.03 - (95% CI 1.02–1.05) fold higher. Adjustment for BMI attenuated these small differences between migrant and urban sibs. Differences were less marked between migrant and rural women.

The prevalence of obesity and of diabetes was examined by stratifying years since migration (>10 y versus ≤10 y). In men, but not women, there was weak evidence for linear trends in both obesity and diabetes from rural, more recent migrants, longer-term migrants, and urban dwellers (see Figures 1 and 2; Table 6). However, there was no strong statistical evidence of differences in odds of obesity or diabetes between the two migrant groups in either men or women.

Discussion
Our main hypothesis that rural-urban migrants have higher prevalence rates of obesity and diabetes than rural nonmigrants was strongly supported by our findings. However, our secondary hypothesis that migrants would have intermediate prevalence compared with urban dwellers was generally not supported. Our final hypothesis, that longer time since migration would be associated with increased risk was also not supported. Migration was associated with both an increased fat intake and reduced physical activity in both men and women, as compared with rural dwellers, and this likely contributed to the higher levels of obesity and diabetes observed in migrants. The major sex differences seen in our analyses were unexpected, with migration-associated differences in blood pressure, lipids, fasting blood glucose, and insulin only seen in men.
Adjustment for BMI in our analyses resulted in attenuation of the place-of-origin effect in men for blood pressure and lipids indicating that increases in these risk factors among migrants may be mediated by obesity. It is possible that in men more of the caloric intake comprises alcohol resulting in the observed sex differences in blood pressure and lipids. Further analyses comparing married couples who both migrated at the same time might be informative in understanding sex differences in response to migration as they would share duration of migration and certain lifestyle characteristics. Furthermore, women migrating within 10 y tended to be more obese, which may indicate selection into marriage by body size as traditionally women move from rural places of origin to join their husbands in urban areas.
Most previous migrant studies have compared the experiences of migrants with the host population but have not been able to make comparisons with the places from which migrants have come. Consequently these studies have not been able to dissect out whether differences observed are due to selection effects (e.g., a healthy migrant effect) or due to maintenance of traditional healthier life styles. Studies have also indicated that earlier age at exposure to migration may increase cardiovascular risk [33]–[37]. However, migration studies are not generally able to separate out the effects of age at migration from duration of residence in the host population [38]. Among Mexican Americans it has been documented that first generation immigrants have better health despite lower socioeconomic position than white Americans [39],[40], but this relative advantage declines with length of residency in the US [41],[42]. These findings suggest that there may be considerable latency of any effect of migration on health behaviours and outcomes. In our data there is some evidence that the impact of migration on obesity and diabetes is more rapid, occurring in the first decade of migration, which confirms findings from migrants to the US [43]. However, given the relatively small numbers of migrants in our study who had been in urban places for short durations, these findings should be viewed with caution and require replication. The effects of better access to health care (provided for factory workers and their coresident families) may also influence the propensity for diagnoses of diabetes and hypertension, which will be explored in future analyses.
Interpretation of migration studies is not straightforward as differences in health outcomes may reflect influences of place of origin, exposure to new environmental factors, effects of the process of migration itself, and also selection of those who migrate [13],[44]. Moreover, migration as an “exposure” is complex, involving a wide range of socioeconomic, behavioural, and environmental changes. Here we have used counterfactual reasoning that the rural nonmigrant sib provides an adequate control for the migrant sib, thereby dissecting out the effect of migration from the general secular drift in environmental exposures and changes in health behaviours affecting both urban and rural populations. Although the data were collected using a sib-pair design, the focus of the present analysis is the comparison between the three groups of interest: urban, migrants, and rural. Of these, only the migrant and rural groups are paired with each other (with a sibling in each group), while the urban group of siblings is an independent referent not paired to the other two groups. Future analyses will focus on the sib-pair differences in more detail as there is some indication that the migrant sibs tended to be taller than the nonmigrant rural sib (Table 5), which may indicate a selection effect. The sib-comparison design has been used previously to study migration effects on cardiovascular disease in a study of Irish migration to the US in the 1950s [45]. No differences in cardiovascular risk were found between the US residents, the immigrant Irish, or Irish living in Eire. These negative findings may have been an effect of rising cardiovascular risk in Ireland and falling risk in the US [46].
The most recent national data (2005) for India gave an adult prevalence for obesity (BMI >25 kg/m2, Indian standard) among employed people of 20% in urban areas and 6% in rural areas [5], which is markedly lower than our prevalence of over 50% and 20% in urban and rural areas, respectively. In a large survey of six cities, an age-adjusted diabetes prevalence of 12% was reported in 2000 [47], which is lower than our urban prevalence estimate of around 15%. A recent study in urban India reported a 15% prevalence of diabetes, comparable with our estimate [48]. In comparisons with the 3rd National Family Household Survey [5] and the 2001 Census [49], our study population had lower proportions of illiterate individuals and higher proportions of individuals with access to household facilities and assets, indicating a generally wealthier and more educated population than the national average in both rural and urban areas. This finding was expected given that our sample was drawn from employed people and their relatives. Our participants reflect those in the vanguard of social and epidemiologic change.
Our findings confirm a previous report of higher levels of serum insulin in urban as compared to the rural participants [50]. This suggests that some of the effects of urbanisation may be mediated through biological factors that result in increased secretion of insulin due to tissue resistance to its actions. Our findings are consistent with other studies of migrants where high levels of serum insulin have been reported in Asian Indians living abroad [51], in populations from other developing countries experiencing rapid urbanisation, and in migrant populations elsewhere [52].
Our response rates were lower than anticipated largely because of the logistic complexity of the sib-pair design. In a majority of cases these logistics involved at least a day to travel to the study centre and a day to travel back for the rural sib; in extreme cases up to 3 d travelling each way was involved. The differences in smoking prevalence between responders and nonresponders and nonconsenters were consistent with the play of chance. The prevalence of cardiovascular disease in the nonresponders was lower than in the responders and the nonconsenters. However, when considering those who took part with those who did not take part, no strong evidence of difference is apparent. While the response rate was suboptimal, from the data we have, there does not appear to be any major bias in health status or health behaviour. Response bias would influence our findings if there was differential nonresponse by health status and place of origin. Responders did report more cardiovascular disease than nonresponders but there was no difference in place of origin. This finding would be unlikely to alter the substantial differences we observed in prevalence of obesity and diabetes in the urban compared with rural samples. A further limitation is the cross-sectional design that does not permit longitudinal measurement to examine how cardiovascular risk and diabetes evolve over time in relation to migration. It is sometimes feasible to recruit participants into migration studies prior to migration (e.g., Luo [34], Tokelu islanders [35], Yi [36] studies), which have generally demonstrated that changes in risk factors are not explained by selection effects [14]. The forced migration of large populations living in the Three Gorges dam project in China is providing an opportunity to evaluate the effects of migration longitudinally on whole populations without any selection of who migrates [53],[54], but the process has been carefully planned and will not necessarily be generalisable to the effects of more typical migration experiences. If migration effects on health outcomes in India are as rapid as appears to be the case, establishing prospective studies in areas with high rural outflow to cities would be feasible.
Migrants (particularly in the workplace) and their families are a readily identifiable group who might be more motivated to take part in health promotion activities and treatment of risk factors than the general population. The scale of obesity and diabetes among these factory workers, their spouses, and rural sibs is very large, arguing for much wider adoption of population prevention activities as proposed by the WHO [55].
Supporting Information
Zdroje
1. RamachandranA
SnehalathaC
VijayV
2002 Temporal changes in prevalence of type 2 diabetes and impaired glucose tolerance in urban south India. Diabetes Res Clin Pract 58 55 60
2. MohanV
DeepaM
DeepaR
ShanthiraniCS
FarooqS
2006 Secular trends in the prevalence of diabetes and impaired glucose tolerance in urban south India – the Chennai Urban Rural Epidemiology Study (CURES-17). Diabetalogia 49 1175 1178
3. RamachandranA
SnehalathaC
BaskarADS
MaryS
KumarCKS
2004 Temporal changes in the prevalence of diabetes and impaired glucose tolerance associated with lifestyle transition occurring in the rural population in India. Diabetologia 47 860 865
4. SubramanianSV
Davey SmithG
2006 Patterns, distribution and determinants of under and over-nutrition: a population based study of women in India. Am J Clin Nutr 84 633 640
5. International Institute for Population Sciences (IIPS) 2007 National Family Health Survey (NFHS-3) Mumbai, India IIPS
6. SubramanianSV
PerkinsJM
KhanKT
2009 Do burdens of underweight and overweight coexist among lower socioeconomic groups in India? Am J Clin Nutr 90 369 376
7. FallCH
2001 Non-industrialised countries and affluence. Br Med Bull 60 33 50
8. PrenticeAM
MooreSE
2005 Early programming of adult diseases in resource poor countries. Arch Dis Childhood 90 429 432
9. McKayL
MacintyreS
EllawayA
2003 Migration and health: a review of the international literature.
PetticrewM
HuntK
Glasgow MRC Social and Public Health Sciences Unit MRC Social and Public Health Sciences Unit. Occasional paper series number 12
10. BarnettAH
DixonAN
BellaryS
HanifMW
O'HareJP
2006 Type 2 diabetes and cardiovascular risk in the UK south Asian community. Diabetologia 49 2234 2246
11. LandmanJ
CruickshankJK
2001 A review of ethnicity, health and nutrition-related diseases in relation to migration in the United Kingdom. Public Health Nutr 4 647 657
12. HaraH
EgusaG
YamakidoM
1996 Incidence of non-insulin-dependent diabetes mellitus and its risk factors in Japanese-Americans living in Hawaii and Los Angeles. Diabet Med 13 S133 S142
13. GushulakBD
MacPhersonDW
2006 The basic principles of migration health: population mobility and gaps in disease prevalence. Emerg Themes Epidemiol 3 3
14. ElfordJ
Ben-ShlomoY
2004 Geography and migration with special reference to cardiovascular disease. A life course approach to diabetes.
KuhD
Ben-ShlomoY
Life course approach to chronic disease epidemiology. 2nd edition Oxford Oxford University Press
15. Argeseanu CunninghamS
RubenJD
NarayanVKM
2008 Health of foreign-born people in the United States: a review. Health & Place 14 623 635
16. ReddyKS
PrabhakaranD
ChaturvediV
JeemonP
ThankappanKR
2006 Methods for establishing a surveillance system for cardiovascular diseases in Indian industrial populations. Bull World Health Organ 84 461 469
17. LyngdohT
KinraS
Ben-ShlomoY
ReddyS
PrabhakaranD
2006 Indian migration study group. Sib-recruitment for studying migration and its impact on obesity and diabetes. Emerg Themes Epidemiol 3 2
18. KuriyanR
PetracchiC
Ferro-LuzziA
ShettyPS
KurpadAV
1998 Validation of expedient methods for measuring body composition in Indian adults. Indian J Med Res 107 37 45
19. Indian Consensus Group 1996 Indian consensus for prevention of hypertension and coronary heart disease. A joint scientific statement of Indian Society of Hypertension and International College of Nutrition. J Nutr Environ Med 6 309 318
20. AlbertiKGMM
Zimmet PZ for the WHO consultation 2002 Definition, diagnosis, and classification of diabetes mellitus and its complications. Report of a WHO consultation. Part 1: diagnosis and classification of diabetes mellitus Geneva WHO
21. LevyJC
MatthewsDR
HermansMP
1998 Corrected homeostasis model assessment (HOMA) evaluation uses the computer programme. Diabetes Care 21 2191 2192
22. DusejaA
ThumburuKK
DasA
DhimanRK
ChawlaYK
2007 Insulin tolerance test is comparable to homeostasis model assessment for insulin resistance in patients with nonalcoholic fatty liver disease. Indian J Gastroenterol 26 170 173
23. ParrCL
VeierødMB
LaakeP
LundE
HjartåkerA
2006 Test-retest reproducibility of a food frequency questionnaire (FFQ) and estimated effects on disease risk in the Norwegian Women and Cancer Study (NOWAC). Nutr J 5 4
24. MarchioniDML
VociSM
de LimaFEL
FisbergRM
SlaterB
2007 Reproducibility of a food frequency questionnaire for adolescents. Cad Saude Publica 23 2187 2196
25. BharathiAV
SandhyaN
VazM
2000 The development and characteristics of a physical activity questionnaire for epidemiological studies in urban middle class Indians. Indian J Med Res 111 95 102
26. JamesWPT
SchofieldEC
1990 Human energy requirements: a manual for planners and nutritionists Oxford Oxford University Press
27. BharathiAV
KuriyanR
KurpadAV
ThomasT
EbrahimS
2010 Indian Migrants Study Group. Assessment of physical activity using accelerometry, an activity diary, the heart rate method and the Indian migration study questionnaire in south Indian adults. Public Health Nutr 13 47 53
28. SubramanianSV
Davey SmithG
SubramanyamM
2006 Indigenous health and socioeconomic status in India. PLoS Med 3 e421 doi:10.1371/journal.pmed.0030421
29. SubramanianSV
NandyS
IrvingM
GordonD
LambertH
2006 The mortality divide in India: the differential contributions of gender, caste, and standard of living across the life course. Am J Public Health 96 818 825
30. TrinderP
1969 Determination of glucose in blood using glucose oxidase with an alternative oxygen acceptor. Ann Clin Biochem 6 24 27
31. IzawaS
OkadaM
MatsuiH
HoritaY
1997 A new direct method for measuring HDL cholesterol which does not produce any biased values. J Med Pharm Sci 37 1385 1388
32. KirkwoodB
SterneJ
2003 Essential medical statistics. 2nd edition. Chapter 31. Analysis of clustered data Oxford Blackwell 361 367
33. SchoolingM
LeungGM
JanusED
HoSY
HedleyAJ
2004 Childhood migration and cardiovascular risk. Int J Epidemiol 33 1219 1226
34. PoulterNR
KhawKT
HopwoodBEC
MugambiM
PeartWS
1990 The Kenyan Luo migration study: observations on the initiation of a rise in blood pressure. BMJ 300 967 972
35. SalmondCE
JosephJ
PriorIAM
StanleyDG
WessenAF
1985 Longitudinal analysis of the relationship between blood pressure and migration: the Tokelau Island migrant study. Am J Epidemiol 122 291 301
36. HeJ
KlagMJ
WheltonPK
ChenJ-Y
MoJ-P
1991 Migration, blood pressure pattern, and hypertension: the Yi Migrant Study. Am J Epidemiol 134 1085 1110
37. GreenMS
PeledI
1992 Differences in the prevalence of hypertension by ethnic origin and age at immigration in a cohort of 5,146 Israelis. Am J Epidemiol 135 1237 1250
38. KinraS
2004 Can conventional migration studies really identify critical age-period effects? Int J Epidemiol 33 1226 1227
39. SundquistJ
WinklebyM
2000 Country of birth, acculturation status and abdominal obesity in a national sample of Mexican-American women and men. Int J Epidemiol 29 470 477
40. ScribnerR
1996 Paradox as paradigm - the health outcomes of Mexican-Americans. Am J Public Health 86 303 305
41. BarcenasCH
WilkinsonAV
StromSS
CaoY
SaundersKC
2007 Birthplace, years of residence in the United States, and obesity among Mexican-American adults. Obesity 15 1043 1052
42. KaplanMS
HuguetN
NewsomJT
McFarlandBH
2004 The association between length of residence and obesity among Hispanic immigrants. Am J Prev Med 27 323 326
43. AntecolH
BedardK
2006 Unhealthy assimilation: why do immigrants converge to American health status levels. Demography 43 337 360
44. MarmotMG
AdelsteinAM
BulusuL
1984 Lessons from the study of immigrant mortality. Lancet 1 1455 1458
45. KushiLH
LewRA
StareFJ
EllisonCR
el LozyM
1985 Diet and 20-year mortality from coronary heart disease. The Ireland-Boston Diet Heart Study. N Eng J Med 312 811 818
46. KelleherCC
LynchJ
HarperS
TayJB
NolanG
2004 Hurling alone? How social capital failed to save the Irish from cardiovascular disease in the United States. Am J Pub Health 94 162 169
47. RamachandranA
SnehalathaC
KapurA
VijayV
MohanV
2001 High prevalence of diabetes and impaired glucose tolerance in India: National Urban Diabetes Survey. Diabetologia 44 1094 1101
48. SadikotSM
NigamA
DasS
BajajS
ZargarAH
2004 The burden of diabetes and impaired glucose tolerance in India using the WHO 1999 criteria: prevalence of diabetes in India study (PODIS). Diabetes Res Clin Pract 66 301 307
49. Registrar General and Census Commissioner 2001 Census of India. Available: http://www.censusindia.net/ Accessed 5 January 2010
50. ChowC
CardonaM
RajuPK
IyengarS
SukumarA
2007 Cardiovascular disease and risk factors among 345 adults in rural India–the Andhra Pradesh Rural Health Initiative. Int J Cardiol 116 180 185
51. GreenhalghPM
1997 Diabetes in British south Asians: nature, nurture, and culture. Diabet Med 14 10 18
52. MisraA
GandaOP
2007 Migration and its impact on adiposity and type 2 diabetes. Nutrition 23 696 708
53. Institute of Psychiatry, Kings College London 2009 Project outline. Available: http://www.iop.kcl.ac.uk/projects/?id=10167 Accessed 22 December 2009
54. Sean-Shong Hwang YueCao
XiJuan
2008 The short term social, economic and health impact of China's Three Gorges Dam Project: a prospective study. Annual Meetings of American Sociological Association in Boston, Massachusetts; 1–4 August 2008; Available: http://www.allacademic.com//meta/p_mla_apa_research_citation/2/4/1/7/0/pages241702/p241702-1.php Accessed 22 December 2009
55. World Health Organisation 2004 Global strategy on diet, physical activity and health. WHO, Geneva
Štítky
Interní lékařstvíČlánek vyšel v časopise
PLOS Medicine
2010 Číslo 4
- Ivabradin zlepšuje kvalitu života starších pacientů se srdečním selháním
- Fixní kombinace kandesartan/amlodipin v terapii arteriální hypertenze
- Inovace v hojení ran: krytí Zetuvit Plus Silicone Border pro optimální management exsudátu z ran
- Rána vizitkou (nejen) chirurga
- Patogeneze vzniku keloidní jizvy
Nejčtenější v tomto čísle
- Preoperative/Neoadjuvant Therapy in Pancreatic Cancer: A Systematic Review and Meta-analysis of Response and Resection Percentages
- Economic Appraisal of Ontario's Universal Influenza Immunization Program: A Cost-Utility Analysis
- China's Engagement with Global Health Diplomacy: Was SARS a Watershed?
- Laboratory Capacity Building in Asia for Infectious Disease Research: Experiences from the South East Asia Infectious Disease Clinical Research Network (SEAICRN)
Zvyšte si kvalifikaci online z pohodlí domova
Mazová zátka a její řešení
nový kurzVšechny kurzy