
Trait Variation in Yeast Is Defined by Population History
A fundamental goal in biology is to achieve a mechanistic understanding of how and to what extent ecological variation imposes selection for distinct traits and favors the fixation of specific genetic variants. Key to such an understanding is the detailed mapping of the natural genomic and phenomic space and a bridging of the gap that separates these worlds. Here we chart a high-resolution map of natural trait variation in one of the most important genetic model organisms, the budding yeast Saccharomyces cerevisiae, and its closest wild relatives and trace the genetic basis and timing of major phenotype changing events in its recent history. We show that natural trait variation in S. cerevisiae exceeds that of its relatives, despite limited genetic variation, and follows the population history rather than the source environment. In particular, the West African population is phenotypically unique, with an extreme abundance of low-performance alleles, notably a premature translational termination signal in GAL3 that cause inability to utilize galactose. Our observations suggest that many S. cerevisiae traits may be the consequence of genetic drift rather than selection, in line with the assumption that natural yeast lineages are remnants of recent population bottlenecks. Disconcertingly, the universal type strain S288C was found to be highly atypical, highlighting the danger of extrapolating gene-trait connections obtained in mosaic, lab-domesticated lineages to the species as a whole. Overall, this study represents a step towards an in-depth understanding of the causal relationship between co-variation in ecology, selection pressure, natural traits, molecular mechanism, and alleles in a key model organism.
Published in the journal:
. PLoS Genet 7(6): e32767. doi:10.1371/journal.pgen.1002111
Category:
Research Article
doi:
https://doi.org/10.1371/journal.pgen.1002111
Summary
A fundamental goal in biology is to achieve a mechanistic understanding of how and to what extent ecological variation imposes selection for distinct traits and favors the fixation of specific genetic variants. Key to such an understanding is the detailed mapping of the natural genomic and phenomic space and a bridging of the gap that separates these worlds. Here we chart a high-resolution map of natural trait variation in one of the most important genetic model organisms, the budding yeast Saccharomyces cerevisiae, and its closest wild relatives and trace the genetic basis and timing of major phenotype changing events in its recent history. We show that natural trait variation in S. cerevisiae exceeds that of its relatives, despite limited genetic variation, and follows the population history rather than the source environment. In particular, the West African population is phenotypically unique, with an extreme abundance of low-performance alleles, notably a premature translational termination signal in GAL3 that cause inability to utilize galactose. Our observations suggest that many S. cerevisiae traits may be the consequence of genetic drift rather than selection, in line with the assumption that natural yeast lineages are remnants of recent population bottlenecks. Disconcertingly, the universal type strain S288C was found to be highly atypical, highlighting the danger of extrapolating gene-trait connections obtained in mosaic, lab-domesticated lineages to the species as a whole. Overall, this study represents a step towards an in-depth understanding of the causal relationship between co-variation in ecology, selection pressure, natural traits, molecular mechanism, and alleles in a key model organism.
Introduction
An overall aim in modern biology is to achieve an in-depth understanding of how selection for certain traits in the context of an organism's ecology favors specific mechanistic changes in the cell machinery and establish distinct genetic variants within populations. The budding yeast Saccharomyces cerevisiae and its closest relatives are expected to become the first eukaryotic organisms for which such a coherent understanding of causal relationships is to be achieved. This is primarily thanks to the uniquely detailed molecular knowledge that have been accumulated on this organism's internal cellular machinery, which in turn is due to the ease with which artificial genetic manipulation can be conducted [1]. Through the establishment of vast collections of mutants carrying single and double gene knockouts [2], [3], temperature sensitive alleles [4] and promoter constructs that allow controlled gene expression [5]–[7], budding yeast has become the flagship of reverse genetics. However, the fact that the bulk of our knowledge on yeast gene-trait relationships derives from studies on artificial gene constructs in a few genetically mosaic and partially lab-domesticated strains is cause for concern. Mosaic lab strains constitute artificial combinations of alleles that never jointly have been exposed to natural selective pressure and thus poorly reflect the natural state of the species. In addition, individual gene knockouts only to a very limited extent reflect the bulk of natural genetic variation which arises in the form of promoter, missense and gene duplication mutations rather than complete gene loss. Awareness of the limitations of artificial variation in lab domesticates has motivated an increasing number of endeavors focusing on the genetic basis for natural trait variation [8]–[13]. However, the lack of coherent charts of natural trait variation in S. cerevisiae has impeded a deeper understanding of the relation between ecology, selective pressure, traits and molecular mechanisms in this key model organism. In its natural ecological setting, baker's yeast has a peculiar life history dominated by clonal reproduction; it only completes one meiotic cycle for every 1000 mitotic divisions and 99% of these sexual cycles correspond to self-fertilization [14], [15]. In fact, it has been suggested that natural yeasts are remnants of repeated population bottlenecks in essentially clonal lineages [1]. Such a life history dominated by mitotic proliferation implies a strong evolutionary influence of genetic drift and predicts that trait variation is largely defined by the genetic history of each population. To test this prediction, we charted a highly resolved map of natural trait variation in S. cerevisiae and its closest non-domesticated relative Saccharomyces paradoxus, species that are separated by about 2 billion generations [1]. This design allowed the quantification of trait variation in relation to source environment and genetic history and the tracing of the molecular basis for between population variations down to individual alleles. We found that trait variation in budding yeast is largely defined by population rather than source environment, in support of recent population bottlenecks and a large influence of genetic drift.
Results
Co-variation of the rate and efficiency of proliferation in natural yeast isolates
To exhaustively survey natural trait variation in the partially domesticated S. cerevisiae and its closest wild relative S. paradoxus, we compared 39 sequenced S. cerevisiae isolates from a wide variety of geographic locations and sources to an equal number of sequenced S. paradoxus isolates. These strains represented all known populations in S. cerevisiae (Malaysian, West African, North American, European, Sake) and S. paradoxus (American, Far East, European) [16]. To provide an overview of the complete Saccharomyces sensu stricto clade, a smaller number of isolates from Saccharomyces kudriavzevii, Saccharomyces bayanus, Saccharomyces mikatae and the recently identified Saccharomyces arboricolus [17] was also included. Isolates were subjected to high-resolution quantification of mitotic proliferative ability across 200 environments; these were selected to represent components of natural yeast habitats, such as commonly found carbon and nitrogen sources, plant and microbial toxins and metabolites, and shifting availability of vitamins and minerals (Table S1). From high density mitotic growth curves, the fitness components lag of proliferation, rate of proliferation (population doubling time) and efficiency of proliferation (population density change) were extracted, providing 600 distinct measures of organism-environment interactions (Figure 1A, Table S2) [18], [19]. Overall, we found the rate and efficiency of yeast mitotic proliferation to be strongly correlated (r = 0.77) (Figure 1B). For 84% of the environments, the Pearson correlation exceeded 0.5, and for only two milieus, proliferation in absence of either copper or magnesium, was the correlation negative. This refutes assumptions of an evolutionary trade-off between rate and efficiency [20] but is in line with reports on artificial loss-of-function mutants in S. cerevisiae [21]. No evidence of a general adherence to a 1∶1 correlation between rate and the square root of the efficiency was found, which would be expected if the rate was maximized in each environment and solely restricted by biomass yield [22]. Rather, the slope of the correlation was highly environment dependent (Figure S1). Taken together, this suggests that the rate and efficiency of proliferation in yeast have similar underlying genetic structures. In contrast, the time to initiate proliferation showed clear evidence of being physiologically and evolutionary distinct since no correlation (r<0.02) was observed to any of the two other variables (Figure 1B).

Two phenetic groups in the Saccharomyces sensu stricto clade
From species trait averages, it was evident that the major phenetic divide within Saccharomyces sensu stricto is the clear separation between S. paradoxus, S. cerevisiae and S. mikatae on the one hand and S. kudriavzevii, S. bayanus and S. arboricolus on the other - with the non-sensu stricto S. castellii as an expected outlier (Figure 1C). These two clades differed significantly (clade average; Bonferroni corrected Student's t-test, p<0.1) over 42% of all traits. Remarkably, 99% of these deviating traits corresponded to inferior performance of the S. kudriavzevii, S. bayanus and S. arboricolus group (Figure 1D). Most (62%) of these low performance traits remained significant (clade average; Bonferroni corrected Student's t-test, p<0.1) when normalizing for proliferation in basal conditions, suggesting that they are not the exclusive consequence of a general proliferation defect (Figure S2). Interestingly, although the deficiencies encompassed all types of ecologically relevant features (Figure 1E), they were clearly underrepresented among carbon sources (Fisher's exact test, p = 7E-8). This suggests early optimization of proliferation on a wide range of carbon substrates in the common ancestor of sensu stricto and that this selective pressure has been mostly maintained through the recent evolutionary history. Among the traits with the largest phenotypic variances between sensu stricto species was tolerance to citric acid (a dominant fruit organic acid), growth at high temperatures and growth in synthetic wine must, suggesting that these traits may have corresponded to important habitat differences during species divergence (Figure S3).
Between S. kudriavzevii, S. bayanus and S. arboricolus, overall pair-wise trait similarity was extremely high (Pearson correlation, r = 0.82–0.85) despite that these species diverge genetically as much from each other as from the remaining sensu stricto species [16], [23]. Hence, surprisingly much of the accumulated sequence variation in this clade appears to be neutral for the studied traits. Given that these species are mostly allopatric [24], the most attractive interpretation of their trait similarity is occupation of similar habitats in different geographic locations. S. paradoxus, S. cerevisiae and S. mikatae are genetically more similar; nevertheless, trait divergence between these species was much higher (Pearson correlation, r = 0.55–0.69). In fact, S. cerevisiae and S. paradoxus diverged significantly (species average; Bonferroni corrected Student's t-test, p<0.1) for more than 18% of all traits, in contrast to conventional wisdom that marks the two species as phenotypically indistinguishable [25]. The vast majority of environment-dependent deviations between the two species placed S. cerevisiae as a superior performer (Figure 1F), even though no difference in proliferation was observed in basal conditions (Figure S4A). This superior performance included better ability to utilize the sugar maltose and higher tolerance to both temperature and a wide range of plant and microbial toxins (Figure S4B). The two unique examples where S. paradoxus performed better than S. cerevisiae were superior utilization of the sugar mannitol and extreme tolerance to oxalic acid, an organic acid prevalent in oak bark, a typical S. paradoxus habitat (Figure S4C, D). However, it should be noted that medium and test conditions have been tailored to S. cerevisiae and thus the generally inferior performance of S. paradoxus may reflect overall differences in physiology that confer media or test condition dependent defects manifested only under stress.
Trait variation within S. cerevisiae is defined by the population history
S. cerevisiae differed from S. paradoxus not only in its on average better tolerance to environmental stress but also in the degree of intra-species trait variability which exceeded variance in S. paradoxus by more than 60% despite lower genetic diversity (Figure S5A, S5B). The difference was consistent over the tested populations (Figure S5C). However, it is unknown to what extent we have sampled the existing global variation in each species and it cannot be excluded that future sampling of S. paradoxus will increase its trait variability. Utilization of less common carbon substrates (melibiose and maltose), growth in absence of particular vitamins (biotin and pantothenate) and tolerance to high concentrations of certain metabolites (ethanol, methanol and formaldehyde) showed the strongest variations within S. cerevisiae, suggesting niche variations with a large impact on trait divergence (Figure S6). The overall correlation between genetic and phenotypic similarity within S. cerevisiae was substantial (Pearson r = 0.52) and even higher (Pearson r = 0.66) when excluding mosaic isolates for which genetic distances have no straight-forward evolutionary interpretation. Hierarchical clustering of all yeast isolates based on the complete array of traits also provided groups that essentially followed species and population boundaries, with mosaic traits resembling those of the parent population donating the major part of the genome (Figure 2, Figure S7A–S7C). In fact, 45% of all traits were distinct for one individual population (FDR = 2%). In contrast, only 1.2% of traits were distinct (FDR = 2%) for an individual source, i.e. neither clinical isolates nor industrial strains from processes such as baking or fermentation showed trait coherence within groups (Figure 2). Principal component analysis confirmed the stronger influence of population than source on S. cerevisiae traits (Figure S8). Notably, commonly used S. cerevisiae lab strains were extremely diverse, reflecting that lab domestication either has proceeded along very different routes or has had little overall influence (Figure S9). The few source-linked phenotypes figured among wild S. cerevisiae isolates, which showed low respiratory capability (glycerol, ethanol and arabinose utilization) and low tolerance to copper, suggesting that vigorous respiration and copper resistance may have been principal domestication traits (Figure S10). Disconcertingly, the yeast universal type strain, S288C, constituted the most atypical S. cerevisiae strain in the screen (Figure 3), diverging strongly from the average S. cerevisiae strain by e.g. showing superior proliferative rate on rich medium, superb maltose utilization but lower than average ability to tolerate very high ethanol concentrations (Figure S11). Given the wide-spread use of S288C as a norm for S. cerevisiae, this phenotypic uniqueness is a concern.


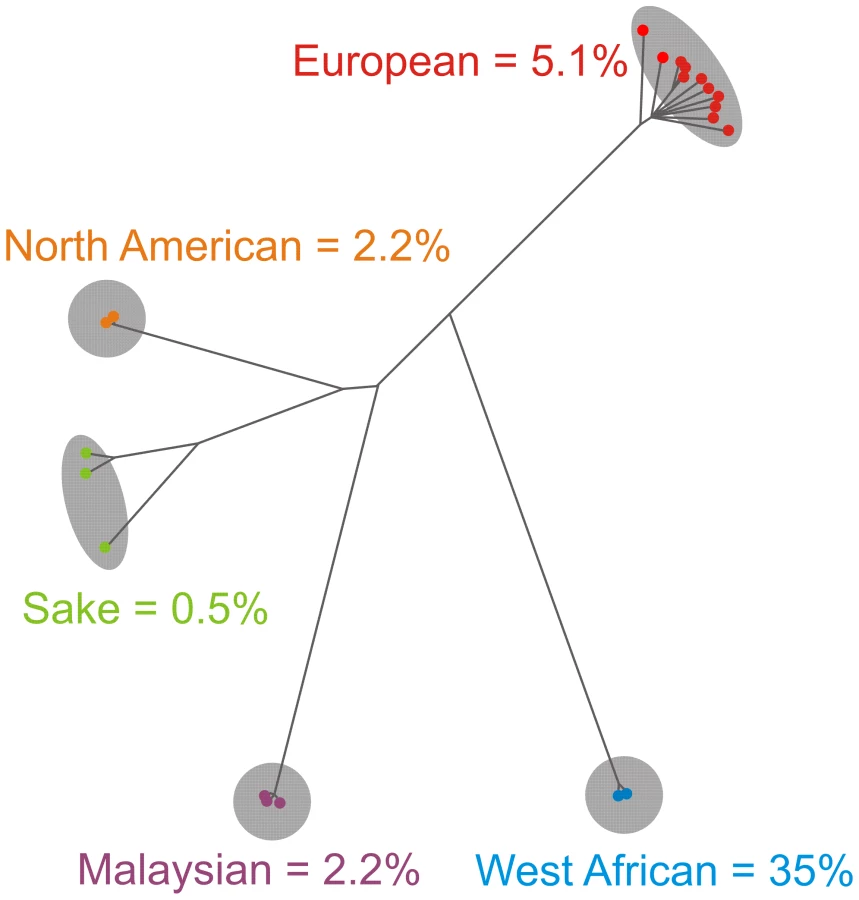
The West African S. cerevisiae population is phenotypically unique
From an evolutionary perspective, the most interesting feature of an organism-wide phenotype map is the variation between phylogenetically distinct groups of individuals, i.e. in S. cerevisiae the Malaysian, West African, Sake, European and North American populations. Mapping our phenotypic information on the recently established population genomics tree [16], we can reconstruct the phenotypic history of S. cerevisiae. The most dramatic event in the S. cerevisiae trait history relates to the West African population, which deviated significantly (FDR = 2%) from other S. cerevisiae clean populations over 35% of all traits (Figure 4). Remarkably, all but one of the West African population traits represented severe reproductive deficiencies, including extremely poor utilization of galactose and hypersensitivity to high temperatures (Figure S12). This suggests extensive genome degeneration following relaxation of ancestral selective pressures. Our previous linkage analysis on crosses of a West African isolate to the other clean lineages [26] showed that its many proliferative deficiencies were due to environment-specific large effect QTLs widely dispersed over the genome (Figure S13). A less pronounced phenotypic burst distinguishes the branching-off of the European population (Figure 4). The European population traits encompassed phenotypes that may reflect man-directed selection for industrial production, such as high respiratory capability (ethanol growth), good proliferation in synthetic wine must, tolerance to tartaric acid (highly concentrated in grapes) and tolerance to copper, the latter presumably deriving from early brewery cultivation in copper containers and anti-parasitic spraying of vineyards with copper sulphate [27] (Figure S12). Not surprisingly, industrial yeasts are mostly European isolates or derivates thereof (Table S1). The European strains were also uniquely tolerant to Na+ and Li+, a trait which because of pleiotropy of the causal locus may not reflect adaptation to a saline niche (see below). The other clean populations were phenotypically less distinct (Figure 4). The Malaysian population displayed superb utilization of melibiose and mannitol, storage carbohydrates common in many tropical plants [28] (Figure S12), whereas the North American oak isolates were essentially unable to metabolize maltose and showed supreme tolerance to oxalic acid. The phenotypically more diverse Sake population, where the K11 isolate deviates both genetically and phenotypically from Y9 and Y12 (Figure 2), featured good utilization of glycerol and excellent proliferation in absence of biotin, the latter of which has been recently reported [29].
Trait variation patterns differ between S. paradoxus and S. cerevisiae
As for S. cerevisiae, trait variation in S. paradoxus agreed well with recently reported population boundaries based on genome sequences [16]. However, although unique phenotypes were observed for each of the American, European and Far East populations, no phenotypic event as dramatic as the one distinguishing the West African S. cerevisiae population was detected in S. paradoxus (Figure S14). Moreover, traits that were specific for individual S. paradoxus populations did not agree with traits that were specific for individual S. cerevisiae populations (Fisher's exact test, p = 0.11). For example, whereas differences in the ability to utilize different carbon sources were prevalent between individual isolates in S. cerevisiae, such variations were virtually absent in S. paradoxus (Figures S11, S14). In contrast, S. paradoxus populations varied more between each other in the ability to tolerate the absence of important vitamins and minerals. Overall, the American population, which covers a vast geographical latitude range, was the phenotypically most distinct, featuring superior tolerance to the toxin canavanine and the metabolite selenomethionine, both affecting the protein folding machinery, but reduced tolerance to superoxide anions as generated by the insecticide paraquat. The genetically distinct South American sub-population, previously regarded as a separate species and referred to as S. cariocanus and here represented by the isolates UFRJ50791 and UFRJ50816, was unique also phenotypically, suggesting either adaptation to a different environmental niche or genetic drift due to genetic isolation from other American isolates (Figure 2). The European population primarily diverged in its metal ion tolerance profile, with low tolerance to lithium and cadmium but high tolerance to arsenic in the form of arsenite, which may reflect soil composition. The Far East population had extremely low performance in absence of biotin, suggesting occupation of a biotin rich habitat (Figure S14). Interestingly, neither traits separating the S. paradoxus populations, nor traits separating the S. cerevisiae populations, overlapped more than chance expectation (Fisher's exact test, p>0.12) with traits separating the two species from each other, implying that different selective pressures have driven trait divergence at different time points in the history of these two species.
Genetic basis for population specific traits in S. cerevisiae
The considerable divergence between S. paradoxus populations resulted in that offspring from crosses over population borders suffered drastic reductions in proliferative ability, as exemplified by on average 42% slower rate of proliferation in optimal conditions of F1 recombinants deriving from a cross between the American YPS138 and the European CBS432. This population incompatibility prevented linkage analysis of population specific traits in S. paradoxus. Such limitations do not hamper genetic dissection of S. cerevisiae population traits, with the exception of the Malaysian population which is effectively reproductively isolated [28]. However, the number of SNPs detected in the 36 partially sequenced S. cerevisiae isolates exceeds 230.000 [16], preventing a full scale genome-wide association analysis over all genetic variations. To circumvent this “large number of hypotheses, small number of samples” situation, we first performed a genome-wide association analysis limited to genetic variation suspected of having strong phenotypic consequences: i.e. gene presence variations, non-sense mutations (premature stop codons), and gene Copy Number Variations (CNV) (Tables S3, S4, S5). The scored gene-phenotype associations were cross-referenced to a global linkage map covering crosses between representatives of the clean lineages examined in 24 environments where strong population specific phenotypes were scored [26]. Where associations agreed with QTL regions, candidate genetic variations were retained as high confidence hits.
One of the most distinct West African traits was the extremely poor utilization of galactose, a sugar that is ubiquitous in natural gum and plant mucilage of e.g. cactus, but not present in an accessible form in grapes or other fruits. The poor utilization of galactose in the West African strain associated to a premature stop codon in the transcriptional regulator GAL3, which acts as a positive regulator to control galactose-induced expression of galactose utilization enzymes [30] (Figure 5A, 5B). Linkage analysis of the galactose utilization ability in crosses involving the West African DBVPG6044, as well as poor proliferation of the hemizygote BY4741 (gal3Δ)×DBVPG6044 on galactose, confirmed this association (Figure 5C, 5D). In S. kudriavzevii and in some non sensu stricto yeasts, loss of the complete galactose system has been observed [31], [32]. Multiple mutations throughout the GAL system in West African strains, notably frameshifts in GAL2 and GAL4, suggested a similar loss of selective constraints following emergence of the GAL3 stop codon (Figure 5A). However, unperturbed galactose growth of the hemizygotes (galxΔ)×DBVPG6044 showed that, except for GAL3, all GAL genes, including GAL2 and GAL4, were fully functional in DBVPG6044 (Figure S15A, S15B). Interestingly, the GAL3 stop codon was not found outside the West African population and the West African derived mosaics SK1 and Y55. Rather, the complete inability of some mosaic strains, such as 273614N, to utilize galactose was due to selective loss of GAL1 (Figure 5E), whereas the severe galactose deficiency of S288C agreed with a well-known point mutation in the galactose permease GAL2 [33]. Hence, inactivation of the galactose utilization pathway has occurred as multiple, independent events in the recent S. cerevisiae history.

The association analysis also showed that the ability to utilize the related, but rare, sugar melibiose, a disaccharide of galactose and glucose, was unique for the Malaysian lineage, and was completely associated with the presence of a single gene, the melibiase encoding MEL1 (Figure 5F). The poor melibiose utilization in the West African population, which contains a MEL1 with no non-synonymous variations but only performed marginally better than strains missing MEL1, was in this context surprising. The hemizygotes BY4741 (galxΔ)×DBVPG6044 showed normal melibiose proliferation, demonstrating that the melibiose utilization inability is not due to defects in the GAL system which is known to regulate MEL1 expression [34] (Figure S15C). Interestingly, the MEL1 of the West African and Malaysian populations have diverging evolutionary origins, with the West African MEL1 deriving from a recent introgression of the S. paradoxus MEL1 (Figure 5G), potentially explaining the inferior melibiose utilization of the West African population.
The drastically elevated copper tolerance of the European and Sake lineages associated strongly with a copy number variation of the copper binding metallothionein CUP1 with limited contribution from other loci: the more CUP1 genes, the higher the copper tolerance (Figure 6A). This association was confirmed by linkage analysis of crosses between populations with high and low performance on copper (Figure 6B). Tandem amplifications of CUP1 is well known to mediate copper tolerance in adapting yeast populations during artificial selection for this trait [35]. The emergence of the CUP1 CNV in both the European and Sake lineages, but not in other S. cerevisiae populations nor in S. paradoxus, suggested that the CUP1 CNV may be a true case of convergent evolution due to man-directed selection for industrial production. Such a model postulates independent amplification events which most likely would result in variable amplification breakpoints. We compared amplification breakpoints in the Sake strain Y12 and the mostly European S288C and W303, and found the amplified CUP1 segments in these lineages to be clearly distinct, providing strong support for independent events and thus convergent evolution (Figure 6C, Figure S16). S. paradoxus isolates consistently showed low CUP1 copy numbers and also low tolerance to copper.

The European population's extreme tolerance to Li+ and Na+ associated to a CNV of the ENA Na+ exporter (Figure 7A), supporting our own (Figure 7B) and recently published linkage data [36]. Sequence comparison to S. paradoxus showed that the single ENA gene in the non-European S. cerevisiae lineages, recently found in a mosaic strain and referred to as ENA6 [37], and the three ENA copies in the laboratory strain S288C, have diverging evolutionary origins. The phylogeny strongly supports a recent introgression of one of the two S. paradoxus ENA variants into the S. cerevisiae European lineage (Figure 7C, Figure S17), as suggested [38]. Transfer of ENA6 to a European mosaic in which the three native ENA genes (ENA1,2,5) had been deleted clearly demonstrated the inferior performance of the ENA6 allele. In fact, ENA6 did not confer any tolerance to low concentrations of Na+ or to Li+, and at high Na+ concentrations only alleviated the efficiency, but not the rate, proliferation defect (Figure 7D). However, the selective pressure maintaining the ENA introgression and copy number variation need not necessarily have been for Na+ or Li+ tolerance; both association and linkage analysis [26] connected the ENA CNV with multiple other traits. Poor performance of the ENA1,2,5 triple deletion during exposure to K+, Cu+, alkali stress and the toxic metabolites methylglyoxal and DHA confirmed that the ENA introgressed from S. paradoxus confers a distinctly pleiotropic advantage (Figure 7E). The ENA6 allele had either substantially lower or adverse effects on these traits, supporting the notion that it represents a selectively weaker allele. This degree of pleiotropy of the recently emerged ENA amplification is surprising, given that adaptive mutations in pleiotropic genes are expected to be rare [39].

Hydroxyurea tolerance associated to an inactivating stop codon early in the reading frame of the functionally unknown HUR1 in the West African and Malaysian populations (Figure S18). HUR1 overlaps the ion exporting ATPase PMR1 (coding on opposite strands) and deletion mutants of both HUR1 and PMR1 are highly hydroxyurea sensitive [40]. However, the early stop codon in HUR1 with only a neutral amino acid change, F947P, in the poorly conserved C-terminal region of PMR1 suggests that the genetic variation in HUR1 is indeed the causative allele, providing a rare example of two functional overlapping genes that potentially are maintained by diverging selective pressures.
Discussion
A fundamental shortcoming of modern biology is that our understanding of model organisms, such as baker's yeast, rests heavily on studies of a few lab domesticated isolates with mosaic genomes, i.e. natural trait variation in these species remains a largely unmapped territory. To address this issue, we charted an exhaustive map of the landscape of mitotic proliferation traits in S. cerevisiae and its closest relatives, revealing astounding trait diversity between and within these species. Overall, trait variation in S. cerevisiae exceeded that of its never domesticated cousin S. paradoxus, despite substantially lower genetic variation. This situation is reminiscent of what has been observed for morphological and behavioral traits in Canis lupus, where a large variation due to recent population bottlenecks exists among domesticated dogs relative their wolf cousins with no corresponding increase in overall genetic variability [41]. Periods of small population sizes promote trait variation between populations by allowing deleterious, pleiotropic and large effect alleles, which rarely are adaptive in longer evolutionary perspectives, to reach high frequency by genetic drift [39]. The idea that natural yeast genomes are remnants of repeated bottlenecks in essentially clonal populations has recently been contemplated [1]. In fact, the natural life cycle of budding yeasts with one sexual cycle only every 1000 mitotic divisions and only 1% of these sexual cycles corresponding to non-self-fertilization [14], [15] makes these unicellular eukaryotes especially susceptible to genetic drift. The high trait variation in S. cerevisiae reinforces the idea of S. cerevisiae populations being remnants of recent bottleneck events. Such a bottleneck hypothesis is also supported by trait variation in Saccharomyces sensu stricto largely following phylogenetic boundaries. First, the six species were phenotypically clearly delineated, an observation that is surprising given wide-spread sympatry [13], [24], [42], [43] and the traditional view that at least S. paradoxus and S. cerevisiae are phenotypically indistinguishable [25]. Secondly, trait variation within S. cerevisiae essentially followed the population structure with little apparent influence from source environments. This is in line with a strong impact of genetic drift, such as imposed by recent bottlenecks, but contrasts against earlier reports that describe links between sources and the traits of specific yeast lineages [10], [24], [44]–[46]. The here reported strong effect of population genetic history on traits suggests that these source-to-trait links may either be rare exceptions or due to a confounding influence from a shared population history.
A predicted consequence of recent population bottlenecks is the prevalence of large effect and deleterious alleles that is otherwise typically weeded out by long-term evolution [39]. Hence, the recent allele frequency based estimate that as much as 12% of coding SNPs and 7% of non-coding SNPs in S. cerevisiae are deleterious provides strong support for recent bottlenecks in this species [38]. We found abundant experimental evidence for the prevalence of conditionally deleterious alleles in S. cerevisiae, most notably in the phenotypically extreme West African population. This lineage showed drastically reduced mitotic performance in 35% of environments, many of which are ubiquitous in a range of biotopes. These low performance traits mapped to a variety of large effect loci, two of which, premature translational termination signals in GAL3 and HUR1, could be traced to loss-of-function mutations in individual genes. The GAL3 linked galactose utilization defect is especially interesting; although recent loss of the ability to utilize galactose has occurred in multiple S. cerevisiae lineages, the genetic basis for this loss diverge between lineages in the form of loss-of-function mutations in either of GAL1, GAL2 or GAL3. This is in line with that even when traits are similar between populations, the underlying genetic structures typically vary between lineages with the vast majority of QTLs being private to one individual population [26], as expected given a bottleneck hypothesis. Here, population specific, large effect alleles were also detected in the other four S. cerevisiae populations. Notably, yeast domestication traits, traditionally associated with wine/beer production, were specific for the European population and mapped to individual large affect loci. Hence, it is conceivable that many domestication traits are consequences of genetic drift in the European population and pre-dates, or coincides with, the emergence of large scale wine and beer production. However, there are cases of apparent man-enforced adaptive evolution, suggesting that genetic drift does not completely define the yeast genotype-phenotype map. Notably, we show that CUP1 amplifications, which underlie natural variation in yeast copper tolerance, have arisen separately in the European and Sake populations. It cannot be excluded that a smaller number of pleiotropic alleles, such as the well known amino acid polymorphism in MKT1 that affects a wide variety of traits [47], contribute disproportionately to the strength and frequency of population specific traits. However, we found the major QTLs that define population specific traits to be essentially distinct for specific environments, suggesting that the overall influence of pleiotropic alleles is minor [26].
Regardless of underlying ecological and population history determinants, the massive trait variation in S. cerevisiae is disconcerting, given the implicit assumption that studies in one or a few laboratory strains of a model organism may provide a general understanding of gene - environment interactions in the species as a whole. Even the set of genes that are essential for viability in S. cerevisiae, the most fundamental of traits, was recently reported to vary by more than 5% between two related isolates [48], underscoring this concern. The problem is exacerbated by the universal S. cerevisiae type strain S288C proving to be a highly atypical representative of the species. Although it was previously known that S288C constitutes an outlier for certain traits, e.g. with regards to its low sporulation capacity [49] and high transposon content [16], the abnormality of this strain in relation to wild and industrial isolates over a wide array of traits was unexpected. The mosaic genome structure of S288C may contribute to its abnormal traits; although predominantly derived from European stock, it also contains genetic material from a plethora of other progenitors [16], [50]. The astounding diversity of yeast traits and the limited representativeness of the universal reference strain calls for care in extrapolating gene-phenotype links derived from a single lab-domesticated and mosaic individual to general statements on the ecology and physiology of the organism. This stresses the need for application of the powerful yeast molecular toolbox to a wider diversity of genetic backgrounds.
Materials and Methods
Strains
Diploid isolates of S. cerevisiae, S. paradoxus, S. arboricolus, S. kudriavzevii, S. bayanus, S. mikatae and S. castellii were collected from diverse sources and geographical locations as described [16] and as detailed in Table S1. Hybrid strains for tests of hemizygote growth were prepared by mating a haploid parental strain to the single deletion strain of interest in the BY4741 background; hybridization was verified by the ability to sporulate. The ENA1,2,5 triple deletion strain BYT5 (ena1Δ2Δ5Δ::loxP, BY4741 derivative) was a kind gift from Hana Sychrová of the Institute of Physiology Academy of Sciences of the Czech Republic. The West African ENA6 was amplified by PCR using primers as described (Table S6) and incorporated into the URA3 locus of BYT5 using standard molecular biology methods.
Phenotyping
Strains were subjected to high throughput phenotyping by micro-cultivation (n = 2) in an array of environments (Table S2) as described [19]. Briefly, strains were inoculated in 350 µl of Synthetic Defined (SD) medium (0.14% yeast nitrogen base, 0.5% ammonium sulfate and 1% succinic acid; 2% glucose; 0.077% Complete Supplement Mixture (CSM, ForMedium), pH set to 5.8 with NaOH or KOH) and incubated for 48 h at 30°C. Experiment-dependent variations in this protocol are described in Text S1. Pre-cultures were diluted 35× to an OD of 0.03–0.15 in 350 µL of SD medium and cultivated (n = 2) at 30.0° for 72 h in a Bioscreen analyzer C (Growth curves Oy, Finland). Optical density was measured every 20 minutes using a wide band (450–580 nm) filter. Flocculation, which is a serious problem in liquid cultivations of wild yeast cells in higher cultivation volumes, was not observed. The mitotic proliferation rate (population doubling time), lag (population adaptation time) and efficiency (total change in population density) were extracted from high density growth curves and log2 transformed. Relative fitness variable for each strain and trait, LSCij, were calculated as:wtkj is the fitness variable of the k:th measurement of the wildtype for trait j, xij is the measure of strain i for trait j and r indicates the run. The measure for proliferation efficiency was inverted to maintain directionality between fitness components. Derived log2 relative proliferation variables were used for all statistical analysis, except where otherwise stated. The average coefficient of variation between replicates, considering all variables and environments, equalled 11.6%, (see Dataset S1).
Statistical analysis
Strains W303, YJM789, RM11 and YIIc17_E5, which contained known or suspected auxotrophies with potential confounding effects on traits, were excluded from all statistical comparisons and calculations of trait and species averages. A two-tailed Student's t-test with equal variance assumptions was used for two-group comparisons. Pearson correlation coefficients were used for correlation analysis, Fisher's exact test was used for tests of enrichments and tests of hypergeometric distributions; Bonferroni corrections were applied in multiple hypotheses testing situations. Population and source specific traits were defined using the False Discovery Rate [51]. A threshold of 2% was applied; however, the relation between the number of population and source specific traits was essentially constant in the FDR interval 0.5–5%. Hierarchical clustering, as outlined in [52], was performed using data centred over each trait and a Pearson correlation coefficient similarity metric. Group clustering was achieved using group averages. Some of the S. kudriavzevii, S. bayanus and S. arboricolus isolates were not available at the start of the experimental series; consequently, data for these strains is missing in 30% of environments. Missing measurements were treated as “missing data” throughout the analysis. To ensure that this did not affect conclusions, analyses relating to these species were repeated also only considering environments for which all isolates were tested. No impact on conclusions was observed.
Associating phenotypes to CNVs, stop codons, and novel genes
For all S. cerevisiae isolates, copy number variations, stop codons and novel genes were extracted using previously published genomic sequence information [16]. Gene copy number variations, stop codons and novel genes were extracted and tested for associations to individual traits as detailed in Text S1. Candidate associations were compared to a systematic linkage mapping of crosses between the clean lineages [26] and were retained only if a significant QTL was detected in the corresponding chromosomal region in at least one of the crosses.
Supporting Information
Zdroje
1. DujonB 2010 Yeast evolutionary genomics. Nat Rev Genet 11 512 524
2. CostanzoMBaryshnikovaABellayJKimYSpearED 2010 The genetic landscape of a cell. Science 327 425 431
3. GiaeverGChuAMNiLConnellyCRilesL 2002 Functional profiling of the Saccharomyces cerevisiae genome. Nature 418 387 391
4. LiZVizeacoumarFJBahrSLiJWarringerJ 2011 Systematic exploration of essential yeast gene function with temperature-sensitive mutants. Nat Biotechnol
5. MnaimnehSDavierwalaAPHaynesJMoffatJPengWT 2004 Exploration of essential gene functions via titratable promoter alleles. Cell 118 31 44
6. SchuldinerMCollinsSRThompsonNJDenicVBhamidipatiA 2005 Exploration of the function and organization of the yeast early secretory pathway through an epistatic miniarray profile. Cell 123 507 519
7. SopkoRHuangDPrestonNChuaGPappB 2006 Mapping pathways and phenotypes by systematic gene overexpression. Mol Cell 21 319 330
8. BremRBKruglyakL 2005 The landscape of genetic complexity across 5,700 gene expression traits in yeast. Proc Natl Acad Sci U S A 102 1572 1577
9. BremRBStoreyJDWhittleJKruglyakL 2005 Genetic interactions between polymorphisms that affect gene expression in yeast. Nature 436 701 703
10. GerkeJPChenCTCohenBA 2006 Natural isolates of Saccharomyces cerevisiae display complex genetic variation in sporulation efficiency. Genetics 174 985 997
11. LitiGHaricharanSCubillosFATierneyALSharpS 2009 Segregating YKU80 and TLC1 alleles underlying natural variation in telomere properties in wild yeast. PLoS Genet 5 e1000659 doi:10.1371/journal.pgen.1000659
12. PerlsteinEORuderferDMRobertsDCSchreiberSLKruglyakL 2007 Genetic basis of individual differences in the response to small-molecule drugs in yeast. Nat Genet 39 496 502
13. SteinmetzLMSinhaHRichardsDRSpiegelmanJIOefnerPJ 2002 Dissecting the architecture of a quantitative trait locus in yeast. Nature 416 326 330
14. RuderferDMPrattSCSeidelHSKruglyakL 2006 Population genomic analysis of outcrossing and recombination in yeast. Nat Genet 38 1077 1081
15. TsaiIJBensassonDBurtAKoufopanouV 2008 Population genomics of the wild yeast Saccharomyces paradoxus: Quantifying the life cycle. Proc Natl Acad Sci U S A 105 4957 4962
16. LitiGCarterDMMosesAMWarringerJPartsL 2009 Population genomics of domestic and wild yeasts. Nature 458 337 341
17. WangSBaiF 2008 Saccharomyces arboricolus sp. nov., a yeast species from tree bark. Int J Syst Evol Microbiol 58 510 514
18. WarringerJAnevskiDLiuBBlombergA 2008 Chemogenetic fingerprinting by analysis of cellular growth dynamics. BMC Chem Biol 8 3
19. WarringerJEricsonEFernandezLNermanOBlombergA 2003 High-resolution yeast phenomics resolves different physiological features in the saline response. Proc Natl Acad Sci U S A 100 15724 15729
20. NovakMPfeifferTLenskiRESauerUBonhoefferS 2006 Experimental tests for an evolutionary trade-off between growth rate and yield in E. coli. Am Nat 168 242 251
21. BellG 2010 Experimental genomics of fitness in yeast. Proc Biol Sci 277 1459 1467
22. WongWWTranLMLiaoJC 2009 A hidden square-root boundary between growth rate and biomass yield. Biotechnol Bioeng 102 73 80
23. KellisMPattersonNEndrizziMBirrenBLanderES 2003 Sequencing and comparison of yeast species to identify genes and regulatory elements. Nature 423 241 254
24. ReplanskyTKoufopanouVGreigDBellG 2008 Saccharomyces sensu stricto as a model system for evolution and ecology. Trends Ecol Evol 23 494 501
25. BarnettJAPayneRWYarrowD 2000 Yeasts: Characteristics and identification Cambridge, UK Cambridge University Press
26. CubillosFABilliEZorgoEPartsLFargierP 2011 Assessing the complex architecture of polygenic traits in diverged yeast populations. Mol Ecol 20 1401 1413
27. FayJCMcCulloughHLSniegowskiPDEisenMB 2004 Population genetic variation in gene expression is associated with phenotypic variation in Saccharomyces cerevisiae. Genome Biol 5 R26
28. NaumovGISerpovaEVNaumovaES 2006 [A genetically isolated population of Saccharomyces cerevisiae in Malaysia]. Mikrobiologiia 75 245 249
29. WuHItoKShimoiH 2005 Identification and characterization of a novel biotin biosynthesis gene in Saccharomyces cerevisiae. Appl Environ Microbiol 71 6845 6855
30. LohrDVenkovPZlatanovaJ 1995 Transcriptional regulation in the yeast GAL gene family: a complex genetic network. Faseb J 9 777 787
31. HittingerCTGoncalvesPSampaioJPDoverJJohnstonM 2010 Remarkably ancient balanced polymorphisms in a multi-locus gene network. Nature
32. HittingerCTRokasACarrollSB 2004 Parallel inactivation of multiple GAL pathway genes and ecological diversification in yeasts. Proceedings of the National Academy of Sciences of the United States of America 101 14144 14149
33. WinstonFDollardCRicupero-HovasseSL 1995 Construction of a set of convenient Saccharomyces cerevisiae strains that are isogenic to S288C. Yeast 11 53 55
34. JohnstonMDavisRW 1984 Sequences that regulate the divergent GAL1–GAL10 promoter in Saccharomyces cerevisiae. Mol Cell Biol 4 1440 1448
35. FogelSWelchJW 1982 Tandem gene amplification mediates copper resistance in yeast. Proc Natl Acad Sci U S A 79 5342 5346
36. KimHSFayJC 2007 Genetic variation in the cysteine biosynthesis pathway causes sensitivity to pharmacological compounds. Proc Natl Acad Sci U S A 104 19387 19391
37. Daran-LapujadePDaranJMLuttikMAAlmeringMJPronkJT 2009 An atypical PMR2 locus is responsible for hypersensitivity to sodium and lithium cations in the laboratory strain Saccharomyces cerevisiae CEN.PK113-7D. FEMS Yeast Res 9 789 792
38. DonigerSWKimHSSwainDCorcueraDWilliamsM 2008 A catalog of neutral and deleterious polymorphism in yeast. PLoS Genet 4 e1000183 doi:10.1371/journal.pgen.1000183
39. SternDLOrgogozoV 2009 Is genetic evolution predictable? Science 323 746 751
40. ZewailAXieMWXingYLinLZhangPF 2003 Novel functions of the phosphatidylinositol metabolic pathway discovered by a chemical genomics screen with wortmannin. Proc Natl Acad Sci U S A 100 3345 3350
41. WayneRKOstranderEA 2007 Lessons learned from the dog genome. Trends Genet 23 557 567
42. SampaioJPGoncalvesP 2008 Natural populations of Saccharomyces kudriavzevii in Portugal are associated with oak bark and are sympatric with S. cerevisiae and S. paradoxus. Appl Environ Microbiol 74 2144 2152
43. SniegowskiPDDombrowskiPGFingermanE 2002 Saccharomyces cerevisiae and Saccharomyces paradoxus coexist in a natural woodland site in North America and display different levels of reproductive isolation from European conspecifics. FEMS Yeast Res 1 299 306
44. KvitekDJWillJLGaschAP 2008 Variations in stress sensitivity and genomic expression in diverse S. cerevisiae isolates. PLoS Genet 4 e1000223 doi:10.1371/journal.pgen.1000223
45. LandryCRTownsendJPHartlDLCavalieriD 2006 Ecological and evolutionary genomics of Saccharomyces cerevisiae. Mol Ecol 15 575 591
46. SchachererJShapiroJARuderferDMKruglyakL 2009 Comprehensive polymorphism survey elucidates population structure of Saccharomyces cerevisiae. Nature 458 342 345
47. EhrenreichIMTorabiNJiaYKentJMartisS 2010 Dissection of genetically complex traits with extremely large pools of yeast segregants. Nature 464 1039 1042
48. DowellRDRyanOJansenACheungDAgarwalaS 2010 Genotype to phenotype: a complex problem. Science 328 469
49. DeutschbauerAMDavisRW 2005 Quantitative trait loci mapped to single-nucleotide resolution in yeast. Nat Genet 37 1333 1340
50. MortimerRKJohnstonJR 1986 Genealogy of principal strains of the yeast genetic stock center. Genetics 113 35 43
51. BenjaminiYHochbergY 1995 Controlling the false discovery rate: a practical and powerful approach to multiple testing. Journal of the Royal Statistical Society 57 289 300
52. EisenMBSpellmanPTBrownPOBotsteinD 1998 Cluster analysis and display of genome-wide expression patterns. Proc Natl Acad Sci U S A 95 14863 14868
53. NaumovaESTurakainenHNaumovGIKorholaM 1996 Superfamily of alpha-galactosidase MEL genes of the Saccharomyces sensu stricto species complex. Mol Gen Genet 253 111 117
54. SimpsonJTDurbinR 2010 Efficient construction of an assembly string graph using the FM-index. Bioinformatics 26 i367 373
Štítky
Genetika Reprodukční medicínaČlánek vyšel v časopise
PLOS Genetics
2011 Číslo 6
- Kazuistika – Perspektivy využití precizované medicíny v rámci personalizované specifické terapie onkologických pacientů
- Nobelova cena za chemii pro genetické nůžky: Objev, který změní naši budoucnost?
- Technologie na bázi RNA v klinické praxi: od přebarvených petúnií k terapii vzácných a dosud jen obtížně léčitelných chorob u lidí
- „Nepředstavovali jsme si, že náš výzkum povede přímo ke vzniku nových léků, dokonce ještě za našeho života“
- Bezplatné služby pro diagnostiku ATTRv amyloidózy pro kardiology
Nejčtenější v tomto čísle
- Recurrent Chromosome 16p13.1 Duplications Are a Risk Factor for Aortic Dissections
- Statistical Inference on the Mechanisms of Genome Evolution
- Genome-Wide Association Study of White Blood Cell Count in 16,388 African Americans: the Continental Origins and Genetic Epidemiology Network (COGENT)
- Chromosomal Macrodomains and Associated Proteins: Implications for DNA Organization and Replication in Gram Negative Bacteria
Zvyšte si kvalifikaci online z pohodlí domova
Mazová zátka a její řešení
nový kurzVšechny kurzy