
Ukraine Data on Prognostic Factors and Treatment Outcomes in Patients with Peripheral T-Cell Lymphomas
Ukrajinské údaje o prognostických faktorech a výsledcích léčby u pacientů s periferními T lymfomy
Východiska: Periferní T lymfomy (peripheral T-cell lymphomas – PTCL) jsou různorodou skupinou lymfomů (10–15 % všech non-Hodgkinových lymfomů) s agresivním chováním. I přes standardní režimy obsahující antracykliny v 1. linii jsou klinické výsledky ve srovnání s lymfomy B buněk špatné. Rovněž se stále vedou diskuze o specifických prognostických faktorech (PF) v PTCL. Cíle: Primární cíle – přežití bez příhody (event-free survival – EFS) a celkové přežití (overall survival – OS). Vyhodnotit prognostický význam pěti skóre PTCL (Mezinárodní prognostický index – IPI, Mezinárodní projektové skóre periferního T lymfomu – IPTCL, Prognostický index pro T lymfom – PIT, upravený prognostický index pro T lymfom – mPIT a T-skóre buněk).
Pacienti a metody: Z 67 registrovaných pacientů bylo zahrnuto pouze 50: PTCL blíže nespecifikované (22, 44 %), anaplastický velkobuněčný lymfom ALK+ (pozitivní anaplastická lymfomová kináza) (10, 20 %) a ALK − (negativní anaplastická lymfomová kináza) (18, 36 %). Pacienti dostávali režimy CHOP (CHOP, CHOEP, EPOCH).
Výsledky: Celková četnost odpovědí byla pozorována v 66 % případů (úplná odpověď 78 %). Během následné léčby došlo ve 48 % k relapsům (medián 11 měsíců; rozmezí 1–85 měsíců). Průměrný věk 57 let (rozmezí 22–80), s převahou mužů 62 %. Celkem 40 % pacientů bylo starších 60 let, 48 % mělo stadium III–IV. Většina pacientů byla hodnocena pěti prognostickými skóre. IPI (45 pacientů): 3leté EFS a OS byly vyšší s IPI ≤ 1 vs. IPI > 2 (80 vs. 18 % a 87 vs. 27 %; p = 0,0002). Analýza ROC (receiver operating characteristic) potvrdila špatný klinický výsledek u pacientů s PF > 1 (Se = 88 %; Sp = 68 %; AUC = 0,7; p = 0,0081). IPTCLP (41 pacientů): přítomnost PF = 1–2 vykazovala snížení EFS a OS. Tříleté EFS pro 1–2 PF bylo 25 vs. 70 % pro PF = 0 (p = 0,003). Tudíž 3leté OS u pacientů s PF = 0 vs. PF = 1–2 bylo 100 vs. 20 % (p = 0,0001). PIT (42 pacientů): lepší 3leté EFS a OS u pacientů s PF = 0 vs. PF = 1–3 (88 vs. 28 % a 100 vs. 34 %; p = 0,001). Pacienti s PF = 1–3 mají vyšší míru relapsů než PF = 0 (p = 0,0005 Coxovým testem). mPIT (21 pacientů): žádný významný rozdíl mezi PF a klinickými výsledky. Skóre T buněk (18 pacientů): vyšší míra přežití s PF ≤ 2. Více než 2 PF mají dopad na EFS (p = 0,005). Tříleté OS u pacientů s PF ≤ 2 bylo 77 vs. 25 % v případech s PF ≥ 3 (p = 0,001).
Závěr: IPI, PIT, IPTCLP jsou stále velmi užitečné při definování stratifikace rizika. Pokud jde o skóre mPIT a T buněk, je třeba více pacientů, aby bylo možné vyhodnotit jejich prognostické možnosti.
Autoři deklarují, že v souvislosti s předmětem studie nemají žádné komerční zájmy.
Redakční rada potvrzuje, že rukopis práce splnil ICMJE kritéria pro publikace zasílané dobiomedicínských časopisů.
Obdrženo: 18. 7. 2019
Přijato: 13. 10. 2019
Klíčová slova:
periferní T lymfomy – prognostické faktory – periferní T lymfomy blíže nespecifikované – pozitivní anaplastická lymfomová kináza – negativní anaplastická lymfomová kináza
Authors:
T. Skrypets 1,2; O. Novosad 1; Y. Pastushenko 1; O. Gorbach 1; I. Kriachok 1
Authors place of work:
Oncohematology Department, National Cancer Institute, Kiev, Ukraine
1; Clinical and Experimental Medicine PhD Program, Università di Modena e Reggio Emilia, Italy
2
Published in the journal:
Klin Onkol 2019; 32(6): 436-444
Category:
Původní práce
doi:
https://doi.org/10.14735/amko2019436
Summary
Background: Peripheral T-cell lymphomas (PTCLs) is a diverse group of lymphomas (10–15% of all non-Hodgkin’s lymphomas) with aggressive behavior. Despite the standard of 1st line anthracycline-containing regimens, clinical outcomes are poor compared to B-cell lymphomas. In addition, there are still debates about specific prognostic factors (PF) in PTCLs. Aims: Primary endpoints – event-free survival (EFS) and overall survival (OS). To evaluate the prognostic significance of five PTCLs scores (International Prognostic Index – IPI, International Peripheral T-cell lymphoma Project Score – IPTCL, Prognostic Index for T-cell lymphoma – PIT, modified Prognostic Index for T-cell lymphoma – mPIT and T-cell score).
Patients and methods: From 67 enrolled patients, only 50 were included: PTCL not otherwise specified (22, 44%), anaplastic large cell lymphoma ALK+ (anaplastic lymphoma kinase-positive) (10, 20%) and ALK − (anaplastic lymphoma kinase-negative) (18, 36%). Patients received CHOP-like regimens (CHOP, CHOEP, EPOCH).
Results: The overall rate response was observed in 66% of cases (complete response 78%). There were 48% of relapses after the 1st line therapy during follow-up (median 11 months; range 1–85 months). Median age 57 (range 22–80) with male predominance 62%. In total, 40% of patients were > 60 years old, 48% had stage III–IV. Majority of patients were assessed by five prognostic scores. IPI (45 patients): the 3-year EFS and OS were higher for IPI ≤ 1 vs. IPI > 2 (80 vs. 18% and 87 vs. 27%, respectively; p = 0.0002). Receiver operating characteristic analysis confirmed poor clinical outcome to patients with PF > 1 (Se = 88 %; Sp = 68 %; AUC = 0.7; p = 0.0081). IPTCLP (41 patients): the presence of PF = 1–2 showed EFS and OS reduction. A 3-year EFS rate for 1–2 PF was 25 vs. 70% for PF = 0 (p = 0.003). Thus, 3-year OS in patients with PF = 0 vs. PF = 1–2 was 100 vs. 20% (p = 0.0001). PIT (42 patients): better 3-year EFS and OS in patients with PF = 0 vs. PF = 1–3 (88 vs. 28% and 100 vs. 34%, respectively, p = 0.001). Patients with PF = 1–3 have a higher rate of relapses vs. PF = 0 (p = 0.0005 by Cox-test). mPIT (21 patients): no significant difference between PF and clinical outcomes. T-cell score (18 patients): higher survival rates with PF ≤ 2. More than 2 PF have an impact on EFS (p = 0.005). The 3-years OS in patients with PF ≤ 2 was 77 vs. 25% in cases with PF ≥ 3 (p = 0.001).
Conclusion: IPI, PIT, IPTCLP are still very useful in defining risk stratification. As to mPIT and T-cell score, more patients to evaluate their prognostication possibility are needed.
Keywords:
prognostic factors – peripheral T-cell lymphomas – peripheral T-cell lymphomas not otherwise specified – anaplastic lymphoma kinase-positive – anaplastic lymphoma kinase-negative
Introduction
The classification of non-Hodgkin’s lymphoma (NHL) has evolved steadily during the last several decades. In the 1950s, Rappaport et al. recognized the importance of the growth pattern in NHL and used pattern, cell size and shape as the basis of a classification [1]. In the 1970s, recognition that NHL cells were derived from T-or B-cells led to the immunologically based classification of Lukes and Collins and the Kiel classification of Lennert [2,3]. The Working Formulation was proposed in 1982 in an attempt to unify the various classifications. In 1994, a group of pathologists (the International Lymphoma Study Group) proposed a classification of lymphoid neoplasms [4].
Due to the 2016 World Health Organization (WHO) classification, there are more than 20 types of mature T-and natural killer neoplasms (Tab. 1), with its heterogeneous nature and genetic characteristics. Between all lymphoid neoplasms, peripheral T-cell lymphomas (PTCL) counts only near 10–15% by different data [5,6]. The incidence of PTCL depends on geographical region. It is well-known that incidence of PTCLs is more frequent in Asia, Central and South America compared to Europe. However, in Europe and North America, nodal disease is more common than in Asia and South America, where extranodal cases prevalence is observed [7,8]. Usually, the disease more often occurs in male, but women are not an exception. Predominantly, PTCL are diagnosed in middle and elderly age groups [9].

T neoplasms – neoplasms from T cells, NK – natural killer, EBV – Epstein-Barr virus,
NOS – not otherwise specified, TFH – T follicular helper, ALK – anaplastic lymphoma
kinase
Nowadays, there are four more prevalent types of PTCL: anaplastic large cell lymphoma (ALCL), what could be ALCL anaplastic lymphoma kinase-positive (ALK+) and anaplastic lymphoma kinase-negative (ALK−), angioimmunoblastic lymphoma and peripheral T-cell lymphoma not otherwise specified (PTCL-NOS) [6]. PTCLs are an extremely heterogeneous group with different “mixed luggage” clinical and pathological features, but still lack of clearer information to define it in one entity.
Unfortunately, compared to B-cell lymphomas, outcome prognostic rates in PTCL are lower, in spite of numerous treatment options and ongoing clinical trials. Prognostic scores for patients with PTCL are still under investigation. There are two large retrospective studies organized by the International T-Cell Project and the British Columbia Cancer Agency, but prospective data are still missing. Despite this, risk factors are being studied and described in countless studies, but there are still a lot of debates about their clinical implementation.
Patients and methods
Study population
During the last 9 years, from August 2009 to April 2018, we analyzed PTCL patients at the Department of Oncohematology of the National Cancer Institute.
Approximately 80% of all cases have been evaluated in the pathology laboratory of the National Cancer Institute in Kiev, Ukraine. Other cases have been received from pathological laboratories in different Ukrainian centers. All pathology reports were reviewed according to the last edition of the WHO classification of lymphoid neoplasms (2016). Only PTCL-NOS, ALCL ALK+ and ALCL ALK − cases were included in the analysis because of their prevalence between other sub-types. Treatment response was mostly assessed by computed tomography scan or positron emission tomography/computed tomography. All data collection has been done by gathering information manually and via electronic local database.
Prognostic scores in PTCL
One of the main ideas of this study was to analyze present prognostic scores: International Prognostic Index (IPI), Prognostic Index for T-cell lymphoma (PIT), International Peripheral T-cell lymphoma Project Score (IPTCLP), modified Prognostic Index for T-cell lymphoma – mPIT and the new one – T-cell score [10–14].
The IPI was calculated as a primary scale to assess outcomes in patients with NHL’s. Factors for poor prognosis were age > 60 years, stage III/IV disease, elevated lactate dehydrogenase (LDH) level, Eastern Cooperative Oncology Group (ECOG) performance status 2, more than one extranodal site of disease. Number of risk factors identified four groups: 0–1 low; 2 low intermediate; 3 high intermediate and 4–5 high.
The PIT score was evaluated by four prognostic factors (PF): age (< 60 vs. > 60), performance status (ECOG 1 vs. > 2), LDH level (low vs. high) and bone marrow involvement (negative vs. positive). Due to PF, patients were divided into four groups: low-risk, low-intermediate-risk, high-intermediate-risk or high-risk groups.
The IPTCLP prognostic model includes three variables: age (< 60 vs. > 60), performance status (ECOG 1 vs. > 2) and platelet cell count (< 150 × 109/L vs. > 150 × 109/L). As in previous prognostic models, patients were classified into low-risk, low-intermediate-risk, high-intermediate-risk or high-risk groups.
The mPIT score has the same PF as PIT score with addition of Ki-67 immunostaining (< 75% vs. > 75%), age (< 60 vs. > 60), performance status (ECOG 1 vs. > 2), LDH level (low vs. high) and bone marrow involvement (negative vs. positive). After calculating all PF, patients were classified into low-risk, intermediate-risk or high-risk groups.
Three prognostic groups were identified by T-cell score: low-risk, intermediate risk, and high-risk groups, based on the inclusion of ECOG (< 1 vs. > 1) Ann Arbor stage (I–II vs. III–IV) Albumin (> 3.5 vs. < 3.5 g/dL) and absolute neutrophil count (ANC) (< 6.5 × 10⁹/L vs. > 6.5 × 10⁹/L) evaluation.
Statistical analysis
Event-free survival (EFS) was defined as the time from diagnosis to either disease progression or relapse, or to death (from any cause). Data were censored if the patients were alive and free of progression/relapse at last follow-up. Overall survival (OS) was defined as the time from diagnosis to death from any cause. Data were censored if the patients were alive at the last follow-up. Survival curves were calculated by the method of Kaplan and Meier, statistical significance of parameters differences was determined using Log-rank test and Chi-square test. To investigate the contribution of individual prognostic factors, the Cox proportional hazards regression model was performed. Hazard ratio (HR) with 95% confidence intervals (CI) was calculated for factors identified by this regression model. The difference was considered statistically significant at p < 0.05. The data was statistically processed using Statistica 10 and MedCalc 12.6.1.0 software.
Patients characteristics
We registered 67 PTCL patients based on the WHO classification, but only 50 patients were included with histological subtypes of PTCL-NOS (22 cases, 44%), ALCL ALK+ (10 cases, 20%) and ALCL ALK − (18 cases, 36%). In total, 13 patients with ALCL diagnosis but without ALK status were excluded and 2 patients with angioimmunoblastic T-cell lymphomas (AITL) due to loss of follow-up. Staging and response assessment have been done by standard protocols and generally accepted criteria. Median age at diag-nosis was 57 (22–80) years with male predominance in 62% of cases. Patient characteristics at the time of diagnosis are summarized in Tab. 2.

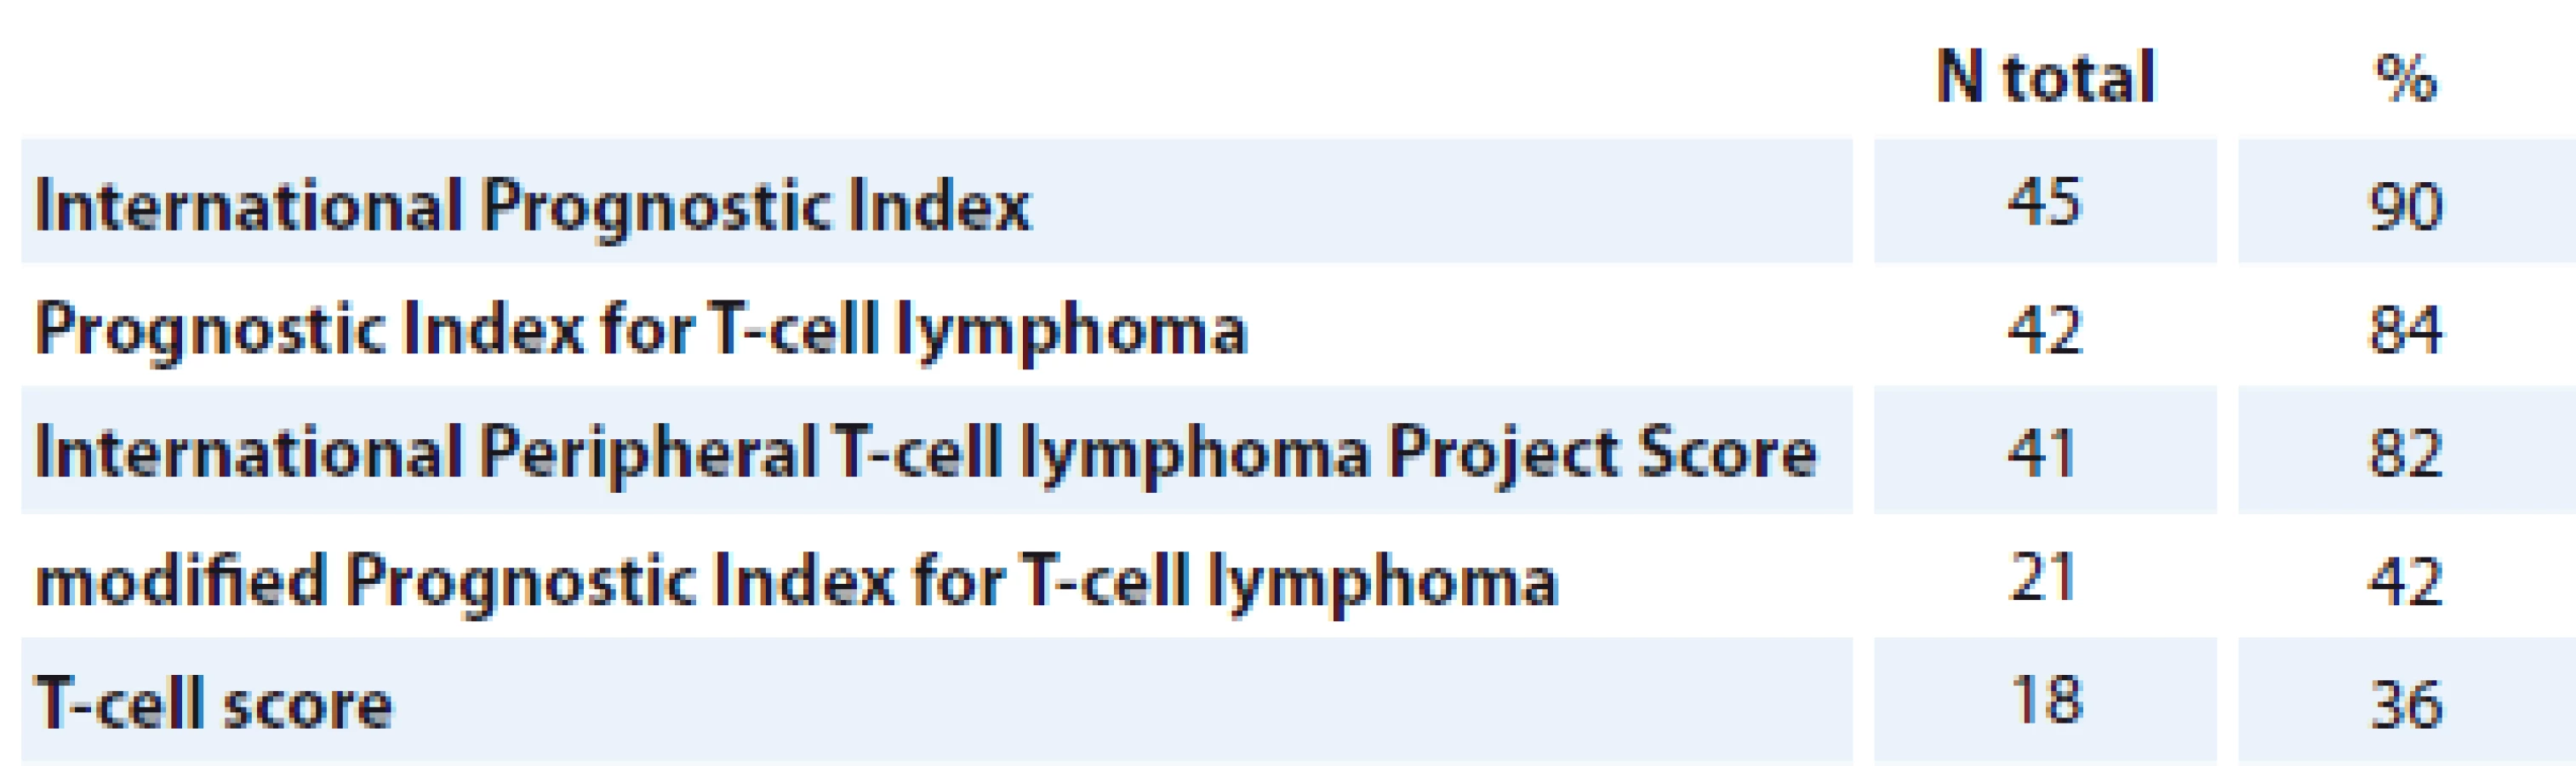
For prognostic score assessment, the majority of patients were evaluated with IPI, PIT, IPTCLP, mPIT and T-cell score (Tab. 3). All patients received CHOP (cyclophosphamide, doxorubicin, vincristine, and prednisone) or CHOP-like regimens with or without radiation therapy.
Results
The overall rate response was observed in 66% patients of our cohort group. The survival rates by T-NHL subtype are shown in Fig. 1, 2. Early relapse or refractory disease were registered in 21 (42%) patients, late relapse – 3 (6%) after the 1st line therapy during the follow-up period (median 11 months; range 1–85 months).
T-NHL – T-cell non-Hodgkin’s lymphoma, NOS – not otherwise specified, ALK – anaplastic lymphoma kinase

T-NHL – T-cell non-Hodgkin’s lymphoma, NOS – not otherwise specified, ALK – anaplastic lymphoma kinase

We revealed that advanced stages (III–IV), performance status (ECOG > 1) and high serum level of LDH (> 620 U/l) are unfavorable PF in patients with PTCL and can predict clinical outcomes (Fig. 3A–C).
LDG – lactate dehydrogenase, ECOG – Eastern Cooperative Oncology Group

Three-year-EFS was higher in patients with stage I–II (by Cox, p = 0.003), ECOG 0 (50 vs. 10%, log rank test, p = 0.0001) and low serum level of LDH (80 vs. 25%, log rank test; p = 0.0017).
The same data were found in our cohort for OS. The level of 3-year-OS was lower in patients with stage III–IV (30 vs. 66%, log rank test; p = 0.003), ECOG < 1 (15 vs. 65%, log rank test; p = 0.0001) and high serum level of LDH (35 vs. 85%, log rank test; p = 0.0009). Receiver operating characteristic (ROC) analysis confirmed all data for stage III–IV (sensitivity (Se) = 68%; specificity (Sp) = 63%; area under the curve (AUC) = 0.65, p = 0.02), ECOG > 1 (Se = 55%; Sp = 90 %; AUC = 0.72; p = 0.0003) and high LDH (Se = 85%; Sp = 65 %; AUC = 0.75; p = 0.0005).
In addition, the presence of B-symptoms was shown to play an important role in prognosis of 3-year-OS (70 vs. 28%, log rank; p = 0.006) as well as low platelet (PLT) count (PLT < 150 × 109/L) showed poor clinical outcomes (Fig. 4A–E). Thus, 1-year OS was better in patients with normal vs. low level of PLT (58 vs. 20%, respectively, log rank test; p = 0.009).
ECOG – Eastern Cooperative Oncology Group, LDG – lactate dehydrogenase, B-symptoms – fever, night sweats, weight loss

Patients who achieved any type of response had higher 3-year EFS and OS compared to patients without response (73 vs. 15% and 80 vs. 15%, respectively, log rank; p < 0.0001). No difference between 1st line chemotherapy with or without adding etoposide and presence of radiation therapy to EFS and OS.
Outcomes in different prognostic groups
All patients in study group were assessed by prognostic scores. The number of patients in the investigation scores-groups were approximately equal.
IPI (45 patients)
The 3-year EFS and OS were significantly higher in patients with IPI ≤ 1 vs. IPI > 2 (80 vs. 18% and 87 vs. 27%, respectively; p = 0.0002). ROC analysis confirmed that patients with PF > 1 are associated with poor clinical outcome (Se = 88%; Sp = 68%; AUC = 0.7; p = 0.0081) (Tab. 4).

IPTCLP (41 patients)
The presence of PF = 1–2 were associated with the reduced EFS and OS in T-NHL patients. A 3-year EFS rate for PF = 1–2 was 25% compared with 70% for PF = 0 of T-NHL patients (log rank test; p = 0.003) (Tab. 5).

At the same time, OS was calculated. Using Kaplan-Meier, 3-year OS in patients in this group with PF = 0 was better vs. PF = 1–2 (100 vs. 20%, respectively, log rank test; p = 0.0001). The prognostic significance of PF = 0 in clinical outcome of T-NHL (OS) was also confirmed with multivariate analysis (HR = 1.2; 95% CI 1.8–6.5; p = 0.0001).
PIT (42 patients)
Kaplan-Mayer assessment showed better results of 3-year EFS and OS in patients with PF = 0 vs. PF = 1–3 (88 vs. 28% and 100 vs. 34%, respectively, log rank test; p = 0.001). Patients with PF = 1–3 had a higher rate of relapse, comparing to absence of PF (p = 0.0005 by Cox-test) (Tab. 6).

mPIT (21 patients)
There was no significant difference between PF and clinical outcomes in this group (Tab. 7).

T-cell score (18 patients)
We revealed that survival rates were better if PF ≤ 2. Thus, more than 2 PF influenced EFS (p = 0.005 by Cox). Notably, 3-year OS in patients with PF ≤ 2 was 77 vs. 25% in cases with PF ≥ 3 (log rank test; p = 0.001). However, no significant difference between PF and PFS was found (Tab. 8).

No significant difference was found between bone marrow involvement, age, gender, Ki-67, albumin, ANC, and EFS or OS rate.
Discussion
This study was based on the Ukrainian population over a 10-year period. It is the largest Ukrainian population-based data reported about PTCL, despite the fact that it is a single-center experience. National Cancer Institute provides therapy to people from all over Ukraine. Although, there are no previous available population based reports from east European countries. Moreover, this is the first study where patients were analyzed using all five prognostic scores: IPI, PIT, IPTCLP, mPIT and T-cell score.
It is known that PTCL has a large epidemiological variation in different geographical regions. Using data of The International T-Cell Project, the most frequent types of PTCL are PTCL-NOS, AITL, ALCL (ALK−), ALCL (ALK+) and NK/T-cell lymphoma [8]. In Europe, PTCL-NOS and AITL are more frequent than the other three, confirmed by several studies [8,15]. However, in our analysis, PTCL-NOS was observed in a majority of patients, while only two cases with AITL were presented and excluded from analysis, because of unclear data records. Our study has two limitations – absence of Ukrainian data registry and central pathology review. We can also mention a small number of patients as a limitation, but it is a single-center study.
The median age of patients in our cohort is lower compared to previously published large studies [10,15,16]. It could be explained by a shorter lifetime in the Ukrainian population compared to the European one. Nevertheless, OS rates are comparable with international data presented in the T-Cell Project [10,15].
There are still debates about risk stratification of PTCL, since the standard 1st line of treatment results in poor outcome of major PTCL types. In our study, we did not observe any crucial difference between prognostic scores in survival rates; however, we did not receive any significant data from mPIT, and EFS rate using T-cell score. Possibly, the number of patients assessed by these two scores was lower, than in group of PIT, IPI and IPTCLP (Tab. 3). The mPIT was assessed in 42% of patients, where Ki-67 was available using immunohistochemistry reports. The same situation was observed for T-cell score, where only 36% of patients were analyzed, due to the lack of the electronic database with all laboratory counts of albumin and ANC.
As previously mentioned in results, we identified several factors from all covariates included in five prognostic scores, with a significant impact on OS (Fig. 4A–E) and EFS (Fig. 3A–C). Of course, all these scores are based on clinical characteristics; however, despite the absence of some molecular and genetic findings, they are useful in evaluating and defining risk of PTCLs. An impact of all these scores has been already confirmed in several studies, although it was proven in these ones only [5,10]. However, there are two most important and frequently used prognostic indices frequently used – IPI and PIT.
Moreover, we decided not to exclude patients with ALCL ALK+. A lot of previous studies showed better outcomes for this type of PTCL, but we decided to include this patient population for several reasons. The first reason – ALCL ALK+ is one of the most frequent type of PTCLs in the European population. Then, the definition of PTCLs in a new 2016 WHO classification includes more than 20 different types of PTCLs. Further several studies showed ALK status is not an independent prognostic factor on ALCL outcome [15,17].
The treatment schedules received by patients were > 90% with anthracyclin-based regimens (CHOP; CHOEP – cyclophosphamide, doxorubicin, etoposide, vincristine, prednisone; Da-EPOCH – etoposide, prednisone, vincristine, cyclophosphamide, doxorubicin). Young patients (< 65 years old) were treated with adding etoposide in 58 %. However, we did not observe any influence on OS and EFS by treatment with or without adding etoposide in 1st line treatment (p = 0.3 and p = 0.15, respectively). Autologous stem cell transplantation has been done only for 2 patients in 1st line treatment option. There are several explanations for this – lack of hematological centers where transplant could be performed, lack of financial support and mixed data about superiority of transplant in a 1st line setting.
In conclusion, results received from this Ukrainian based-population study are similar to data from several other European based-population studies. There could be some selection bias due to limitations mentioned above. Nevertheless, the IPI, PIT, IPTCLP are still very useful in defining risk stratification. More patients need to be included for evaluation according mPIT and T-cell score, in order to confirm their prognostication ability.
The authors declare they have no potential conflicts of interest concerning drugs, products, or services used in the study.
The Editorial Board declares that the manuscript met the ICMJE recommendation for biomedical papers.
Tetiana Skrypets, MD
Oncohematology Department
National Cancer Institute
33/43 Lomonosova street
03022 Kiev, Ukraine
e-mail: tetianaskrypets@gmail.com
Submitted: 18. 7. 2019
Accepted: 13. 10. 2019
Zdroje
1. Hicks EB, Rappaport H, Winter WI. Follicular lymphoma: a re-evaluation of its position in the scheme of malignant lymphoma, based on a survey of 253 cases. Cancer 1956; 9 (4): 792–821. doi: 10.1002/1097-0142 (195607/08) 9 : 4<792:: aid-cncr2820090429>3.0.co; 2-b.
2. Damber L, Lenner P, Lundgren E. The impact of growth pattern on survival in non-Hodgkin’s lymphomas classified according to Lukes and Collins. Pathol Res Pract 1982; 174 (1–2): 42–52. doi: 10.1016/S0344-0338 (82) 80027-7.
3. Lukes RJ, Collins RD. Immunologic characterization of human malignant lymphomas. Cancer 1974; 34 (Suppl 4): 1488–1503. doi: 10.1002/1097-0142 (197410) 34 : 8+<1488:: aid-cncr2820340822>3.0.co; 2-c.
4. Harris HL, Jaffe ES, Stein H et al. A revised European-American classification of lymphoid neoplasms: a proposal from the International Lymphoma Study Group. Blood 1994; 84 (5): 1361–1392.
5. Gutiérrez-García G, García-Herrera A, Cardesa T et al. Comparison of four prognostic scores in peripheral T-cell lymphoma. Ann Oncol 2011; 22 (2): 397–404. doi: 10.1093/annonc/mdq359.
6. Bellei M, Foss FM, Shustov AR et al. The outcome of peripheral T-cell lymphoma patients failing first-line therapy: a report from the prospective, International T-Cell Project. Haematologica 2018; 103 (7): 1191–1197. doi: 10.3324/haematol.2017.186577.
7. Vose JM. Peripheral T-cell non-Hodgkin’s lymphoma. Hematol Oncol Clin North Am 2008; 22 (5): 997–1005. doi: 10.1016/j.hoc.2008.07.010.
8. Bellei M, Chiattone CS, Luminari S et al. T-cell lymphomas in South America and Europe. Rev Bras Hematol Hemoter 2012; 34 (1): 42–47. doi: 10.5581/1516-8484.20120013.
9. Swerdlow SH, Campo E, Harris NL et al (eds). 2017. World Health Organization Classification of Tumours of Hematopoietic and Lymphoid Tissues. 4th ed. Lyon: Res Cancer Rev 2017.
10. Federico M, Bellei M, Marcheselli L et al. Peripheral T cell lymphoma, not otherwise specified (PTCL-NOS). A new prognostic model developed by the International T cell Project Network. Br J Haematol 2018; 181 (6): 760–769. doi: 10.1111/bjh.15258.
11. Gallamini A, Stelitano C, Calvi R et al. Peripheral T-cell lymphoma unspecified (PTCL-U): a new prognostic model from a retrospective multicentric clinical study. Blood 2004; 103 (7): 2474–2479. doi: 10.1182/blood-2003-09-3080.
12. Vose J. International Peripheral T-cell Lymphoma (PTCL) Clinical and Pathology Review Project: poor outcome by prognostic indices and lack of efficacy with anthracyclines. Blood 2005; 106 (11): 811. doi: 10.1182/blood.V106.11.811.811.
13. Shipp MA, Harrington DP, Anderson JR et al. A predictive model for aggressive non-Hodgkin’s lymphoma. N Engl J Med 1993; 329 (14): 987–994. doi: 10.1056/NEJM199309303291402.
14. Went P, Agostinelli C, Gallamin A et al. Marker expression in peripheral T-cell lymphoma: a proposed clinical-pathologic prognostic score. J Clin Oncol 2006; 24 (16): 2472–2479. doi: 10.1200/JCO.2005.03.6327.
15. Ellin F, Landström J, Jerkeman M et al. Real-world data on prognostic factors and treatment in peripheral T-cell lymphomas: a study from the Swedish Lymphoma Registry. Blood 2014; 124 (10): 1570–1577. doi: 10.1182/blood-2014-04-573089.
16. Savage KJ, Chhanabhai M, Gascoyne RD et al. Characterization of peripheral T-cell lymphomas in a single North American institution by the WHO classification. Ann Oncol 2004; 15 (10): 1467–1475. doi: 10.1093/annonc/mdh392.
17. Sibon D, Fournier M, Brière J et al. Long-term outcome of adults with systemic anaplastic large-cell lymphoma treated within the groupe d‘Étude des Lymphomes de l‘Adulte trials. J Clin Oncol 2012; 30 (32): 3939–3946. doi: 10.1200/JCO.2012.42.2345.
Štítky
Dětská onkologie Chirurgie všeobecná OnkologieČlánek vyšel v časopise
Klinická onkologie

2019 Číslo 6
- Srovnání vlivu tamoxifenu a exemestanu na tloušťku endometria
- Inovace v hojení ran: krytí Zetuvit Plus Silicone Border pro optimální management exsudátu z ran
- Incidence mozkových metastáz a intrakraniální aktivita sotorasibu u pacientů s NSCLC s mutací G12C onkogenu KRAS
- Přibývající důkazy o přínosu léčebného konopí u pacientů s chronickou bolestí
Nejčtenější v tomto čísle
- Extravasation (Paravasation) of Chemotherapy Drugs – Recommendations for Standard Care in the Czech Republic based on Consolations between Representatives of the Supportive Care Group of the Czech Society for Oncology, Oncology Section of the Czech Nurses Association, and the Society for Ports and Permanent Catheters
- Rare Hereditary Burden associated with a Hypercalcemic Small-Cell Carcinoma of Cervix in a Young Female Patient
- Tranzice péče o onkologické pacienty z dětského do dospělého věku
- Bortezomib and Thalidomide Treatment Results in Newly Diagnosed Transplant-Ineligible Multiple Myeloma Patients are Comparable in Long-Term Follow-Up
Zvyšte si kvalifikaci online z pohodlí domova
Mazová zátka a její řešení
nový kurzVšechny kurzy