
The Effect of Elevated Body Mass Index on Ischemic Heart Disease Risk: Causal Estimates from a Mendelian Randomisation Approach
Background:
Adiposity, assessed as elevated body mass index (BMI), is associated with increased risk of ischemic heart disease (IHD); however, whether this is causal is unknown. We tested the hypothesis that positive observational associations between BMI and IHD are causal.
Methods and Findings:
In 75,627 individuals taken from two population-based and one case-control study in Copenhagen, we measured BMI, ascertained 11,056 IHD events, and genotyped FTO(rs9939609), MC4R(rs17782313), and TMEM18(rs6548238). Using genotypes as a combined allele score in instrumental variable analyses, the causal odds ratio (OR) between BMI and IHD was estimated and compared with observational estimates. The allele score-BMI and the allele score-IHD associations used to estimate the causal OR were also calculated individually. In observational analyses the OR for IHD was 1.26 (95% CI 1.19–1.34) for every 4 kg/m2 increase in BMI. A one-unit allele score increase associated with a 0.28 kg/m2 (95 CI% 0.20–0.36) increase in BMI and an OR for IHD of 1.03 (95% CI 1.01–1.05) (corresponding to an average 1.68 kg/m2 BMI increase and 18% increase in the odds of IHD for those carrying all six BMI increasing alleles). In instrumental variable analysis using the same allele score the causal IHD OR for a 4 kg/m2 increase in BMI was 1.52 (95% CI 1.12–2.05).
Conclusions:
For every 4 kg/m2 increase in BMI, observational estimates suggested a 26% increase in odds for IHD while causal estimates suggested a 52% increase. These data add evidence to support a causal link between increased BMI and IHD risk, though the mechanism may ultimately be through intermediate factors like hypertension, dyslipidemia, and type 2 diabetes. This work has important policy implications for public health, given the continuous nature of the BMI-IHD association and the modifiable nature of BMI. This analysis demonstrates the value of observational studies and their ability to provide unbiased results through inclusion of genetic data avoiding confounding, reverse causation, and bias.
: Please see later in the article for the Editors' Summary
Published in the journal:
. PLoS Med 9(5): e32767. doi:10.1371/journal.pmed.1001212
Category:
Research Article
doi:
https://doi.org/10.1371/journal.pmed.1001212
Summary
Background:
Adiposity, assessed as elevated body mass index (BMI), is associated with increased risk of ischemic heart disease (IHD); however, whether this is causal is unknown. We tested the hypothesis that positive observational associations between BMI and IHD are causal.
Methods and Findings:
In 75,627 individuals taken from two population-based and one case-control study in Copenhagen, we measured BMI, ascertained 11,056 IHD events, and genotyped FTO(rs9939609), MC4R(rs17782313), and TMEM18(rs6548238). Using genotypes as a combined allele score in instrumental variable analyses, the causal odds ratio (OR) between BMI and IHD was estimated and compared with observational estimates. The allele score-BMI and the allele score-IHD associations used to estimate the causal OR were also calculated individually. In observational analyses the OR for IHD was 1.26 (95% CI 1.19–1.34) for every 4 kg/m2 increase in BMI. A one-unit allele score increase associated with a 0.28 kg/m2 (95 CI% 0.20–0.36) increase in BMI and an OR for IHD of 1.03 (95% CI 1.01–1.05) (corresponding to an average 1.68 kg/m2 BMI increase and 18% increase in the odds of IHD for those carrying all six BMI increasing alleles). In instrumental variable analysis using the same allele score the causal IHD OR for a 4 kg/m2 increase in BMI was 1.52 (95% CI 1.12–2.05).
Conclusions:
For every 4 kg/m2 increase in BMI, observational estimates suggested a 26% increase in odds for IHD while causal estimates suggested a 52% increase. These data add evidence to support a causal link between increased BMI and IHD risk, though the mechanism may ultimately be through intermediate factors like hypertension, dyslipidemia, and type 2 diabetes. This work has important policy implications for public health, given the continuous nature of the BMI-IHD association and the modifiable nature of BMI. This analysis demonstrates the value of observational studies and their ability to provide unbiased results through inclusion of genetic data avoiding confounding, reverse causation, and bias.
: Please see later in the article for the Editors' Summary
Introduction
Observational examination of the prospective association between body mass index (BMI) and ischemic heart disease (IHD) has been undertaken in a range of populations [1]–[3] and has consistently shown a positive relationship between BMI and the risk of IHD and other vascular endpoints [4]–[9]; however, causality in this relationship has not been convincingly demonstrated.
Observational association of BMI with IHD is impaired by confounding [10], reverse causation [11],[12], and bias [12], making it difficult to infer causality. An alternative approach free of confounding, reverse causation, and bias is that of Mendelian randomisation [13]. Mendelian randomisation uses analyses analogous to those in a randomized trial, but where randomization to risk-factor–related genotypes takes place at conception. In the case of IHD, genotypes with the largest known effects on BMI [14], (FTO[rs9939609], MC4R[rs17782313], and TMEM18[rs6548238]), can be used [15] for the reassessment of BMI as a causal risk factor for disease risk.
Genetic variation at the fat mass and obesity related locus (FTO) is thought to have a role in the hypothalamic regulation of appetite and food intake or metabolic rate [16]–[21] and has already been used to interrogate the relationship between BMI and acute coronary syndrome, lipid profile in myocardial infarction patients, and mortality [22]–[24]. Furthermore, variation at the same locus has been associated with atherogenic lipid profile and myocardial infarction risk in a manner that suggests an important role for BMI, but that remains unclear [23]. Although, the mechanism of the association between common variation at MC4R and TMEM18 loci and adiposity is currently unclear, these genotypes may still be used to provide evidence of the role of BMI in IHD risk. Indeed, the use of multiple independent genetic instruments for a single risk factor in the undertaking of Mendelian randomisation experiments is recognised as a favourable approach [25].
The aim here was to test the hypothesis that known positive observational relationships between BMI and IHD are causal in two well-sized general population studies (the Copenhagen General Population Study [CGPS]; n = 54,613 [3,780 patients with IHD] and the Copenhagen City Heart Study [CCHS]; n = 10,474 [2,006 patients with IHD]) and in a large collection of IHD patients with matched controls (the Copenhagen Ischaemic Heart Disease Study [CIHDS]; n = 10,540 [5,270 patients with IHD]). Analyses were designed to use an allele score as an unconfounded marker of BMI, and to take advantage of the use of loci FTO(rs9939609), MC4R(rs17782313), and TMEM18(rs6548238) as multiple independent instruments for BMI in efforts to address the potential complicating issue of biological confounding (or pleiotropy). In these analyses, allele score is used as an instrument for assessing the causal relationship between BMI increase and increased IHD risk, which is then directly compared with the observational BMI-IHD association. To evaluate “raw” data, we also show the different parts of the analyses separately, that is, first the BMI-IHD association, second the allele score-BMI association, and third the allele score-IHD association.
Methods
Participants
All participants were white and of Danish descent; this information is available through the national Danish Central Person Registry. No participants appeared in more than one of the three studies. The studies were approved by Danish ethical committees and Herlev Hospital.
Copenhagen General Population Study
This general population study was initiated in 2003 with ongoing enrolment [26]–[29]. IHD endpoints have been collected from 1976 to May 2009. Individuals were selected on the basis of the national Danish Civil Registration System to reflect the adult Danish population aged 20–100 y. Data were obtained from a questionnaire, a physical examination, blood samples, and from DNA. At the time of genotyping 59,883 participants had been included; of these, 5,270 were used as controls in the CIHDS (see below), leaving 54,613 for analyses in the CGPS.
Copenhagen City Heart Study
This prospective general population study was initiated in 1976–1978 with follow-up examinations in 1981–1983, 1991–1994, and 2001–2003 [26]. Participants were recruited and examined exactly as in the CGPS. DNA was available on 10,474 participants attending the 1991–1994 and/or 2001–2003 examinations.
Copenhagen Ischemic Heart Disease Study
This case-control study comprises 5,270 patients from the greater Copenhagen area referred for coronary angiography to Copenhagen University Hospital during the period 1991–2009 and 5,270 unmatched controls without IHD randomly sampled from the CGPS. Beside a diagnosis of IHD as described below, these patients also had stenosis/atherosclerosis on coronary angiography and/or a positive exercise electrocardiography test.
Ischemic Heart Disease
In all three studies, information on diagnosis of IHD (World Health Organization International Classification of Diseases: ICD8 410–414; ICD10 I20–I25) was collected and verified from existing data from 1976 until May 2009 by reviewing all hospital admissions and diagnoses entered in the national Danish Patient Registry and all causes of death entered in the national Danish Causes of Death Registry. Even though some individuals entered into our studies after 1976, we have complete information on all participants on any hospitalisation or death from IHD from 1976 through 2009 through these registries. IHD was angina pectoris and/or myocardial infarction (ICD8 410; ICD10 I21–I22), based on characteristic chest pain, electrocardiographic changes, and/or elevated cardiac enzymes. Follow-up was 100% complete, that is, no individual was lost to follow-up in any of the studies.
Genotyping
Genotyping was conducted blind to phenotypic data. In the absence of genomewide data, the ABI PRISM 7900HT Sequence Detection system (Applied Biosystems Inc.) was used to genotype the BMI instrument loci: FTO(rs9939609), MC4R(rs17782313), and TMEM18(rs6548238) using TaqMan assays. Polymorphisms were selected as those with the largest known common effect sizes for association with BMI in European populations [14],[30]. Genotyping was verified by DNA sequencing, quality control genotyping re-runs were performed twice, and 99.96% of all available participants were genotyped. To act as an aggregate instrument for BMI, a simple score of 0–6 was constructed as the sum of the number of higher BMI-associated alleles across the three genotypes in each study. To check results from this simplest form of allelic score, weighted allele score was also calculated. This score was generated by taking the weighted sum of the number of BMI “elevating” alleles at each locus scaled per standard deviation increase in BMI. Independent gene variant/BMI effect estimates used were taken from the largest available GWAS for BMI to date [14].
Body Mass Index
BMI was calculated as measured weight (kg) divided by measured height squared (m2). To exclude influence of age and sex on our results, BMI was standardised into age - and sex-adjusted Z-scores within each study separately (Table S1). One Z-score corresponds to a BMI standard deviation of 4 kg/m2; thus, for easy interpretation of data, results in Z-scores were converted to BMI values in kg/m2. Participants with BMI greater than 50 kg/m2 were excluded from observational and instrumental variable estimates. BMI measurements were not available for the patients in the CIHDS, hence observational estimates of the IHD-BMI association are not given for this study.
Other Covariates
Smoking was categorized from self-reported data as ever versus never smoked, alcohol consumption was categorized as <14/21 or ≥14/21 units per week for women/men (1 unit = 12 g), education as schooling for <10, ≥10 to <13, and ≥13 y, and annual income as <100,000DKK, 100,000DKK–400,000DKK, 400,000DKK–600,000DKK, and >600,000DKK. Use of statins was recorded at examination. Measured systolic and diastolic blood pressure was recorded as described previously [31] and adjusted for antihypertensive medication by adding a constant value of 10 mmHg and systolic blood pressure and 5 mmHg for diastolic blood pressure [32]. Plasma levels of triglycerides, glucose, high-density lipoprotein cholesterol, and low-density lipoprotein cholesterol were measured using standard hospital assays. Time between IHD event and BMI measurement (“event time”) was assessed as a confounding factor in supplementary analyses.
Statistical Analysis
All analyses were performed in Stata version 11 (StataCorp). For genotypes a deviation from Hardy-Weinberg equilibrium was investigated using a Pearson chi-squared test. Observational estimates of odds ratios (ORs) of IHD per unit increase in standardised BMI, allele score, and potential confounders were estimated using logistic regression. Estimates of the association of standardised BMI with allele score and potential confounders were performed using linear regression. Associations of potential confounders by genotype and allele score were estimated using logistic regression, linear regression, and Pearson's chi-squared test.
Instrumental variable estimates of causal ORs were derived using the Wald-type estimator [33], which involves taking the ratio of the IHD-allele score log OR to the standardised BMI-allele score coefficient and then exponentiating to express as an OR. The standardised BMI-allele score coefficient comes from all individuals from the general population with BMI available, that is, all participants other than those in the CIHDS. Standard errors of Wald-type instrumental variable log ORs were derived using the delta method [34]. Instrumental variable estimates derived from this approach (which is the most efficient use of data) were verified by comparing them to analyses in the CGPS and CCHS using a logistic structural mean model fitted using the three genotypes as separate, weighted, instruments [35]; these models were fitted in the CGPS and CCHS as they require observations of genotypes, BMI, and IHD status for each individual. In these models the joint validity of the multiple instruments was investigated using Hansen's over-identification test [36]. If such a test is rejected it indicates one or more of the instruments may not be valid instruments. As a comparison to using a non-weighted allele score, analyses were also undertaken using a weighted allele score.
In a case-control study like the CIHDS, the allele score-IHD association is valid as in cohort studies like the CGPS and the CCHS because it is not affected by IHD status and represents lifecourse BMI-associated IHD risk. BMI may be affected by IHD, because some patients loose weight after an IHD diagnosis. Therefore, the allele score-BMI association entering into the instrumental variable analyses is best derived from people in the general population as done in the present study. The advantage of including the CIHDS together with the CGPS and the CCHS is that it adds considerable statistical power to the combined analyses, as done by ourselves in previous studies [27]–[29]. Importantly, however, when the CGPS and the CCHS are combined and CIHDS is excluded, the results are similar.
Meta-analysis pooled estimates were obtained using the random effects meta-analysis model implemented in the user-written Stata command “metan” [37]. In each meta-analysis, between-study heterogeneity was assessed using the I2 statistic and the Cochran heterogeneity Q test. Meta-analysis of ORs was performed on the log scale. Analysing the three studies as a single dataset was undertaken, but results are not reported as they were similar to those of the meta-analyses throughout.
Results
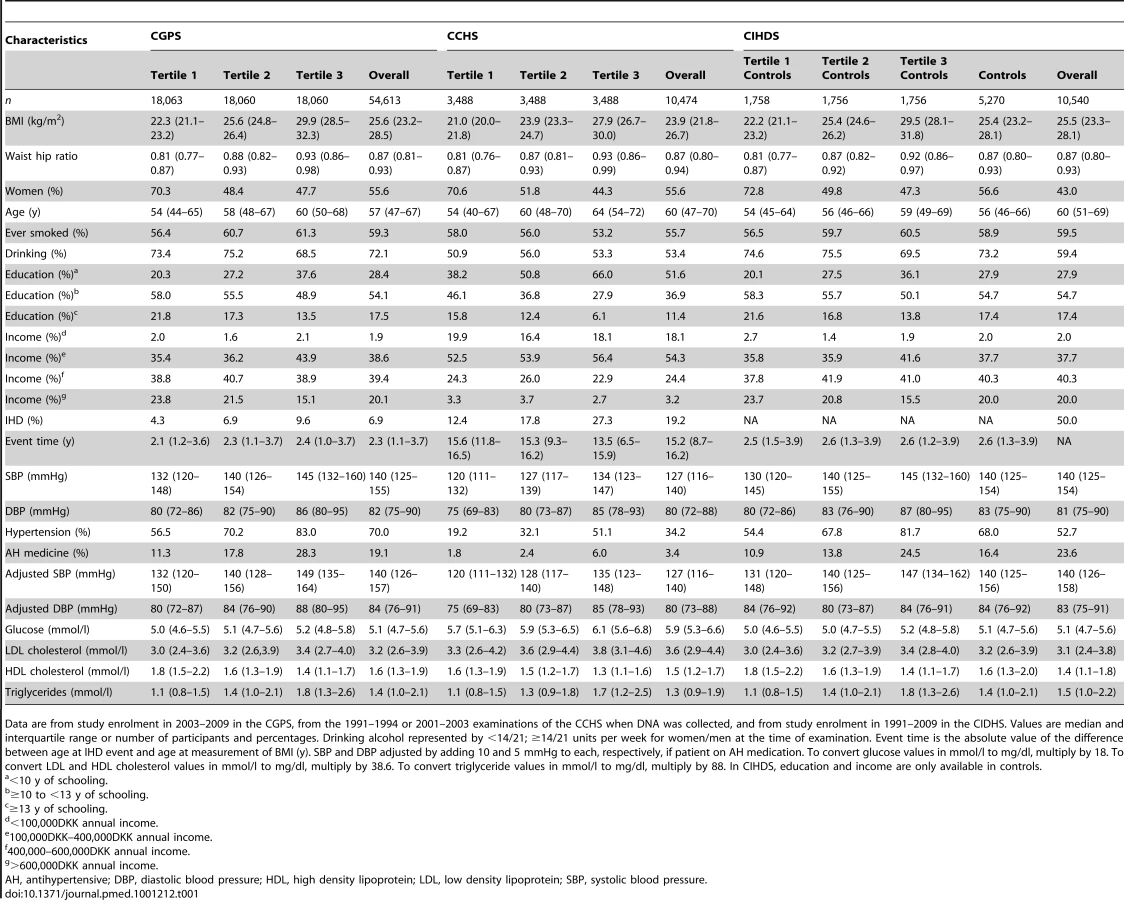
The numbers of IHD patients were 3,780 of 54,613 participants in the CGPS (79% prevalent and 21% incident), 2,006 of 10,474 participants in the CCHS (22% prevalent and 78% incident), and 5,270 of 10,540 participants in the CIHDS (100% prevalent). Baseline characteristics of participants in the three studies are shown in Table 1. Genotypes scored for FTO(rs9939609), MC4R(rs17782313), and TMEM18(rs6548238) were in Hardy-Weinberg equilibrium in the three studies and the distribution of the allele score was approximately normal (Table 2).

BMI and IHD Risk: Observational Estimate
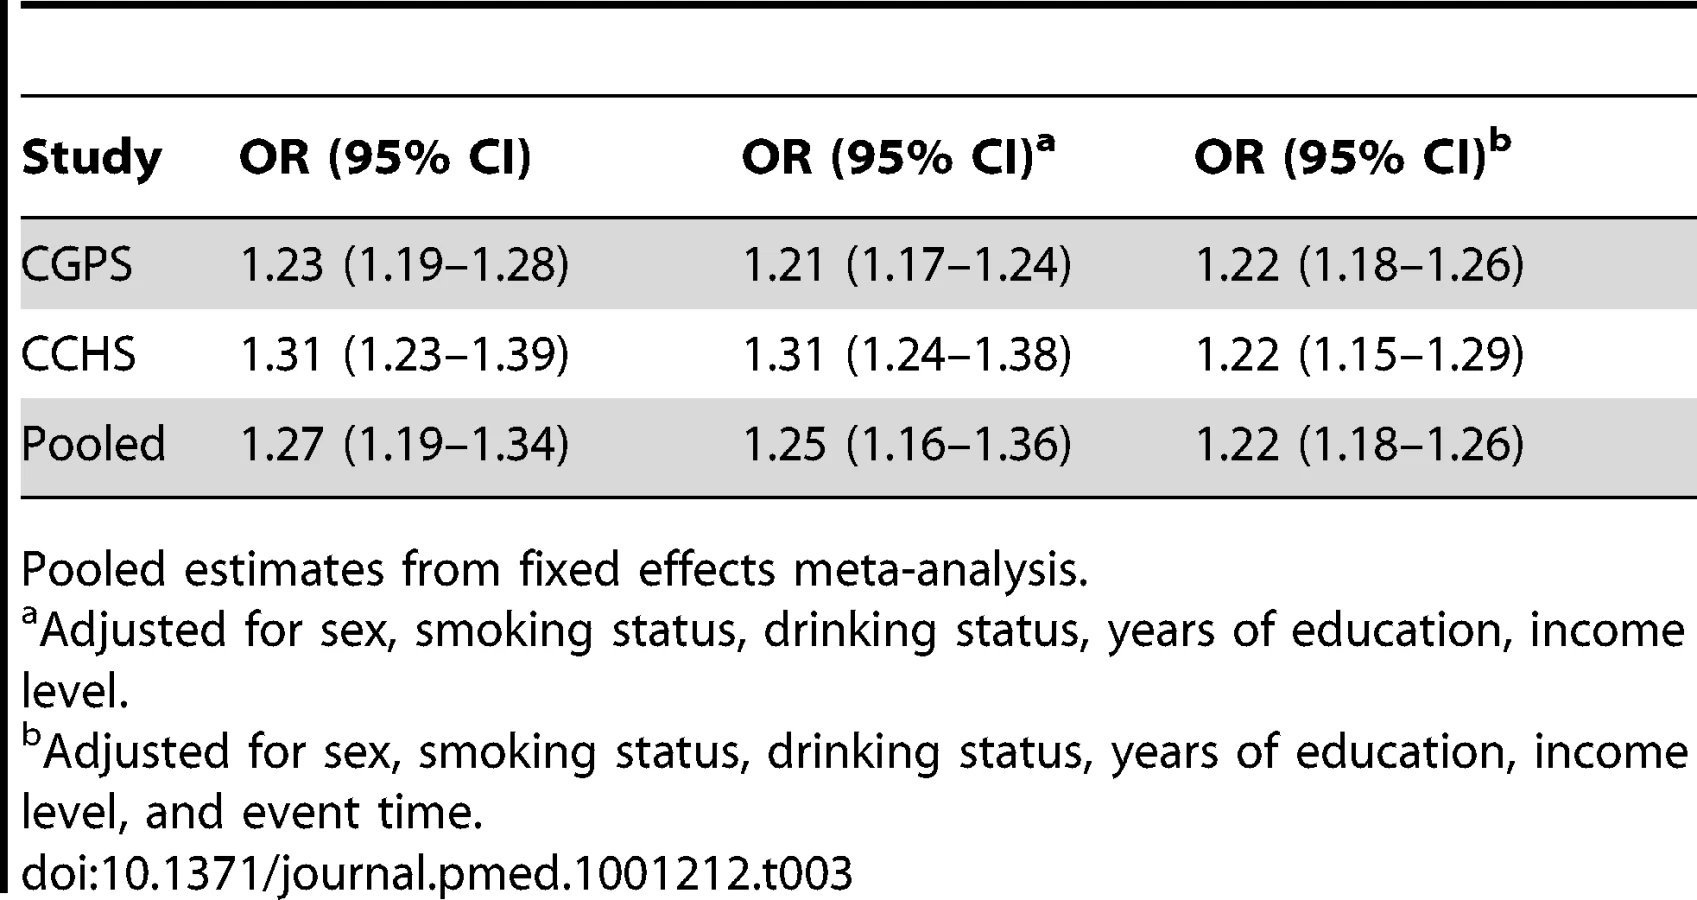
In the general population, for one standard deviation (4 kg/m2) increase in BMI, the observational ORs for IHD were 1.23 (95% CI 1.19–1.28) for the CGPS and 1.31 (95% CI 1.23–1.39) for the CCHS (Figure 1). The meta-analysis pooled OR was 1.26 (95% CI 1.19–1.34), and there was some evidence of between-study heterogeneity (I2 = 63; p = 0.10), but this was incorporated in the random effects model (Figure 2). These observational associations were unaffected on adjustment for the potential confounders of sex, smoking status, drinking status, years of education, and income level and attenuated on additional adjustment for event time (Table 3). If ever smokers were separated into current and former smokers and drinkers into moderate and heavy drinkers, observational associations were unaffected. Where available (CPGS), analysis including adjustment for statin use showed evidence for an attenuation in estimates of the relationship between BMI and IHD risk (adjusted OR for IHD per 4 kg/m2 increase in BMI 1.12 [1.08–1.16]).


Genotype and Allele Score Associations with BMI
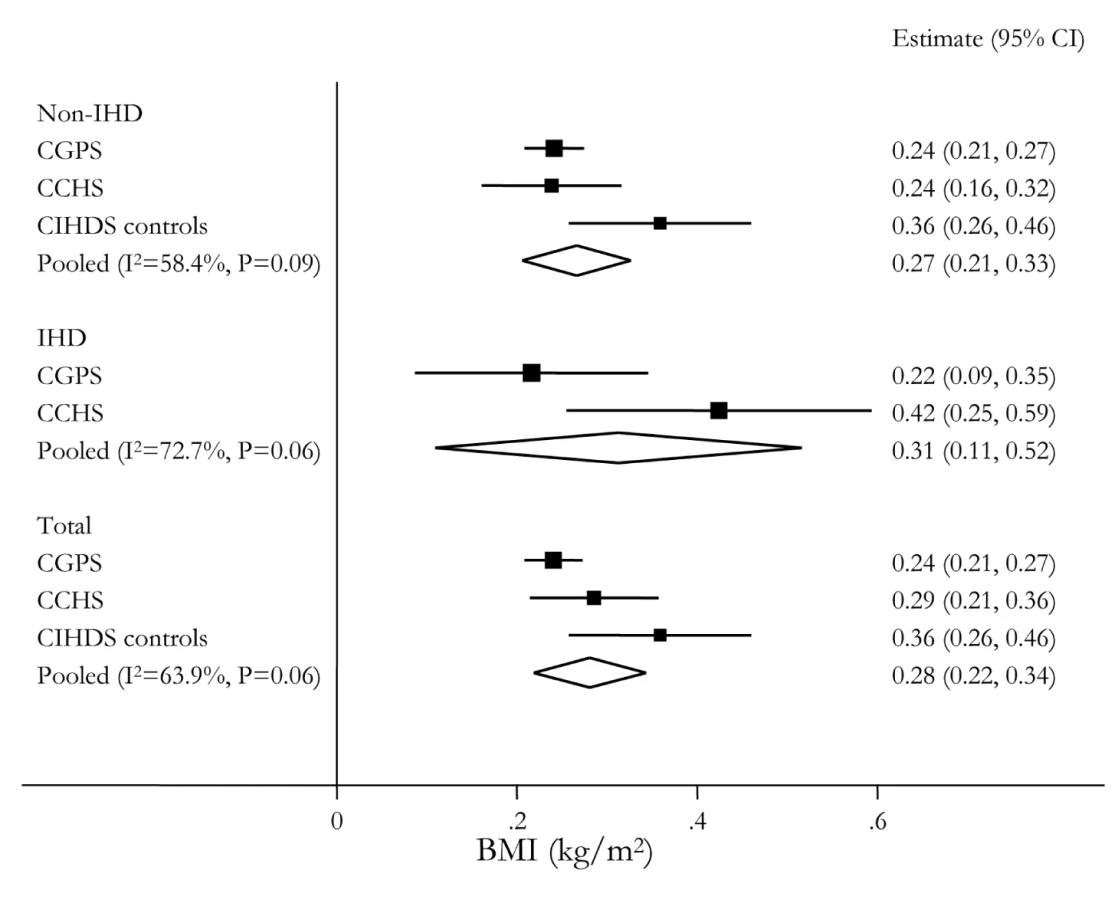
Pooled across the three studies, each additional adiposity-related allele from the allele score was associated with a 0.28 kg/m2 (95% CI 0.22–0.34) increase in BMI (Figure 3), corresponding to a 1.68 kg/m2 (95% CI 1.31–2.06) BMI increase for a comparison of the minimum (0) to maximum (6) carriage of adiposity increasing alleles. These results were similar across cases and controls in the three separate studies.
Associations with Confounding Factors
In an analysis such as this one, it is important to examine whether potential confounding factors could be part of the explanation behind an observational BMI-IHD association, or behind a causal BMI-IHD association estimated using allele score in instrumental variable analysis. For a potential confounder to be part of the explanation behind an association, the factor in question needs to associate both with the exposure and the outcome.
We therefore examined both the association between potentially confounding factors (sex, age, smoking status, drinking status, education, income, and event time) and our primary exposure (BMI), our primary outcome (IHD), and our instrumental variables (genotypes and allele score). For both our primary outcome and exposure, there was strong evidence for association between both BMI, IHD, and drinking, education, income, and event time (Tables S2 and S3). In contrast, genotypes at FTO(rs9939609), MC4R(rs17782313), and TMEM18(rs6548238) and the allele score demonstrated no reliable evidence of association with potential confounders (Table 4).

In aggregate, these data suggest that several factors likely could confound the observational BMI-IHD association. In contrast, it is unlikely that these same factors should confound the instrumental variable analyses assessing the causal BMI-IHD association, as these factors were not associated with genotype or allele score.
Allele Score and IHD Risk
In the CGPS the OR for IHD per risk allele, that is per 0.28 kg/m2 increase, was 1.02 (95% CI 0.98–1.05), in the CCHS 1.05 (95% CI 1.01–1.11), and in the CIHDS 1.03 (95% CI 1.00–1.07). The meta-analysed OR per risk allele was 1.03 (95% CI 1.01–1.05), with no evidence of between-study heterogeneity (I2 = 0, p = 0.43) (Figure 4). This finding corresponds to an OR for IHD of 1.20 (95% CI 1.05–1.36) for a maximum allele score comparison of 0–6 adiposity increasing alleles corresponding to a 1.68 kg/m2 increase. The increasing trend in BMI with allele score, distribution of allele score, and the relative differences in BMI by IHD status can be seen simultaneously in Figure 5. The relatively high value of BMI at 0 allele score is likely due to the play of chance, given that there are relatively few individuals with this allele score. The absolute BMI values are higher in the CGPS because participants were recruited approximately 15 y after the CCHS, during which time Danish people on average become heavier for height. Where available (CPGS), analysis including adjustment for statin use showed no strong evidence of attenuation, (adjusted OR for IHD per risk allele 1.01 [95% CI 0.98–1.05]).


BMI and IHD Risk: Instrumental Variable Causal Estimate Using Allele Score
An instrumental variable analysis using allele score examines the causal effect of a lifecourse change in BMI on the risk of IHD. The instrumental variable estimate of the causal relationship between a 4 kg/m2 increase in BMI and IHD showed an OR of 1.31 (95% CI 0.76–2.26) in the CGPS, 2.11 (95% CI 1.05–4.24) in the CCHS, and 1.46 (95% CI 0.96–2.24) in the CIHDS. The meta-analysed causal OR was 1.52 (95% CI 1.12–2.05), with no evidence of between-study heterogeneity (I2 = 0, p = 0.56) (Figure 2). These results were similar using a weighted allele score (Figure S1), rather than the non-weighted model used above. There was no strong evidence of a difference between instrumental variable and observational ORs (p = 0.25 for difference). Where available (CPGS), analysis including adjustment for statin use showed that, in contrast to observational analysis, there was no evidence for an attenuation of the estimate (adjusted OR for IHD per 4 kg/m2 increase in BMI 1.28 [0.69–2.37]).
Instrumental variable estimates based on the use of individual SNPs gave broadly similar results, but with reduced statistical power (Figure S2). Also instrumental variable estimates from a logistic structural mean model gave similar estimated causal ORs (Figure S3). In these models there was no evidence against the joint validity of using these SNPs as multiple instruments (CGPS, p = 0.97; CCHS, p = 0.91).
As the relationships between BMI and health outcomes can be attenuated with age, we performed subgroup analyses in individuals above and below age 60 y. There was evidence of smaller observational ORs for IHD in those above versus below 60 y (p = 0.02 for difference). This finding was reflected in evidence for interaction between age group and BMI when included in the logistic regression of IHD on BMI and age group (p = 0.01 [CGPS], p<0.001 [CCHS] for interaction). Instrumental variable estimates gave no evidence of difference by age (Figure 6).

BMI and IHD Risk: Observational Versus Instrumental Variable Causal Estimate Using Allele Score
In summary, in observational analyses for every 4 kg/m2 increase in BMI, the OR for IHD was 1.26 (95% CI 1.19–1.34), corresponding to a 26% increased IHD risk (Figure 2). For comparison, in instrumental variable analysis using the allele score the causal IHD ORs for a 4 kg/m2 increase in BMI was 1.52 (95% CI 1.12–2.05), corresponding to a 52% increased IHD risk.
Discussion
In two large studies of the general population, observational estimates suggested a 26% increase in risk of IHD for every 4 kg/m2 increase in BMI. A unit change of an allelic score combining genotypes from three established genetic associates of BMI was associated with a 0.28 kg/m2 change in BMI, a change neither correlated with classic confounding features nor affected by reverse causation. Using this as an instrument for lifecourse BMI difference in 75,627 Danish individuals from the same general population studies and a further case-control series, instrumental variable analysis was employed to re-estimate the causal relationship between BMI and IHD risk. In doing this, estimates suggest that the same increase in BMI is causally related to an increased risk of IHD consistent with observational estimates, if not greater. Whilst features such as statin use appear to impact observational estimates, those based on genetic instruments for BMI appear consistent across sub-analyses. Importantly, we not only qualify the likely causal role of BMI (rather than just an observational associate), we are able to quantify this effect. It should be mentioned that the causal relationship between increased BMI and increased risk of IHD may be realised through intermediate factors like hypertension, dyslipidemia, and type 2 diabetes.
The design of this study and the use of genetic variation as a proxy marker for elevated BMI lead to additional discussion points. Firstly, the use of effective instruments for BMI has allowed for forms of study bias to be effectively accounted for. For example, observational relationships between BMI and IHD risk tend to increase with time from BMI measurement largely as a result of tracking and the natural progression of BMI with age [2]. In contrast to this, where IHD events are recorded before BMI, reverse causation can reduce the strength of relationships between BMI and IHD, though illness-induced weight loss adds further complication to the assessment of relationships between body weight and mortality [11]. Genetic instruments are not related to this time difference and the use of these as proxy markers for BMI removes the limitations that can be brought about by the existence of these biases. Use of genetic variation as a proxy measure for lifecourse BMI change also helps to avoid regression dilution bias, or the artefactual underestimation of epidemiological associations owing to a failure of baseline measurements to reliably collect the “usual” levels of an exposure [38]. Existing studies have made efforts to account for this and other “confounding at baseline” issues [2],[3],[6]; however, these effects are difficult to quantify. Owing to the consistent nature of genotype effects through adult life [14],[39], this type of loss in measurement precision is minimised. Indeed, as a result of Mendelian randomisation-derived estimates modelling lifecourse differences in BMI, we would anticipate effect estimates that can be larger than those from more conventional observational approaches, as seen in this case.
Despite these benefits, there are a number of potential limitations in Mendelian randomisation studies like the present one [13],[40],[41]. However, the complicating effect of population stratification in Mendelian randomisation studies is likely to have been avoided through the use of an ethnically homogenous white population in the present study. Also, pleiotropy and the potentially confounding effects of linkage disequilibrium are likely avoided owing to the use of multiple genetic polymorphisms, each associated with increased BMI and each acting on BMI independently and via different pathways. Nevertheless, canalisation cannot be completely excluded as a limitation of the present study; however, as canalisation theoretically acts to buffer the effect of genetic deviations, it can obscure associations between genes and IHD, but it is unlikely to explain away the results in this study. Also, although the analyses provide insight into the likely causal effect of lifecourse elevations in BMI, we are not well placed to comment on the impact of acute changes. Lastly, there are known limitations to the use of BMI as a marker for adiposity or other possible anthropometrically related aetiological contributions to IHD risk, and using alternative measures may prove more informative [42]. Nevertheless, these potential limitations to BMI cannot explain the results in this study.
In the context of available evidence concerning the causal role of BMI as an intermediate risk factor for IHD, we can speculate that the explanation for the causal association is straightforward: increased BMI contributes causally to well-known cardiovascular risk factors including hypertension, dyslipidemia, and type 2 diabetes, factors that may then go on to cause the observed increased risk of IHD. Similar evidence supporting the role of elevated BMI in the generation of a common risk profile is emerging [23],[24],[31],[43],[44] and in combination with the agreement of these findings with those of observational studies, an important role for BMI is evident from work using other techniques to avoid the problems of confounding and reverse causation [22],[45],[46].
In conclusion, for every 4 kg/m2 increase in BMI, observational estimates suggested a 26% increase in IHD risk with instrumental variable analysis suggesting a causal 52% increase in IHD risk. These data add novel evidence to support a causal link between increased BMI and increased IHD risk, while the mechanism of this effect is likely to be operating through intermediate factors. In the context of recent, high impact, observational findings, this work has important policy implications for public health given the continuous nature of the BMI-IHD association, the modifiable nature of BMI, and the likely benefits of reducing BMI even by moderate levels. Finally, this analysis demonstrates the value of observational studies and their ability to provide essentially unbiased results because of inclusion of genetic data avoiding confounding, reverse causation, and bias.
Supporting Information
Zdroje
1. MansonJEColditzGAStampferMJWillettWCRosnerB 1990 A prospective study of obesity and risk of coronary heart disease in women. N Engl J Med 322 882 889
2. Prospective StudiesCWhitlockGLewingtonSSherlikerPClarkeR 2009 Body-mass index and cause-specific mortality in 900 000 adults: collaborative analyses of 57 prospective studies. Lancet 373 1083 1096
3. Ni MhurchuCRodgersAPanWHGuDFWoodwardM 2004 Body mass index and cardiovascular disease in the Asia-Pacific Region: an overview of 33 cohorts involving 310 000 participants. Int J Epidemiol 33 751 758
4. KurthTGazianoJMRexrodeKMKaseCSCookNR 2005 Prospective study of body mass index and risk of stroke in apparently healthy women. Circulation 111 1992 1998
5. ZhengWMcLerranDFRollandBZhangXInoueM 2011 Association between body-mass index and risk of death in more than 1 million Asians. N Engl J Med 364 719 729
6. SongYMSungJDavey SmithGEbrahimSSongY-M 2004 Body mass index and ischemic and hemorrhagic stroke: a prospective study in Korean men. Stroke 35 831 836
7. BogersRPBemelmansWJHoogenveenRTBoshuizenHCWoodwardM 2007 Association of overweight with increased risk of coronary heart disease partly independent of blood pressure and cholesterol levels: a meta-analysis of 21 cohort studies including more than 300 000 persons. Arch Intern Med 167 1720 1728
8. RexrodeKMHennekensCHWillettWCColditzGAStampferMJ 1997 A prospective study of body mass index, weight change, and risk of stroke in women. JAMA 277 1539 1545
9. ZhouMOfferAYangGSmithMHuiG 2008 Body mass index, blood pressure, and mortality from stroke: a nationally representative prospective study of 212,000 Chinese men. Stroke 39 753 759
10. ShaharE 2009 The association of body mass index with health outcomes: causal, inconsistent, or confounded? Am J Epidemiol 170 957 958
11. FlegalKMGraubardBIWilliamsonDFCooperRS 2011 Reverse causation and illness-related weight loss in observational studies of body weight and mortality. Am J Epidemiol 173 1 9
12. GreenbergJA 2006 Correcting biases in estimates of mortality attributable to obesity. Obesity 14 2071 2079
13. Davey SmithGEbrahimS 2003 ‘Mendelian Randomisation’: can genetic epidemiology contribute to understanding environmental determinants of disease? Int J Epidemiol 32 1 22
14. SpeliotesEKWillerCJBerndtSIMondaKLThorleifssonG 2010 Association analyses of 249,796 individuals reveal 18 new loci associated with body mass index. Nat Genet 42 937 948
15. GreenlandS 2000 An introduction to instrumental variables for epidemiologists. Int J Epidemiol 29 722 729
16. ChurchCMoirLMcMurrayFChristopheGBanksGT 2010 Overexpression of Fto leads to increased food intake and results in obesity. Nat Genet 42 1086 1093
17. ChurchCLeeSBaggEAMcTaggartJSDeaconR 2009 A mouse model for the metabolic effects of the human fat mass and obesity associated FTO gene. PLoS Genetics 5 e1000599 doi:10.1371/journal.pgen.1000599
18. TungYCAyusoEShanXBoschFO'RahillyS 2010 Hypothalamic-specific manipulation of Fto, the ortholog of the human obesity gene FTO, affects food intake in rats. PLoS ONE 5 e8771 doi:10.1371/journal.pone.0008771
19. GerkenTGirardCATungYLWebbyCJSaudekV 2007 The obesity-associated FTO gene encodes a 2-oxoglutarate-dependent nucleic acid demethylase. Science 318 1469 1472
20. TimpsonNJEmmettPFraylingTMRogersIHattersleyAT 2008 The FTO/obesity associated locus and dietary intake in children. Am J Clin Nutr 88 971 978
21. FischerJKochLEmmerlingCVierkottenJPetersT 2009 Inactivation of the Fto gene protects from obesity. Nature 458 894 898
22. HubacekJAStanekVGebauerovaMPilipcincovaADlouhaD 2010 A FTO variant and risk of acute coronary syndrome. Clinica Chimica Acta 411 1069 1072
23. DoneyASFDannfaldJKimberCHDonnellyLAPearsonE 2009 The FTO gene is associated with an atherogenic lipid profile and myocardial infarction in patients with type 2 diabetes: a Genetics of Diabetes Audit and Research Study in Tayside Scotland (Go-DARTS) study. Circ Cardiovasc Genet 2 255 259
24. FreathyRMTimpsonNJLawlorDAPoutaABen-ShlomoY 2008 Common variation in the FTO gene has a metabolic impact consistent with its effect on BMI. Diabetes 57 1419 1426
25. PalmerTMLawlorDAHarbordRMSheehanNATobiasJH 2011 Using multiple genetic variants as instrumental variables for modifiable risk factors. Stat Methods Med Res In press
26. NordestgaardBGBennMSchnohrPTybjaerg-HansenA 2007 Nonfasting triglycerides and risk of myocardial infarction, ischemic heart disease, and death in men and women. JAMA 298 299 308
27. Frikke-SchmidtRNordestgaardBGSteneMCASethiAARemaleyAT 2008 Association of loss-of-function mutations in the ABCA1 gene with high-density lipoprotein cholesterol levels and risk of ischemic heart disease. JAMA 299 2524 2532
28. ZachoJTybjaerg-HansenAJensenJSGrandePSillensenH 2008 Genetically elevated C-reactive protein and ischaemic vascular disease. N Engl J Med 359 1897 1908
29. KamstrupPRTybjaerg-HansenASteffensenRNordestgaardBG 2009 Genetically elevated Lipoprotein(a) and increased risk of myocardial infarction. JAMA 301 2331 2339
30. WillerCJSannaSJacksonAUScuteriABonnycastleLL 2008 Newly identified loci that influence lipid concentrations and risk of coronary artery disease. Nat Genet 40 161 169
31. TimpsonNJHarbordRDavey SmithGZachoJTybjaerg-HansenA 2009 Does greater adiposity increase blood pressure and hypertension risk? Mendelian randomisation using FTO/MC4R genotype. Hypertension 54 84 90
32. TobinMDSheehanNAScurrahKJBurtonPR 2005 Adjusting for treatment effects in studies of quantitative traits: antihypertensive therapy and systolic blood pressure. Stat Med 24 2911 2935
33. DidelezVMengS 2010 Assumptions of IV methods for observational epidemiology. Stat Sci 25 22 40
34. ThomasDCLawlorDAThompsonJRThomasDCLawlorDA 2007 re: Estimation of bias in nongenetic observational studies using “Mendelian triangulation” by Bautista et al. Ann Epidemiol 17 511 513
35. VansteelandtSGoetghebeurE 2003 Causal inference with generalised structural mean models. J R Stat Soc Series B Stat Methodol 65 817 835
36. HansenLP 1982 Large sample properties of generalized method of moments estimators. Econometrica 50 1029 1054
37. HarrisR 2008 metan: fixed - and random-effects meta-analysis. Stata J 8 3 28
38. ClarkeRShipleyMLewingtonSYoungmanLCollinsR 1999 Underestimation of risk associations due to regression dilution in long-term follow-up of prospective studies. Am J Epidemiol 150 341 353
39. FraylingTMTimpsonNJWeedonMNZegginiEFreathyRM 2007 A common variant in the FTO gene is associated with body mass index and predisposes to childhood and adult obesity. Science 316 889 894
40. LawlorDAHarbordRMSterneJACTimpsonNJDavey SmithG 2008 Mendelian randomization: Using genes as instruments for making causal inferences in epidemiology. Stat Med 27 1133 1163
41. WaddingtonCH 1942 Canalisation of development and the inheritance of acquireed characters. Nature 150 563 565
42. YusufSHawkenSOunpuuSBautistaLFranzosiMG 2005 Obesity and the risk of myocardial infarction in 27,000 participants from 52 countries: a case-control study. Lancet 366 1640 1649
43. TimpsonNJNordestgaardBGHarbordRMZachoJFraylingTM 2010 C-reactive protein levels and body mass index: elucidating direction of causation through reciprocal Mendelian randomization. Int J Obes (Lond) 35 300 308
44. TimpsonNJLawlorDAHarbordRGauntTRDayIN 2005 C-reactive protein and metabolic syndrome: Mendelian randomisation suggests associations are non-causal. Lancet 366 1954 1959
45. BjorgeTEngelandATverdalADavey SmithG 2008 Body mass index in adolescence in relation to cause-specific mortality: a follow-up of 230,000 Norwegian adolescents. Am J Epidemiol 168 30 37
46. Davey SmithGSterneJAFraserATyneliusPLawlorDA 2009 The association between BMI and mortality using offspring BMI as an indicator of own BMI: large intergenerational mortality study. BMJ 339 b5043
Štítky
Interní lékařstvíČlánek vyšel v časopise
PLOS Medicine
2012 Číslo 5
- Proces hojení ran krok za krokem a co ho může zkomplikovat
- Limity glykovaného hemoglobinu a význam dalších glykovaných proteinů
- Korelace dávky levothyroxinu s titrem autoimunitních protilátek u primární hypotyreózy
- Plicní hypertenze – syndrom mnoha tváří – vyžaduje přesnou diagnostiku a specializovanou léčbu
- Rána vizitkou (nejen) chirurga
Nejčtenější v tomto čísle
- A Prescription for Improving Drug Formulary Decision Making
- Does Development Assistance for Health Really Displace Government Health Spending? Reassessing the Evidence
- Pregnancy and Infant Outcomes among HIV-Infected Women Taking Long-Term ART with and without Tenofovir in the DART Trial
- Prevalence and Risk of Violence and the Physical, Mental, and Sexual Health Problems Associated with Human Trafficking: Systematic Review
Zvyšte si kvalifikaci online z pohodlí domova
Mazová zátka a její řešení
nový kurzVšechny kurzy