
Characterizing the Epidemiology of the 2009 Influenza A/H1N1 Pandemic in Mexico
Background:
Mexico's local and national authorities initiated an intense public
health response during the early stages of the 2009 A/H1N1 pandemic. In this
study we analyzed the epidemiological patterns of the pandemic during
April–December 2009 in Mexico and evaluated the impact of nonmedical
interventions, school cycles, and demographic factors on influenza
transmission.
Methods and Findings:
We used influenza surveillance data compiled by the Mexican Institute for
Social Security, representing 40% of the population, to study
patterns in influenza-like illness (ILIs) hospitalizations, deaths, and
case-fatality rate by pandemic wave and geographical region. We also
estimated the reproduction number (R) on the basis of the growth rate of
daily cases, and used a transmission model to evaluate the effectiveness of
mitigation strategies initiated during the spring pandemic wave. A total of
117,626 ILI cases were identified during April–December 2009, of which
30.6% were tested for influenza, and 23.3% were positive for
the influenza A/H1N1 pandemic virus. A three-wave pandemic profile was
identified, with an initial wave in April–May (Mexico City area), a
second wave in June–July (southeastern states), and a geographically
widespread third wave in August–December. The median age of laboratory
confirmed ILI cases was ∼18 years overall and increased to ∼31 years
during autumn (p<0.0001). The case-fatality ratio among
ILI cases was 1.2% overall, and highest (5.5%) among people
over 60 years. The regional R estimates were 1.8–2.1, 1.6–1.9,
and 1.2–1.3 for the spring, summer, and fall waves, respectively. We
estimate that the 18-day period of mandatory school closures and other
social distancing measures implemented in the greater Mexico City area was
associated with a 29%–37% reduction in influenza
transmission in spring 2009. In addition, an increase in R was observed in
late May and early June in the southeast states, after mandatory school
suspension resumed and before summer vacation started. State-specific fall
pandemic waves began 2–5 weeks after school reopened for the fall
term, coinciding with an age shift in influenza cases.
Conclusions:
We documented three spatially heterogeneous waves of the 2009 A/H1N1 pandemic
virus in Mexico, which were characterized by a relatively young age
distribution of cases. Our study highlights the importance of school cycles
on the transmission dynamics of this pandemic influenza strain and suggests
that school closure and other mitigation measures could be useful to
mitigate future influenza pandemics.
:
Please see later in the article for the Editors' Summary
Published in the journal:
. PLoS Med 8(5): e32767. doi:10.1371/journal.pmed.1000436
Category:
Research Article
doi:
https://doi.org/10.1371/journal.pmed.1000436
Summary
Background:
Mexico's local and national authorities initiated an intense public
health response during the early stages of the 2009 A/H1N1 pandemic. In this
study we analyzed the epidemiological patterns of the pandemic during
April–December 2009 in Mexico and evaluated the impact of nonmedical
interventions, school cycles, and demographic factors on influenza
transmission.
Methods and Findings:
We used influenza surveillance data compiled by the Mexican Institute for
Social Security, representing 40% of the population, to study
patterns in influenza-like illness (ILIs) hospitalizations, deaths, and
case-fatality rate by pandemic wave and geographical region. We also
estimated the reproduction number (R) on the basis of the growth rate of
daily cases, and used a transmission model to evaluate the effectiveness of
mitigation strategies initiated during the spring pandemic wave. A total of
117,626 ILI cases were identified during April–December 2009, of which
30.6% were tested for influenza, and 23.3% were positive for
the influenza A/H1N1 pandemic virus. A three-wave pandemic profile was
identified, with an initial wave in April–May (Mexico City area), a
second wave in June–July (southeastern states), and a geographically
widespread third wave in August–December. The median age of laboratory
confirmed ILI cases was ∼18 years overall and increased to ∼31 years
during autumn (p<0.0001). The case-fatality ratio among
ILI cases was 1.2% overall, and highest (5.5%) among people
over 60 years. The regional R estimates were 1.8–2.1, 1.6–1.9,
and 1.2–1.3 for the spring, summer, and fall waves, respectively. We
estimate that the 18-day period of mandatory school closures and other
social distancing measures implemented in the greater Mexico City area was
associated with a 29%–37% reduction in influenza
transmission in spring 2009. In addition, an increase in R was observed in
late May and early June in the southeast states, after mandatory school
suspension resumed and before summer vacation started. State-specific fall
pandemic waves began 2–5 weeks after school reopened for the fall
term, coinciding with an age shift in influenza cases.
Conclusions:
We documented three spatially heterogeneous waves of the 2009 A/H1N1 pandemic
virus in Mexico, which were characterized by a relatively young age
distribution of cases. Our study highlights the importance of school cycles
on the transmission dynamics of this pandemic influenza strain and suggests
that school closure and other mitigation measures could be useful to
mitigate future influenza pandemics.
:
Please see later in the article for the Editors' Summary
Introduction
In late March and early April 2009, reports of respiratory hospitalizations and deaths among young adults in Mexico alerted local health officials to the occurrence of atypical rates of respiratory illness at a time when influenza was not expected to reach epidemic levels [1]–[3]. Infections with novel swine-origin influenza A/H1N1 virus were confirmed in California, (United States), on April 21 [4] and in Mexico on April 23 [5]. The Ministry of Health cancelled educational activities in the greater Mexico City area on April 24 and expanded these measures to the rest of the country on April 27 [6]. Additional social distancing interventions were implemented in the greater Mexico City area, including the closure of movie theaters and restaurants and the cancellation of large public gatherings (Table 1) [6]. Schools reopened on May 11 and remained in session until the scheduled summer vacation period, which began in July 2009. Whether these intense interventions were successful in reducing disease transmission has yet to be evaluated, which is important for the control of future pandemics [7].

Increasing our understanding of the age and transmission patterns of the 2009 A/H1N1 influenza pandemic at various geographic scales is crucial for designing more efficient public health interventions against future influenza pandemics. Spatio-temporal variations in influenza transmission can result from variation in population contact rates linked to school cycles or intervention strategies, as well as the timing of a virus's introduction relative to climatic conditions and prior population immunity (e.g., [8],[9]). While variation in the transmission potential and the timing of the spring waves of the 2009 A/H1N1 pandemic have been reported in several countries (e.g., [10]–[16]), there have been no studies thus far concentrating on recurrent pandemic waves in Mexico, one of the countries affected earliest by the 2009 A/H1N1 influenza pandemic. Here, we analyze the age - and state-specific incidence of influenza morbidity and mortality in 32 Mexican States, on the basis of reports to the Mexican Institute for Social Security (IMSS), a private medical system that covers 40% of the Mexican population. We also quantify the association between local influenza transmission rates, school cycles, and demographic factors.
Methods
Epidemiological and Population Data
We relied on the epidemiological surveillance system of IMSS, described in detail by Echevarria-Zuno et al. [17]. IMSS is a tripartite Mexican health system covering workers in the private sector and their families, a group that comprises roughly 40% of the Mexican population (107 million individuals), with a network of 1,099 primary health care units and 259 hospitals nationwide. Overall, the age distribution of the population affiliated with IMSS is representative of the general population of Mexico (chi-square test, p = 0.18) (Text S1, figure A) [18]. The male-to-female ratio among the population affiliated with IMSS (47 : 53) is similar to that of the general population (49 : 51).
Active surveillance for severe pneumonia started at all IMSS hospitals after a first epidemiological alert was issued on April 17, 2009. On April 28 the surveillance system was expanded to include influenza-like illness (ILI) patients visiting primary health care units and hospitals as well as influenza-related deaths. Patient information was entered into an online surveillance system by hospital or clinic epidemiologists. ILI was defined as a combination of cough, headache, and fever (except for persons over 65 y) with one or more of the following symptoms: sore throat, rhinorrhea, arthralgias, myalgia, prostration, thoracic pain, abdominal pain, nasal congestion, diarrhea, and irritability (for infants only) [17]. Respiratory swabs were obtained for about a third of cases with constant sampling intensity across states, time, and age groups (Text S1, figures B and C and table A). Swabs were tested for A/H1N1 influenza virus by real-time reverse transcription PCR [19] by the Instituto de Diagnóstico y Referencia Epidemiológica (InDRE) until May 25, 2009, after which point samples were analyzed by La Raza, an IMSS laboratory certified by InDRE [17].
We obtained patient age, date of symptom onset, disease outcome (inpatient, outpatient, and death), and reporting state (including 31 states plus the Federal District, which we collectively refer to as “32 states” for simplicity) for ILI and laboratory-confirmed A/H1N1 pandemic influenza cases reported between April 1 and December 31, 2009. We also obtained population data by state and age group for all persons affiliated with IMSS in 2009 to calculate incidence rates.
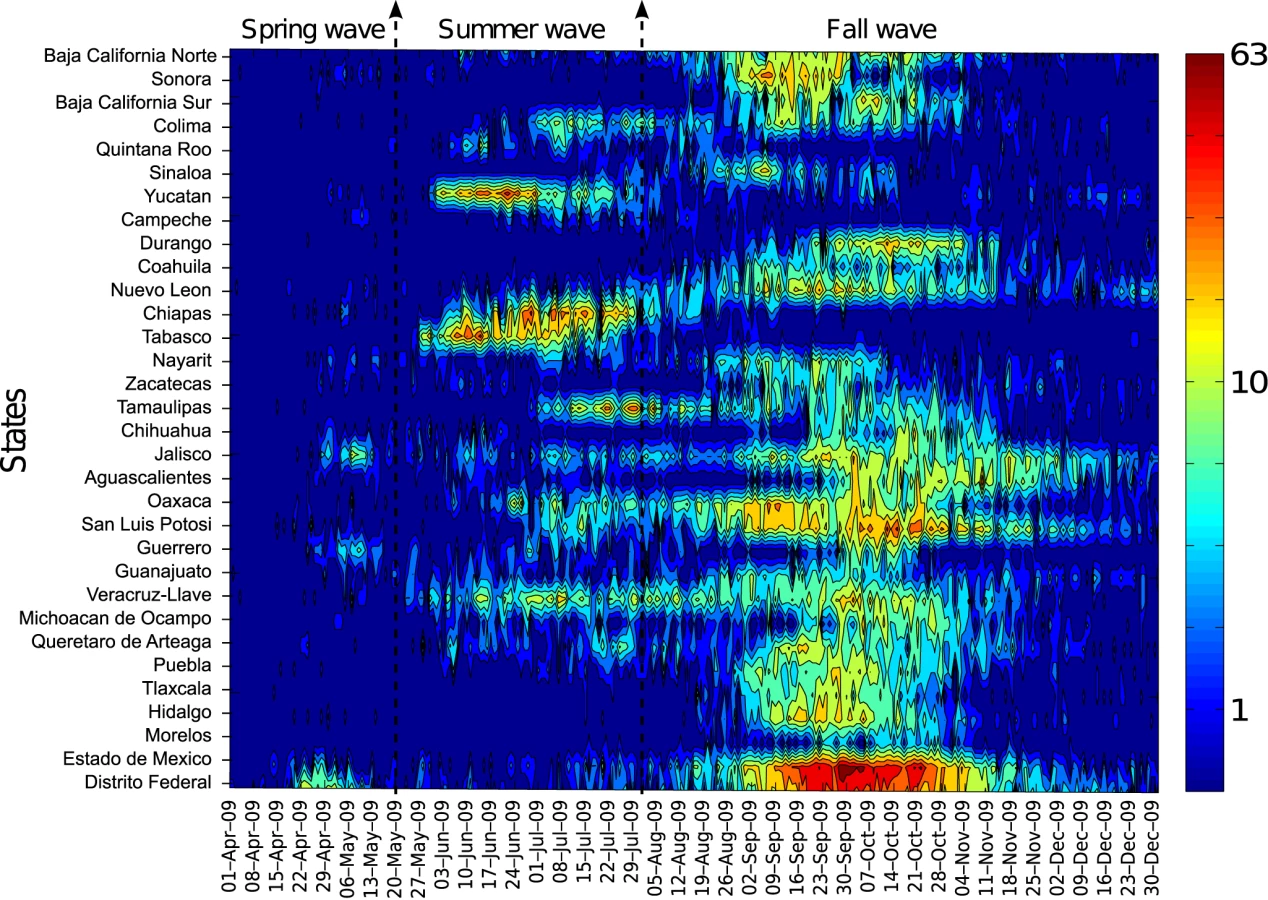
Spatial Distribution of Pandemic Waves
We compiled state - and age-specific time series of incident ILI and A/H1N1 pandemic influenza cases by day of symptom onset to analyze the geographic spread of the pandemic across Mexico. We defined three temporally distinct pandemic waves in the spring (April 1–May 20), summer (May 21–August 1), and fall (August 2–December 31) of 2009 on the basis of patterns in national A/H1N1 influenza incidence time series (Figure 1). For each state and pandemic wave, we recorded the cumulative number of cases, cumulative incidence rate, and peak date, defined as the day with the maximum number of new cases.
We also explored geographic variation in the timing of pandemic onset across states and its association with the start of the fall school term, population size, population density, and distance from Mexico City. For each pandemic wave and Mexican state, the onset day was defined as the first day of the period of monotonously increasing cases leading up to the peak of A/H1N1 cases, as in [20].
Age Distribution of Influenza Cases and Deaths
We examined the age distribution of ILI and A/H1N1 pandemic influenza cases by geographic region and over time, using weekly rather than daily case time series in order to avoid low case counts at the beginning and end of each pandemic wave. We also estimated age-specific measures of disease severity including the case-fatality ratio (CFR = deaths/cases, where numerators and denominators can be based on ILI or laboratory-confirmed cases).
Estimation of Transmission Potential
We estimated the reproduction number, R, for each pandemic wave and geographic region of Mexico (north, central, and southeast). We used a simple method that relies on the estimation of the growth rate by fitting an exponential function to the early ascending phase of daily A/H1N1 pandemic cases, where the epidemic curve is based on symptoms onset (Text S1 and [20]–[23]). The early ascending phase was determined as the period between the day of pandemic onset (as defined above) and the midpoint between the onset and peak days, for each regional pandemic wave. We assumed a mean generation interval of 3 and 4 d, which are within the range of mean estimates for the 2009 A/H1N1 influenza pandemic [11],[13],[24],[25].
We assessed the sensitivity of our estimates to small variations in the definition of the ascending phase used to estimate the exponential growth rate (±4 d). Because variability in daily testing rates could affect R estimates derived from A/H1N1 time series, particularly during the early phase of the spring wave, we conducted a sensitivity analysis using ILI time series.
Impact of School Closures during the 2009 Spring Wave
School activities have been linked with increased influenza transmission rates in both pandemic and interpandemic periods [26]–[29]. We assessed the effectiveness of mandatory school closures and other social distancing measures implemented during April 24–May 11, 2009 in the central region of Mexico in reducing influenza transmission rates. We fitted a mathematical model of influenza transmission to daily case data (Text S1). This approach allows estimation of separate influenza transmission rates for the periods before and during intervention and explicitly accounts for the depletion of susceptible individuals.
In addition, to analyze changes in the age distribution of cases with school activity periods, we computed the daily ratio of incident A/H1N1 pandemic cases among the student population (5–20 y) to cases among other age groups.
Results
General Description of the Three Pandemic Waves in Mexico
A total of 117,626 ILI cases were reported by IMSS from April 1 to December 31, 2009, of which 36,044 were laboratory tested (30.6%) and 27,440 (23.3%) were confirmed with A/H1N1 pandemic influenza. A total of 1,370 ILI deaths (3.6 per 100,000) were reported to the surveillance system, of which 585 (1.5 per 100,000) were confirmed with A/H1N1 pandemic influenza. There was no significant trend in testing rates by geographic region or age group, and testing remained constant over time, except for a rapid increase during the first 2–3 wk of the pandemic (Text S1 and figures B–E therein).
The spatial-temporal distribution of A/H1N1 pandemic influenza and ILI cases reveal a three-wave pattern in the spring, summer, and fall of 2009 with substantial geographical clustering (Figures 1–3). The spring pandemic wave in April–May 2009 was mainly confined to the greater Mexico City area and other central states. The summer wave in June 2009 was limited to southern states, and ended soon after the start of the summer school vacation period on July 3, 2009. A third wave of widespread activity began in August 2009, coinciding with the return of students from summer vacations, and disease activity persisted until December 2009 throughout Mexico.


The average cumulative incidence rate of pandemic A/H1N1 was 16.6 per 100,000 across the 32 states (95% confidence interval [CI] 16.2–17.0) in spring-summer and 55.7 per 100,000 (95% CI 55.0–56.5) in the fall. Most states experienced highest disease rates in the fall, except for five southeastern states (Figure 3). Similar spatial and temporal patterns were observed in hospitalization and mortality time series (Text S1, figure F).
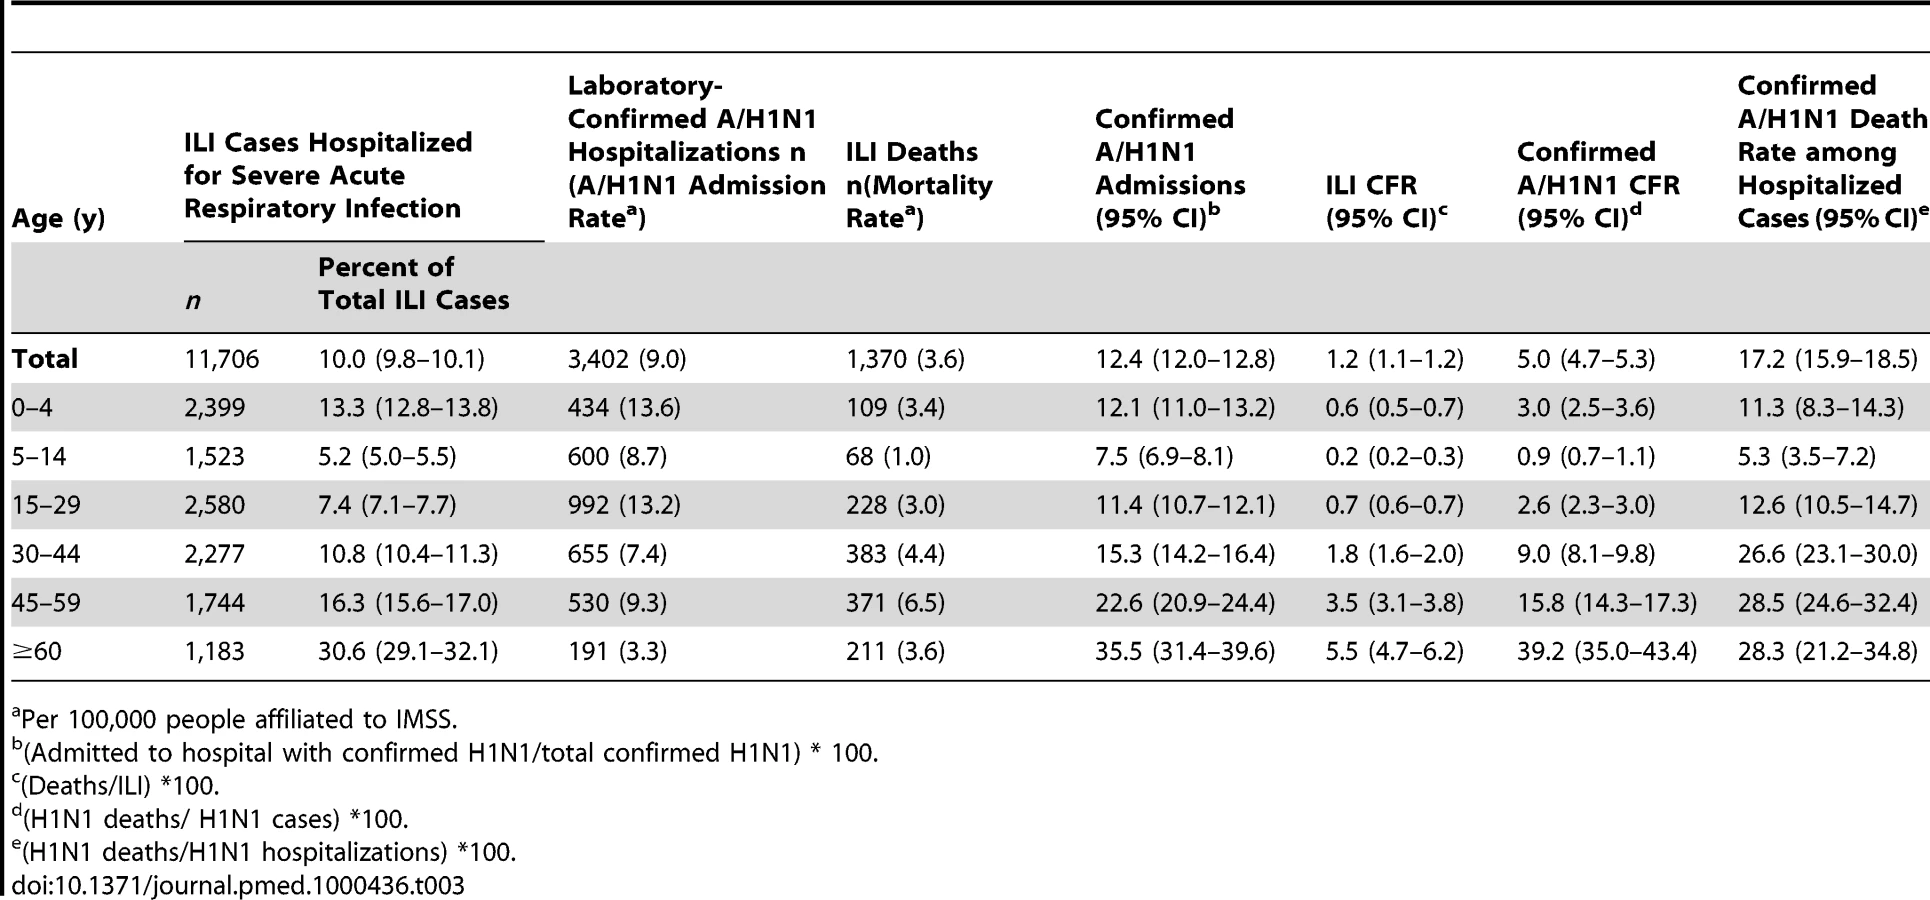
Age Patterns of Cases and Disease Severity
The median age of A/H1N1 cases was 18 y (range, 0–99 y). H1N1 morbidity rate was highest among children 5–14 y (115.7 per 100,000) and lowest among seniors 60 y and older (9.2 per 100,000, Table 2; Text S1, figure G). The age-specific risk of severe disease was J-shaped, with highest case-fatality and case-hospitalization rates in people older than 60 y, and relatively high rates in infants (Table 3). The overall CFR was estimated at 1.2% (95% CI 1.1–1.2) on the basis of ILI cases and deaths and 5% (95% CI 4.7–5.3) on the basis of laboratory-confirmed A/H1N1 cases and deaths. The ILI CFR varied geographically and was estimated at 0.5% (95% CI 0.4–0.5) in the southeastern region, 1.0% (95% CI 0.9–1.1) in the northern region, and 1.9% (95% CI 1.8–2.1) in the central region.

Cumulative rates of A/H1N1 followed a similar age profile across all regions, with peak morbidity rates in the age range of 0–14 y and a consistent drop in morbidity rates after age 30 (Table 2). There was a trend towards increasing age as the fall wave progressed (September 9–December 31; regression against time R2 = 0.94, p<0.0001), with the median age reaching ∼31 y in December 2009 (Text S1, figure H). There was a similar trend in ILI cases (R2 = 0.94, p<0.0001), laboratory-confirmed hospitalized cases (R2 = 0.62, p = 0.0002), and laboratory-confirmed deaths (R2 = 0.26, p = 0.04).
Demographic Factors and Variation in Timing and Magnitude of the Pandemic
Next we explored whether demographic factors may partly explain the observed variation in timing of onset and magnitude of the three pandemic pandemic waves across the 32 Mexican states. First, we tested the association between the incidences of successive waves, which could reflect the gradual build-up of immunity (and thus, negative association) or the impact of baseline sociodemographic factors (positive association). Cumulative incidence rates had a weak positive correlation between spring and fall (Spearman rho for A/H1N1 rates = 0.4, p = 0.046), but there was no significant correlation between the summer wave and the spring or fall waves (p>0.16).
The total morbidity burden of the pandemic, measured as the cumulative A/H1N1 incidence rate during April–December 2009, was negatively correlated with population size (Spearman rho = −0.58, p<0.001, Text S1 and figure I therein). We found a similar correlation with ILI rates and rates of IMSS-affiliated individuals tested for influenza (Spearman rho = −0.4, p = 0.02, and rho = −0.61, p<0.001, respectively) and the association remained after adjustment for population structure. These findings suggest that low population areas reported higher pandemic morbidity rates than large population centers and that the association was not an artifact of testing practices or population age structure. In contrast, we did not find any association between pandemic morbidity rates and population density. Further, rates of hospitalization and death were not correlated with population size or density (p>0.15).
Population size was also associated with the onset of the fall pandemic wave, with earlier onset occurring in more populous states (Spearman rho = −0.60, p = 0.003; Text S1, figure J); however, there was no association between onset and population density (rho = −0.032, p = 0.13), distance from Mexico City (rho = 0.02, p = 0.92), or the onset of earlier waves (Text S1).
Trends in Reproduction Number (R) and Impact of School Closure
We estimated the mean R for the spring, summer, and fall waves in three geographic regions based on confirmed H1N1 cases (Table 4; Text S1, figure K). Assuming a mean generation interval of 3 (and 4) d, the mean R was estimated to be 1.8 (2.1) for the spring wave in the central region prior to the national school closure period, 1.6 (1.9) for the summer wave in the southeast region, and 1.2 (1.3) for the fall wave in both central and northern regions. R estimates obtained from ILI cases were 13%–17% lower than those obtained from confirmed cases for the spring and summer waves, while there was no difference for the fall wave. There was little variation in R estimates when we increased or shortened the growth rate period by 4 d (difference of 0.1–0.2 for the spring and summer waves and 0.1 or less for the fall wave). An upper bound for R is provided in Text S1, table B, with the extreme case of a fixed generation interval, and suggests that R remained below 2.5 throughout the pandemic in Mexico.

We identified significant changes in the R during the spring wave according to school activity periods (Figure 4A and 4B). Focusing on central states affected by a substantial spring wave, we estimate that R increased from 1.3 (95% CI 1.2–1.5) to 2.2 (95% CI 1.4, 3.1) after the end of the spring break vacation period. A decrease in R from 2.2 (95% CI 1.4–3.1) to 1.0 (95% CI 0.94–1.06) coincided with the suspension of educational activities and the implementation of other social distancing measures enforced between April 24 and May 11, 2009. To explicitly account for the effects of depletion of susceptible individuals, we fitted a transmission model to daily influenza H1N1 case data and quantified the relative change in mean transmission rate during the intervention period. We estimated that the transmission rate was reduced by 29.6% (95% CI 28.9%–30.2%) during the intervention period (Figure 5). Our model gave a good fit to the spring epidemic curve overall, although it yielded a slightly higher number of cases than observed until the last week of April (chi-square test, bins = 41, df = 37, p = 0.22, Figure 5). As a sensitivity analysis, we also fitted the model to ILI cases and found a reduction of 36.2% (95% CI 35.9%–36.5%) associated with social distancing measures.


To further test the impact of school cycles, we monitored trends in the ratio of incident student to nonstudent influenza A/H1N1 cases. At the national scale, this ratio was low during the summer vacations and increased sharply following the start of school activities in August (Wilcoxon test, p<0.001, Figure 6). At the state level, the ratio of student to nonstudent cases peaked 2–5 wk after schools reopened in the fall of 2009 (Text S1, figures L–M).

Discussion
This is, to our knowledge, the first study to explore spatio-temporal variation in the dynamics and age patterns of the 2009 A/H1N1 pandemic in Mexico, relying on a large sample of laboratory-confirmed and ILI data collected by a private medical system representing a population of over 100 million people. Our findings support the effectiveness of early mitigation efforts in the greater Mexico City area in the spring of 2009, including mandatory school closures and cancellation of large public gatherings. In addition, the onset of the fall pandemic wave in Mexico coincided with the start of the fall term in schools and universities, reinforcing the importance of school cycles in the transmission of pandemic influenza. Our data also reveal substantial geographical variation in pandemic patterns across Mexico, in part related to population size, with three consecutive waves of varying amplitude occurring over an 8-mo period. In line with previous studies [30]–[32], we note that the age distribution of pandemic influenza morbidity was highly skewed towards younger age groups (median 18 y), while the risk of severe disease was skewed towards older age groups. Of note was the particularly high CFR reported in these Mexican data (CFR≈1% based on the ratio of ILI deaths to ILI cases).
Our transmission model fitted to daily case data suggests that the 18-d period of mandatory school closure and cancellation of public gathering in the greater Mexico area was associated with a 29%–37% reduction in the transmission of pandemic influenza. Overall, our estimates are in agreement with a recent study suggesting an ∼25% reduction in A/H1N1 transmission following secondary schools closures in Hong Kong from June 11 to July 10, 2009 [33]. Similarly, a European study of variation in contact rate patterns suggested a 13%–40% reduction in reproduction number with holiday periods in Belgium, Great Britain, and The Netherlands [34]. In our data, the resurgence of influenza activity within 2–5 wk of the beginning of fall term in the 32 Mexican states, together with a rapid change in the age distribution of cases around this time, further suggests the importance of school cycles for pandemic influenza transmission. Accordingly, previous studies have shown a temporal association between school cycles and the onsets of the fall 1957 and 2009 pandemic waves in the US [28],[35],[36].
While past studies have concentrated on R estimates for the spring wave in Mexico and other countries, this is the first study, to our knowledge, to provide estimates for all three pandemic waves in any country. Our estimates were highest for the spring wave (R≈1.8–2.1), declined in the summer (R≈1.6–1.9), and were lowest in the fall (R≈1.2–1.3). The significantly lower fall estimates may be explained by higher levels of herd immunity and preventive measures put in place in preparation for the start of school term. These included cleaning and disinfection of schools, promotion of hand hygiene, and screening and management of incident ILI cases among students and school staff.
Our R estimates were robust to small variation in the definition of the epidemic ascending phase and the use of confirmed H1N1 or ILI cases, which rules out potential biases due to testing practices. Overall our spring R estimates are in line with previous studies focusing on the early pandemic phase in Mexico, with estimates ranging between 1.4–2.4 [11],[37],[38]. In other countries, R was estimated at 1.2–2.4 for community-based settings in Japan [39], New Zealand [40], Australia [41], Peru [42], Chile [43], Ontario, Canada [44], and the US [45], while higher estimates in the range 2.3–3.3 were obtained during school outbreaks [13],[14],[46]. The variability in published R estimates of the first wave of the 2009 pandemic could be attributed to differences in control strategies, school activity periods, travel patterns, and climatic conditions [8],[9], which should be more fully investigated.
The number and intensity of the 2009 H1N1 pandemic waves varied substantially across regions of the world. While Mexico, the US, and the UK experienced a “herald” pandemic wave in the spring of 2009 followed by one or more waves during the summer and fall 2009 [10],[12],[47], a number of countries, particularly in the Southern Hemisphere, have experienced only a single pandemic wave in 2009, including Chile [48], Argentina [49], Australia [50],[51], and New Zealand [50]. Other countries in Europe also experienced a single main wave in the fall of 2009 [16], followed by a recrudescence of H1N1 activity more than one year later in winter 2010–2011. Our detailed analysis of 2009 pandemic patterns in Mexican states suggests that all of these configurations were observed within Mexico. Similarly, past influenza pandemics have exhibited multiple waves over short periods of time, as reported for the 1918 pandemic in Mexico [22] and elsewhere [52]–[54].
For reasons that remain unclear, there are substantial spatial variations in the seasonality of influenza epidemics across Mexican regions in interpandemic years, which may have played a role in the geographical asynchrony of the 2009 A/H1N1 pandemic. Interpandemic influenza activity has strong winter seasonality in northern and central Mexico [1], while influenza has been detected between December and July in the tropical southeast [55]. It is perhaps not surprising that the Southeast region experienced a large-scale A/H1N1 pandemic wave in summer 2009 and a relatively minor wave in the fall. While absolute humidity has been found to be associated with the onset of interpandemic and pandemic influenza activity in the US [9],[56], we did not identify a correlation with the three-wave pandemic profile in Mexico (Text S1) [56]. Further analysis of the environmental or social factors influencing the transmission of interpandemic and pandemic influenza is warranted in order to fully explain influenza seasonality patterns [57].
We found that spatial variation in the timing and magnitude of the three A/H1N1 pandemic waves across Mexican states was partly linked to population size. Influenza spread in Mexico was driven by large population centers, reminiscent of seasonal influenza in the US [58] and the 1918 pandemic in England and Wales [20],[59]. We found significant spatial heterogeneity in the distribution of incidence rates across states, with lowest incidence rates observed in large population centers. A similar protective effect of large population centers was evidenced in the context of the 1918 pandemic in England and Wales [20]. These results could be explained by local differences in health care seeking behavior or in the effectiveness of social distancing measures [60].
Our large dataset allowed estimation of pandemic disease severity for relatively fine age groups, which could help identify priority age groups for vaccination and treatment in future pandemics. Although it may not be possible to extrapolate findings from this pandemic to the next influenza pandemic, the last four pandemics have been characterized by significant excess mortality among young adults as well as significant sparing of older populations [52]. Our case-based severity estimates derived from hospitalization and death reports were highest among people older than 60 y, and they were substantially higher than in other countries [32],[61]–[64]. In particular, our CFR based on ILI visits was estimated at 3% during the spring wave, 0.5% during the summer wave, and 1.2% during the fall wave, while our ILI-based hospitalization rate was around 10%. This is one to two orders of magnitude higher than estimates reported in several studies [61],[62],[64] and similar to estimates based on hospitalization cases series in the spring of 2009 in California and Argentina [63],[65]. Our high case-based severity estimates likely reflect a bias of the Mexican IMSS influenza surveillance system towards the higher levels of the severity pyramid [62]. As a sensitivity analysis, and for comparison with previous studies, we estimated CFR using 2009 A/H1N1 serological attack rates as denominator. Because of the lack of serological estimates from Mexico, we used age-specific serological data from the UK reported for the two waves of the pandemic there (May 2009 to April 2010) [66]. Using UK data as denominator suggests that the age-adjusted CFR could be in the order of ∼0.01% in Mexico with a pattern of increasing severity with age. This estimate is two orders of magnitude lower than our CFR based on ILI cases and is in close agreement with estimates from other countries [61],[62],[64]. Further studies comparing excess mortality rates derived from vital statistics for different countries and influenza seasons may shed more light on the relative severity of this pandemic.
Several caveats are worth noting in our analysis of the 2009 pandemic in Mexico. We used data on ILI and laboratory-confirmed influenza cases reported to the Mexican Institute for Social Security network in 32 states, and there may be sampling variation between states. However, about one-third of all ILI cases were consistently tested for influenza in all regions and throughout the main pandemic period (except for the early spring), and we did not see any evidence of weaker disease surveillance in smaller states (Text S1). On the contrary, states with lower population sizes reported more cases proportionally than larger states. The reduction in R observed during the social distancing period occurred during a period of increasing testing rates (Figure 4C). One would expect that increasing testing rates would lead to overestimation of the growth rate in H1N1 cases and may in turn result in overestimation of the impact of social distancing. Nevertheless, our sensitivity analyses based on ILI data gave similar results, and we do not think likely that spatial or temporal differences in ILI rates and health-seeking behavior may bias these analyses. We cannot rule out, however, the impact of other factors on R estimates, including a reduction in the delay from symptom onset to hospital admission in the spring, potentially reducing the effective infectious period (Figure 4D) [17], and the use of 1.2 million doses of oseltamivir for influenza treatment around the time of school closure.
In conclusion, our work suggests that intervention measures initiated in Mexico early in the pandemic period in April–May 2009 were effective in temporarily reducing disease transmission and that the start of the fall school term in August 2009 may have facilitated the onset of a widespread pandemic wave. It will be interesting to formally compare the Mexican experience with that of other locations that applied similar measures, such as Hong Kong [33]. The heterogeneous Mexican experience also suggests that it will be relatively difficult to predict the local impact and transmission dynamics of future influenza pandemics globally. We suggest that population size and school cycles can account for some of the observed variability and should be integrated into future pandemic planning scenarios. Finally, it is important to keep in mind that several post-1918 pandemic waves were associated with substantial health impact in the Americas [22],[67] and that the majority of influenza deaths associated with the 1889 pandemic in London occurred 2 y after the initial wave [68]. Therefore, we must remain vigilant and continue to monitor the circulation and health burden of the A/H1N1 pandemic virus in the coming years [69].
Supporting Information
Zdroje
1. Chowell
G
Bertozzi
SM
Colchero
MA
Lopez-Gatell
H
Alpuche-Aranda
C
2009
Severe respiratory disease concurrent with the circulation of
H1N1 influenza.
N Engl J Med
361
674
679
2. Perez-Padilla
R
de la Rosa-Zamboni
D
Ponce de Leon
S
Hernandez
M
Quinones-Falconi
F
2009
Pneumonia and respiratory failure from swine-origin influenza A
(H1N1) in Mexico.
N Engl J Med
361
680
689
3. Gomez-Gomez
A
Magana-Aquino
M
Garcia-Sepulveda
C
Ochoa-Perez
UR
Falcon-Escobedo
R
2010
Severe pneumonia associated with pandemic (H1N1) 2009 outbreak,
San Luis Potosi, Mexico.
Emerg Infect Dis
16
27
34
4. 2009
Swine influenza A (H1N1) infection in two children--Southern
California, March-April 2009.
MMWR Morb Mortal Wkly Rep
58
400
402
5. 2009
Outbreak of swine-origin influenza A (H1N1) virus infection -
Mexico, March-April 2009.
MMWR Morb Mortal Wkly Rep
58
467
470
6. Cordova-Villalobos
JA
Sarti
E
Arzoz-Padres
J
Manuell-Lee
G
Mendez
JR
2009
The influenza A(H1N1) epidemic in Mexico. Lessons
learned.
Health Res Policy Syst
7
21
7. Bootsma
MC
Ferguson
NM
2007
The effect of public health measures on the 1918 influenza
pandemic in U.S. cities.
Proc Natl Acad Sci U S A
104
7588
7593
8. Shaman
J
Kohn
M
2009
Absolute humidity modulates influenza survival, transmission, and
seasonality.
Proc Natl Acad Sci U S A
106
3243
3248
9. Shaman
J
Pitzer
VE
Viboud
C
Grenfell
BT
Lipsitch
M
2010
Absolute humidity and the seasonal onset of influenza in the
continental United States.
PLoS Biol
8
e1000316
doi:10.1371/journal.pbio.1000316
10. 2010
H1N1 Flu.
Atlanta (Georgia)
Centers for Disease Control and Prevention
11. Fraser
C
Donnelly
CA
Cauchemez
S
Hanage
WP
Van Kerkhove
MD
2009
Pandemic potential of a strain of influenza A (H1N1): early
findings.
Science
324
1557
1561
12. Ghani
AC
Baguelin
M
Griffin
J
Flasche
S
Pebody
R
2009
The early transmission dynamics of H1N1pdm influenza in the
United Kingdom.
PLoS Curr Influenza
doi:10.1371/currents.RRN1130
RRN1130
13. Yang
Y
Sugimoto
JD
Halloran
ME
Basta
NE
Chao
DL
2009
The transmissibility and control of pandemic influenza A (H1N1)
virus.
Science
326
729
733
14. Nishiura
H
Castillo-Chavez
C
Safan
M
Chowell
G
2009
Transmission potential of the new influenza A(H1N1) virus and its
age-specificity in Japan.
Euro Surveill
14
15. Laguna-Torres
VA
Gomez
J
Aguilar
PV
Ampuero
JS
Munayco
C
2010
Changes in the viral distribution pattern after the appearance of
the novel influenza A H1N1 (pH1N1) virus in influenza-like illness patients
in Peru.
PLoS One
5
e11719
doi:10.1371/journal.pone.0011719
16. Valdivia
A
Lopez-Alcalde
J
Vicente
M
Pichiule
M
Ruiz
M
2010
Monitoring influenza activity in Europe with Google Flu Trends:
comparison with the findings of sentinel physician networks - results for
2009-10.
Euro Surveill
15
17. Echevarria-Zuno
S
Mejia-Arangure
JM
Mar-Obeso
AJ
Grajales-Muniz
C
Robles-Perez
E
2009
Infection and death from influenza A H1N1 virus in Mexico: a
retrospective analysis.
Lancet
374
2072
2079
18. CONAPO
2010
Mexico City: Consejo Nacional de Poblacion, Mexico
19. 2009
Centers for Disease Control and Prevention. Serum cross-reactive
antibody response to a novel influenza A (H1N1) virus after vaccination with
seasonal influenza vaccine.
MMWR Morb Mortal Wkly Rep
58
521
524
20. Chowell
G
Bettencourt
LM
Johnson
N
Alonso
WJ
Viboud
C
2008
The 1918-1919 influenza pandemic in England and Wales: spatial
patterns in transmissibility and mortality impact.
Proc Biol Sci
275
501
509
21. Wallinga
J
Lipsitch
M
2007
How generation intervals shape the relationship between growth
rates and reproductive numbers.
Proc Biol Sci
274
599
604
22. Chowell
G
Viboud
C
Simonsen
L
Miller
MA
Acuna-Soto
R
2010
Mortality patterns associated with the 1918 influenza pandemic in
Mexico: evidence for a spring herald wave and lack of preexisting immunity
in older populations.
J Infect Dis
202
567
575
23. Chowell
G
Nishiura
H
Bettencourt
LM
2007
Comparative estimation of the reproduction number for pandemic
influenza from daily case notification data.
J R Soc Interface
4
155
166
24. Cauchemez
S
Donnelly
CA
Reed
C
Ghani
AC
Fraser
C
2009
Household transmission of 2009 pandemic influenza A (H1N1) virus
in the United States.
N Engl J Med
361
2619
2627
25. Cowling
BJ
Chan
KH
Fang
VJ
Lau
LL
So
HC
2010
Comparative epidemiology of pandemic and seasonal influenza A in
households.
N Engl J Med
362
2175
2184
26. Monto
AS
Koopman
JS
Longini
IM
Jr
1985
Tecumseh study of illness. XIII. Influenza infection and disease,
1976-1981.
Am J Epidemiol
121
811
822
27. Cauchemez
S
Ferguson
NM
Wachtel
C
Tegnell
A
Saour
G
2009
Closure of schools during an influenza pandemic.
Lancet Infect Dis
9
473
481
28. Chao
DL
Elizabeth Halloran
M
Longini
IM
Jr
2010
School opening dates predict pandemic influenza A(H1N1) outbreaks
in the United States.
J Infect Dis
202
877
880
29. Cauchemez
S
Valleron
AJ
Boelle
PY
Flahault
A
Ferguson
NM
2008
Estimating the impact of school closure on influenza transmission
from Sentinel data.
Nature
452
750
754
30. Gomez
J
Munayco
C
Arrasco
J
Suarez
L
Laguna-Torres
V
2009
Pandemic influenza in a southern hemisphere setting: the
experience in Peru from May to September, 2009.
Euro Surveill
14
31. Nishiura
H
2010
Case fatality ratio of pandemic influenza.
Lancet Infect Dis
10
443
444
32. Baker
MG
Wilson
N
Huang
QS
Paine
S
Lopez
L
2009
Pandemic influenza A(H1N1)v in New Zealand: the experience from
April to August 2009.
Euro Surveill
14
33. Wu
JT
Cowling
BJ
Lau
EH
Ip
DK
Ho
LM
2010
School closure and mitigation of pandemic (H1N1) 2009, Hong
Kong.
Emerg Infect Dis
16
538
541
34. Hens
N
Ayele
GM
Goeyvaerts
N
Aerts
M
Mossong
J
2009
Estimating the impact of school closure on social mixing
behaviour and the transmission of close contact infections in eight European
countries.
BMC Infect Dis
9
187
35. Langmuir
AD
Pizzi
M
Trotter
WY
Dunn
FL
1958
[Asian influenza surveillance.].
Public Health Rep
73
114
120
36. Dunn
FL
Carey
DE
Cohen
A
Martin
JD
1959
Epidemiologic studies of Asian influenza in a Louisiana
parish.
Am J Hyg
70
351
371
37. Pourbohloul
B
Ahued
A
Davoudi
B
Meza
R
Meyers
LA
2009
Initial human transmission dynamics of the pandemic (H1N1) 2009
virus in North America.
Influenza Other Respi Viruses
3
215
222
38. Boelle
PY
Bernillon
P
Desenclos
JC
2009
A preliminary estimation of the reproduction ratio for new
influenza A(H1N1) from the outbreak in Mexico, March-April
2009.
Euro Surveill
14
39. Nishiura
H
Chowell
G
Safan
M
Castillo-Chavez
C
2010
Pros and cons of estimating the reproduction number from early
epidemic growth rate of influenza A (H1N1) 2009.
Theor Biol Med Model
7
1
40. Paine
S
Mercer
GN
Kelly
PM
Bandaranayake
D
Baker
MG
2010
Transmissibility of 2009 pandemic influenza A(H1N1) in New
Zealand: effective reproduction number and influence of age, ethnicity and
importations.
Euro Surveill
15
41. McBryde
E
Bergeri
I
van Gemert
C
Rotty
J
Headley
E
2009
Early transmission characteristics of influenza A(H1N1)v in
Australia: Victorian state, 16 May - 3 June 2009.
Euro Surveill
14
42. Munayco
CV
Gomez
J
Laguna-Torres
VA
Arrasco
J
Kochel
TJ
2009
Epidemiological and transmissibility analysis of influenza
A(H1N1)v in a southern hemisphere setting: Peru.
Euro Surveill
14
43. Pedroni
E
Garcia
M
Espinola
V
Guerrero
A
Gonzalez
C
2010
Outbreak of 2009 pandemic influenza A(H1N1), Los Lagos, Chile,
April-June 2009.
Euro Surveill
15
44. Tuite
AR
Greer
AL
Whelan
M
Winter
AL
Lee
B
2010
Estimated epidemiologic parameters and morbidity associated with
pandemic H1N1 influenza.
CMAJ
182
131
136
45. White
LF
Wallinga
J
Finelli
L
Reed
C
Riley
S
2009
Estimation of the reproductive number and the serial interval in
early phase of the 2009 influenza A/H1N1 pandemic in the
USA.
Influenza Other Respi Viruses
3
267
276
46. Lessler
J
Reich
NG
Cummings
DA
Nair
HP
Jordan
HT
2009
Outbreak of 2009 pandemic influenza A (H1N1) at a New York City
school.
N Engl J Med
361
2628
2636
47. 2009
Current situation of the 2009 H1N1pdm influenza pandemic in
Mexico [in Spanish].
Mexico City
Secretaria de Salud
48. 2010
Situacion de influenza A(H1N1) - reporte
01/26/2010.
Santiago (Chile)
Ministerio de Salud de Chile
49. 2010
Situacion de influenza A(H1N1) - parte 87.
Buenos Aires
Ministerio de Salud de Argentina
50. Webb
SA
Pettilä
A
Seppelt
I
Bellomo
R
2009
Critical care services and 2009 H1N1 influenza in Australia and
New Zealand.
N Engl J Med
361
1925
34
51. Bishop
JF
Murnane
MP
Owen
R
2009
Australia's winter with the 2009 pandemic influenza A (H1N1)
virus.
N Engl J Med
361
2591
2594
52. Miller
MA
Viboud
C
Balinska
M
Simonsen
L
2009
The signature features of influenza pandemics--implications for
policy.
N Engl J Med
360
2595
2598
53. Chowell
G
Ammon
CE
Hengartner
NW
Hyman
JM
2006
Estimation of the reproductive number of the Spanish flu epidemic
in Geneva, Switzerland.
Vaccine
24
6747
6750
54. Andreasen
V
Viboud
C
Simonsen
L
2008
Epidemiologic characterization of the 1918 influenza pandemic
summer wave in Copenhagen: implications for pandemic control
strategies.
J Infect Dis
197
270
278
55. Ayora-Talavera
G
Gongora-Biachi
RA
Lopez-Martinez
I
Moguel-Rodriguez
W
Perez-Carrillo
H
2002
Detection of human influenza virus in Yucatan,
Mexico.
Rev Invest Clin
54
410
414
56. Shaman
J
Goldstein
E
Lipsitch
M
2011
Absolute humidity and pandemic versus epidemic
influenza.
Am J Epidemiol
173
127
135
57. Lipsitch
M
Viboud
C
2009
Influenza seasonality: lifting the fog.
Proc Natl Acad Sci U S A
106
3645
3646
58. Viboud
C
Bjornstad
ON
Smith
DL
Simonsen
L
Miller
MA
2006
Synchrony, waves, and spatial hierarchies in the spread of
influenza.
Science
312
447
451
59. Eggo RM, Cauchemez S, Ferguson NM Spatial dynamics of the 1918
influenza pandemic in England, Wales and the United States.
J R Soc Interface
8
233
243
60. Nishiura
H
Chowell
G
2008
Rurality and pandemic influenza: geographic heterogeneity in the
risks of infection and death in Kanagawa, Japan (1918-1919).
N Z Med J
121
18
27
61. Reed
C
Angulo
FJ
Swerdlow
DL
Lipsitch
M
Meltzer
MI
2009
Estimates of the prevalence of pandemic (H1N1) 2009, United
States, April-July 2009.
Emerg Infect Dis
15
2004
2007
62. Presanis
AM
De Angelis
D
Hagy
A
Reed
C
Riley
S
2009
The severity of pandemic H1N1 influenza in the United States,
from April to July 2009: a Bayesian analysis.
PLoS Med
6
e1000207
doi:10.1371/journal.pmed.1000207
63. Libster
R
Bugna
J
Coviello
S
Hijano
DR
Dunaiewsky
M
2010
Pediatric hospitalizations associated with 2009 pandemic
influenza A (H1N1) in Argentina.
N Engl J Med
362
45
55
64. Wu
JT
Ma
ES
Lee
CK
Chu
DK
Ho
PL
2010
The infection attack rate and severity of 2009 pandemic H1N1
influenza in Hong Kong.
Clin Infect Dis
51
1184
1191
65. Louie
JK
Acosta
M
Winter
K
Jean
C
Gavali
S
2009
Factors associated with death or hospitalization due to pandemic
2009 influenza A(H1N1) infection in California.
JAMA
302
1896
1902
66. Hardelid
P
Andrews
N
Hoschler
K
Stanford
E
Baguelin
M
2010
Assessment of baseline age-specific antibody prevalence and
incidence of infection to novel influenza AH1N1 2009.
Health Technol Assess
14
115
192
67. Olson
DR
Simonsen
L
Edelson
PJ
Morse
SS
2005
Epidemiological evidence of an early wave of the 1918 influenza
pandemic in New York City.
Proc Natl Acad Sci U S A
102
11059
11063
68. Valleron
AJ
Cori
A
Valtat
S
Meurisse
S
Carrat
F
2010
Transmissibility and geographic spread of the 1889 influenza
pandemic.
Proc Natl Acad Sci U S A
107
8778
8781
69. World Health Organization (WHO)
2010
Aug
10
H1N1 in post-pandemic period.
Available: http://www.who.int/mediacentre/news/statements/2010/h1n1_vpc_20100810/en/index.html.
Štítky
Interní lékařstvíČlánek vyšel v časopise
PLOS Medicine
2011 Číslo 5
- Ivabradin zlepšuje kvalitu života starších pacientů se srdečním selháním
- Fixní kombinace kandesartan/amlodipin v terapii arteriální hypertenze
- Inovace v hojení ran: krytí Zetuvit Plus Silicone Border pro optimální management exsudátu z ran
- Prognostický význam hladiny natriuretických peptidů při léčbě empagliflozinem
- Hypertrofická obstrukční kardiomyopatie ve světle moderní farmakoterapie – kazuistika
Nejčtenější v tomto čísle
- Low-Dose Adrenaline, Promethazine, and Hydrocortisone in the Prevention of Acute Adverse Reactions to Antivenom following Snakebite: A Randomised, Double-Blind, Placebo-Controlled Trial
- Effectiveness of Early Antiretroviral Therapy Initiation to Improve Survival among HIV-Infected Adults with Tuberculosis: A Retrospective Cohort Study
- Medical Students' Exposure to and Attitudes about the Pharmaceutical Industry: A Systematic Review
- Estimates of Outcomes Up to Ten Years after Stroke: Analysis from the Prospective South London Stroke Register
Zvyšte si kvalifikaci online z pohodlí domova
Mazová zátka a její řešení
nový kurzVšechny kurzy