
Dynamic Imaging of the Effector Immune Response to Infection
Host defense against the intracellular pathogen Listeria monocytogenes (Lm) requires innate and adaptive immunity. Here, we directly imaged immune cell dynamics at Lm foci established by dendritic cells in the subcapsular red pulp (scDC) using intravital microscopy. Blood borne Lm rapidly associated with scDC. Myelomonocytic cells (MMC) swarmed around non-motile scDC forming foci from which blood flow was excluded. The depletion of scDC after foci were established resulted in a 10-fold reduction in viable Lm, while graded depletion of MMC resulted in 30–1000 fold increase in viable Lm in foci with enhanced blood flow. Effector CD8+ T cells at sites of infection displayed a two-tiered reduction in motility with antigen independent and antigen dependent components, including stable interactions with infected and non-infected scDC. Thus, swarming MMC contribute to control of Lm prior to development of T cell immunity by direct killing and sequestration from blood flow, while scDC appear to promote Lm survival while preferentially interacting with CD8+ T cells in effector sites.
Published in the journal:
. PLoS Pathog 7(3): e32767. doi:10.1371/journal.ppat.1001326
Category:
Research Article
doi:
https://doi.org/10.1371/journal.ppat.1001326
Summary
Host defense against the intracellular pathogen Listeria monocytogenes (Lm) requires innate and adaptive immunity. Here, we directly imaged immune cell dynamics at Lm foci established by dendritic cells in the subcapsular red pulp (scDC) using intravital microscopy. Blood borne Lm rapidly associated with scDC. Myelomonocytic cells (MMC) swarmed around non-motile scDC forming foci from which blood flow was excluded. The depletion of scDC after foci were established resulted in a 10-fold reduction in viable Lm, while graded depletion of MMC resulted in 30–1000 fold increase in viable Lm in foci with enhanced blood flow. Effector CD8+ T cells at sites of infection displayed a two-tiered reduction in motility with antigen independent and antigen dependent components, including stable interactions with infected and non-infected scDC. Thus, swarming MMC contribute to control of Lm prior to development of T cell immunity by direct killing and sequestration from blood flow, while scDC appear to promote Lm survival while preferentially interacting with CD8+ T cells in effector sites.
Introduction
Appropriate host immune response to pathogenic invasion is critical for survival. Secondary lymphoid tissues provide a structural context for multiple layers of the innate and adaptive immune response to infection. The spleen is a physiologically relevant tissue for immune responses to blood borne pathogens. The immune response to systemic Listeria monocytogenes (Lm) infection has been studied extensively in mice and is focused in the spleen and liver [1]. In this model, the innate immune system is responsible for detecting and containing infection while adaptive immunity is required for clearance of Lm and enhanced protection against future infections (memory) [2]. Lm is a gram positive intracellular bacterium and can cause severe infection in immune compromised individuals [3]. Lm expresses several virulence factors that enable invasion of the cytoplasm and movement from cell to cell through a contact dependent mechanism and thus grows in foci established by infection of one cell [4].
The spleen acts as a blood filter with a network of phagocytic cells in the marginal zone (MZ) and red pulp (RP) that are in direct contact with 5% of the the cardiac output. CD11c+ dendritic cells (DC) in the MZ and RP of the spleen sequester Lm from the blood and are required to initiate infection in the spleen [5], [6], [7]. At the site of infection DC orchestrate both recruitment and activation of innate effectors by secretion of inflammatory cytokines [8]. Aggregations of immune cells including myelomomonocytic cells (MMC) consisting of neutrophils and inflammatory monocyte subsets at foci of Lm growth are required to restrict bacterial growth and contain infected cells [9], [10], [11]. The process through which MMC converge on foci in the spleen is not understood. For example, expression of chemokine receptor CCR2 is required for monocyte egress from the bone marrow, but is dispensable for homing to infection sites once in the blood [12].
Although the innate immune system can restrict Lm infection, cells of the adaptive system, particularly CD8+ T cells, are required for sterilizing immunity [13]. DC bearing Lm antigens migrate from the MZ to the white pulp (WP) in a pertussis toxin sensitive process where they present antigen to T cells, which is required to prime adaptive immune responses [14], [15], [16]. DC that prime CD8+ T cells may be directly infected or acquire Lm antigens from infected apoptotic cells such as neutrophils [17], [18], [19]. After activation, CD8+ T cells proliferate extensively and exit the WP for bacterial clearance in the RP and to gain access to other sites of infection through the blood [20]. The mechanism of clearance is not completely understood, but requires perforin, IFNγ, TNFα and CCL3 [21], [22]. Direct visualization of this process may provide insight as in vivo cytotoxicity has been associated with stable and prolonged interactions of antigen specific cytotoxic T lymphocytes (CTL) and target cells [23], [24]. Tissue DC also play a role in the effector phase of T cell responses providing local signals for cytokine production [25], [26], [27], [28]. However, the role of tissue DC in clearance of Lm and nature of T-DC interactions in RP foci is unknown.
Live imaging of lymphoid structures by intravital microscopy has provided high-resolution information on the dynamic interactions that take place during immune responses in situ. Tracking of cells in real time reveals kinetic information that is lacking from static images. Intravital microscopy has been useful in understanding tissue specific responses to pathogens [29]. These studies have revealed active environmental sampling by resident DC networks that act as sentinals in peripheral organs such as skin and intestines during infection by Salmonella in the gut and protozoan parasites in the skin [30], [31], [32], [33]. In addition, patrolling neutrophils and monocytes rapidly respond to invading Leishmania major or tissue injury [34], [35], [36]. The dynamics of these cells at inflammatory lesions in zebrafish models of tuberculosis have yielded unexpected role of macrophages in dissemination of infection [37]. In mouse models of Leishmania donovani and Bacillus Calmette-Guérin (BCG) infection, T cells are rapidly recruited to liver granulomas by inflammatory signals and antigen specific cells are retained [38], [39]. Interactions of effector T cells with parasites and resident antigen presenting cells (APC) revealed zones of antigen specific contacts with pathogen associated APC, while some infected cells were not contacted by T cells in the brain and in the skin [40], [41], [42]. The mode of interaction of Lm specific effector T cells in infectious foci is unknown and cannot be predicted based on existing data.
Multiphoton intravital imaging in the spleen is hindered by light absorption and scattering by red blood cells and auto-fluorescent metabolites concentrated in the RP. This interference is avoided by directly imaging WP of spleen fragments ex vivo [43], [44]. However with these preparations physiological circulation and recruitment of cells from hematopoietic tissues such as the bone marrow are lost. We have found that intravital imaging in the RP with confocal microscopy yields high-resolution images suitable for analyzing cellular dynamics. We have previously reported the presence of an extensive DC network in the subcapsular RP (scDC) that can be directly visualized by intravital microscopy of the spleen [45]. Early after infection, macrophages and DC capture the bulk of Lm in the MZ and then migrate to the WP to present Lm antigens to activate T cells [5], [6], [16], [46]. However, a minority of Lm does access the RP and establish foci of bacterial growth there. In addition, T cells exit the WP after activation to clear infected cells in the RP [20]. The role of the scDC network and immune cell dynamics in the response to Lm infection in the RP is unknown. Here we set out to observe the early events in the innate immune response and later clearance of Lm infection by adaptive T cells using in vivo imaging of the RP. We show that scDC interacted with Lm within 2 minutes after introduction into the blood stream, but at 48–72 hours post infection (p.i.) did not directly contribute to the innate control of bacterial growth once Lm foci are established. At 48 hours p.i., MMC converged on foci by directed migration and restricted blood flow around infected cells. On day 5 p.i., the peak of Lm growth, CD8+ T cells are recruited to these foci and displayed a two-tiered deceleration with antigen independent and antigen dependent components.
Results
Systemic Lm is rapidly associated with subcapsular DC in the spleen red pulp
To test if scDC take up Lm, we used intravital microscopy in the spleen subcapsular RP to image the arrival of fluorescently labeled Lm in circulation of CD11c-EYFP mice [47]. Frozen spleen sections from CD11c-EYFP mice show that YFP+ cells are present in the RP and these cells are heterogeneous for surface staining of CD11c, MHC class II, F4/80 and CD11b (Figure S1 in Text S1). In the subcapsular RP, YFP+ cells stained strongly for F4/80, a marker for RP macrophages but also expressed by a subset of DC isolated from spleen and DC subsets found in peripheral organs such as skin [25], [48]. Most of these subcapsular YFP+ cells also displayed dendritic morphology and time-lapse images of these cells show they are largely non-motile but are actively extending and retracting their dendrites (Figure 1A, Video S1). This activity is similar to other reports of environmental sampling by DC networks in the lymph node [47]. Thus, it seems that a majority of these YFP+ cells in the subcapsular RP represent a subset of peripheral tissue DC.

During image acquisition, 107 Bodipy-630 labeled Lm were injected into the retro-orbital plexus (Video S1). In some experiments, Lm were injected together with a 10 kDa rhodamine dextran, to mark the time of injection. Lm arrived in the RP within 30 seconds of the rhodamine dextran arrival which was about 60 seconds post injection (data not shown). Of the Lm that came through the imaging field, 70+7.7% (n = 6 mice, 135 bacteria,) were associated with non-motile scDC 10 minutes after injection (Figure 1B.). Lm-associated scDC remained non-motile for the duration of image acquisition (up to 20 minutes) and continued to actively probe the environment (Video S1). High-resolution z-stack images show that Lm are primarily located within or at the periphery of scDC (Figure 1C). Lm were also co-localized with scDC in images of fixed spleen sections (Figure S1 in Text S1). The peripheral association may be due to the location of early phagocytic compartments, Lm attaching to or within dendrites below the limit of detection or via interactions with non-fluorescent cells containing Lm. By tracking Lm in the spleen in vivo, we found Lm speeds were initially high in the first few minutes post injection representing bacteria in flow however decelerated as they came in contact with DC (Figure 1D–E). The number of bacteria arriving in the spleen decreased to less than 1 per field after 2 minutes suggesting they are rapidly taken out of circulation (Figure 1F). The speeds of Lm that arrived at later time points were slower than those in flow suggesting they were within a slow moving non-fluorescent cell (Figure 1G).
Patrolling neutrophils scavenge extracellular Lm
To test if these slow moving Lm were within neutrophils, we repeated the above experiments with LysM-EGFP knock-in mice [49]. In uninfected mice, neutrophils and monocytes express high and intermediate levels of EGFP, respectively (Figure S2 in Text S1). In the subcapsular RP of uninfected spleens, EGFPhigh neutrophils were motile in patrolling fashion (Figure 2A–B, Video S2). Upon injection of 107 Lm, there was no acute change in crawling speed (15 minutes) or at 2 hours post injection (Figure 2C, Video S2). At 2 hours, neutrophils were significantly more confined as indicated by a lower straightness ratio and displacement rate (p<0.0001, Figure 2D–E). A very small fraction of neutrophils (for example 4 out of over 200 in the imaging field) took up Lm (Figure 2, LM+, Video S2). The Lm containing neutrophils crawled with an average speed similar to Lm negative neutrophils in the same field (Figure 2C). The number of neutrophils in the field increased acutely after Lm injection (Figure 2F) and increased in frequency of total splenocytes proportionately to the number of Lm injected suggesting recruitment from the bone marrow (Figure S3 in Text S1).

During the course of Lm infection the expression level of EGFP in LysM-EGFP mice shifts such that neutrophils and monocytes express similar levels (Figure S2 in Text S1). Thus, we are not able to distinguish neutrophils and inflammatory monocytes in infected mice and will refer to all EGFP positive cells as myelomonocytes (MMCs).
DC and MMC dynamics at the site of foci of Lm growth
For long-term visualization of bacteria, we generated Lm that express TagRFP from the actA promoter (Lm-RFP), which is only expressed upon entry into the cytosol (Materials and Methods). To visualize DC and MMC dynamics at the site of Lm growth (Lm foci), we crossed CD11c-EYFP to LysM-EGFP transgenic mice. Prior to Lm injection LysM-EGFP+ cells crawled through the RP and displayed transient interactions with scDC (Video S3). Upon Lm-RFP infection, MMC accumulated at sites of Lm-RFP+ foci and accumulation increased from 24 to 48 hours (Figure 3A–B). Interestingly, Lm-RFP were detected primarily in DC at 24 hours but spread to neighboring cells, including MMC, at 48 hours p.i. (Figure 3C–D).

Although we did not directly observe cell to cell spread, Lm-RFP were detectable at the tips of EYFP+ DC extensions or “listeriopods”, a mechanism by which Lm spread to neighboring cells [50] (Figure S4 in Text S1, Video S4). We also noted fine EYFP+ tubules between well-separated scDC (Figure S4 in Text S1, Video S4) that may represent the in vivo counterparts of membrane nanotubes [51]. Infected scDC (and non-DC) contained multiple Lm (Figure S4 in Text S1, Video S4). Most scDC in the field were enlarged and contained large vacuoles consistent with activation. Several scDC were clustered together with trapped or internalized MMCs (Figure S4 in Text S1).
MMC aggregation at Lm foci is mediated by directed motility
LysM-EGFP+ MMCs that accumulate on Lm-RFP foci were CD11b+ and Gr-1+ (Figure S5 in Text S1). To observe the mechanism by which MMC accumulate at the site of infection, intravital microscopy was initiated in LysM-EGFP mice infected with Lm-RFP 48 hours prior. MMCs crawled from the periphery (up to 300 µm from the foci center) toward established foci by directed migration, as illustrated by tracks of moving cells (Figure 4A, Video S5). The biased trajectories of MMCs are shown by plotting the change in distance to the foci center against the mean speed for each cell (Figure 4B). Angles (Ψ) between MMC trajectories and the foci center [52] were more frequently less than 90° indicating directed migration towards the focus while no bias in migration within the RP is observed in the absence of infection (p<0.0001, Figure 4C). Overall turning angles were not different compared to cells crawling in uninfected mice however cells moved slightly faster (Figure 4D–E). The signal to join an established focus seemed dominant over signals from some infected cells (Video S5). MMCs within the foci were quite dynamic, but confined within the region of the foci (Video S5).

MMC protect the host from bacterial spread and tissue damage in the spleen
The Lm foci observed here are in the blood filled space of the RP. To test if MMC accumulation affects blood flow around infected cells, we selectively depleted Gr-1hi neutrophils alone or neutrophils and inflammatory monocytes with 125 or 250 µg of anti-Gr-1 antibody (RB6-8C5), respectively (Figure 5A–B and Figure S6 in Text S1). Mice were infected with Lm-RFP and intravital imaging was performed 48 hours later. In the absence of neutrophils (125 µg RB6-8C5) Lm-RFP growth increased, but they remained in foci (Figure 5A–B). Injection of fluorescent dextran transiently highlights blood flow seconds after i.v. injection. The rate of blood flow in the field of view around Lm+ foci was greatly reduced in neutrophil depleted mice compared to untreated (Figure 5C, Video S6). In untreated mice blood flow at the foci is reduced to 40% of that outside the Lm foci (Figure 5D). Strikingly, in neutrophil depleted mice, blood flow was specifically increased in these foci relative to the surrounding RP (Figure 5C–D). Thus, MMC, particularly neutrophils, are essential for restriction of blood flow in Lm foci and maintenance of surrounding tissue health.

scDC are not required for restriction of bacterial growth
The observation that Lm-RFP are detected in CD11c-EYFP DC in the first 24 hours p.i. is consistent with previous reports that CD11c+ cells are required to establish infection and were the only cells containing viable Lm in the spleen at this time point [7]. DC were also shown to secrete inflammatory cytokines thought to mediate recruitment and activation of innate effectors [8]. To test the requirement for scDC in maintaining established Lm foci, we depleted DC at 48 hours p.i. by treating CD11c-DtR transgenic mice with DT [14]. This treatment induces efficient deletion of CD11c+ cells (Figure S7 in Text S1) and has also been shown to deplete MZ macrophage populations [53]. DC depletion resulted no significant change in the number of viable Lm recovered from the spleen 24 hours later (72 hours p.i.), although we note a modest reduction (Figure S7 in Text S1). The slight decrease in Lm burden after DC depletion suggests that, DC continue to serve as a protective niche for bacterial growth at 48–72 hours p.i, consistent with a role in establishing infection. However at these later time points, Lm may have spread to neighboring cells of various cell types masking the effect of DC depletion. The lack of increase in bacterial burden demonstrates that DC do not directly contribute innate protection in the 48–72 hours p.i. Although not addressed here, it is important to note that DCs that migrate to the white pulp are required for priming adaptive immunity necessary for later clearing the infection [54].
Lm specific CD8+ T cells have reduced motility within Lm foci
On days 3–5 p.i. Lm-RFP numbers in the spleen were constant and chronic infection would develop in the absence of an adaptive T cell response [Figure S8 in Text S1, 55]. To track CD8+ T effectors at Lm foci by intravital microscopy, even after multiple cell divisions, we bred mice with one transgenic allele expressing the L9.6 T cell receptor (TCR) α and β chain and one transgenic allele with EGFP expression driven by the ubiquitin promoter (L9.6-EGFP). L9.6 TCR recognizes the subdominant, but fully protective, p60217–225 peptide presented in a stable complex with H-2Kd [56]. Naïve CD8+ T cells were isolated from L9.6-EGFP mice and transferred to CB6/F1 recipients one day prior to infection with Lm-RFP. Excess antigen specific precursors leads to altered CD8+ T cell responses [57], and thus we titrated down the number of L9.6-EGFP T cells required to detect T cells at Lm foci on day 5 p.i. (Figure S9 in Text S1). At 0.5 million L9.6-EGFP T cells transferred, we detected over 10 T cells at Lm foci. At 10 and 100 fold lower transfer numbers, T cells behaved in a similar manner but were too rare for satisfactory statistical analysis (Figure S9 in Text S1). Lm-RFP were detected in discrete foci on day 5 p.i., but RFP signal was largely degraded on day 7 consistent with live Lm cultured from the spleen at those times (Figure 6A and S8 in Text S1). On day 5 p.i., L9.6-EGFP T cells were detected in close proximity to Lm-RFP+ infected cells (Figure 6A). Inside the foci, T cells were moving slowly (mean speed = 3.64 µm/min) and made extensive contacts with Lm-RFP+ cells (Figure 6B, Video S7). Many L9.6-EGFP cells engaged in contact with the same infected cell throughout the imaging period of up to 30 minutes. Outside the foci, L9.6-EGFP cells proximal (within the field of view of approximately 200 µm from the foci center) and distal (over 200 µm) to the foci moved at a similar speed of 5.23 and 5.37 µm/min, respectively, which was significantly faster compared to cells inside foci (Figure 6B). L9.6-EGFP cells inside the foci displayed significantly higher arrest coefficients (Figure 6C) and were more confined compared to cells outside the foci (Figure 6D). On day 7 p.i., few RFP+ bacteria were detected at sites of infection (marked by necrotic and auto-fluorescent tissue) and correlated with fewer live bacteria cultured from the spleen (Figure S8 in Text S1). Coincident with the decrease in live bacteria, L9.6-EGFP CD8+ T cell motility was equivalent of those crawling outside the site of infection (Figure 6B–D). Thus, L9.6-EGFP CD8+ T cell crawling was restricted when proximal to Lm-RFP+ infected cells but not distal to infected cells and not after live bacteria are killed.

Specific peptide induces acute arrest in crawling T cells outside Lm foci
To test if MHC class I antigen recognition pathway was capable of arresting L9.6-EGFP cell migration outside foci, we injected the specific p60217–225 peptide i.v., while monitoring crawling behavior of T cells in extra-foci RP of infected mice. As a control, OT-1-dsRed CD8+ T cells were monitored in separate mice. Fluorescent dextran was included with peptide injections to mark the time of arrival in the RP, which was ∼15 seconds after injection. The p60 peptide reduced the average speed of L9.6-EGFP cells from 5.6 to 3.5 µm/min in 1.5 minutes from arrival (Figure 7A,B, Video S8) and had no effect on OT-1 T cell speed (Figure 7C,D, Video S8). OT-1 T cells decelerated in response to injection of OVA257–264 (Figure 7C,D, Video S8). These results indicate that antigen-presenting cells in the proximal and distal tissue around the foci can induce antigen specific T cell deceleration if sufficient antigen is available.

Antigen specific interactions induce confined movement and arrest within Lm foci
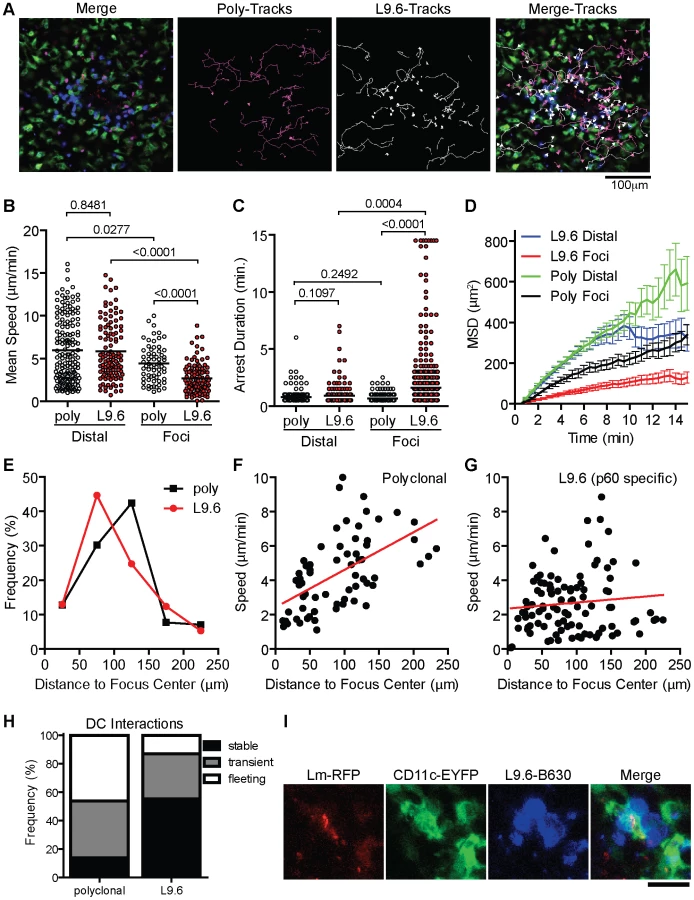
In order to test if increased arrest in the foci is antigen dependent we activated polyclonal and L9.6 CD8+ T cells in vitro, differentially labeled them with Bodipy-630 or Snarf-1 and transferred them to CD11c-EYFP CB6/F1 mice infected with Lm-RFP 48 hours prior. This allowed us to simultaneously image antigen specific and polyclonal T cells together with DC and Lm-RFP. Including polyclonal cells acts as an internal control for antigen specific affects on motility. Both polyclonal and antigen specific T cells were detected at the site of infection (Figure 8A, Video S9). Crawling speeds of both polyclonal and antigen specific cells were reduced compared to cells distal to the site of infection, however antigen specific cell speeds were further reduced compared to polyclonal cells (Figure 8B). L9.6 T cells displayed increased arrest duration (consecutive time crawling speed is <2 µm/min) and moved in a confined space as shown by the mean squared displacement (µm2) over time (Figure 8C–D). Antigen specific L9.6 T cells were also retained closer to the site of infection (Figure 8E). The non-antigen specific effects at the site of infection were reduced as cells were located further away from the foci (Figure 8F) however the effects of antigen seemed to persist further out as antigen specific L9.6 T cells were arrested even 200 µm away from the foci center (Figure 8G). Antigen specific arrest away from Lm-RFP+ infected cells may be due to infection of cells below the level of RFP fluorescence detection or acquisition of Lm antigens by phagocytic cells for cross-presentation. Next, T-DC interactions were characterized as stable (speeds<5 µm/min and within 5 µm of DC), transient (speeds 5–10 µm/min and come within 5 µm of DC) or fleeting (speeds>10 µm/min and come within 5 µm of DC), polyclonal T cell interactions were mostly fleeting, whereas L9.6 interactions were mostly stable (Figure 8H). At Lm-RFP foci we observed multiple L9.6-EGFP cells clustered around individual DC present at the site of infection (Figure 8I). Some DC were infected with multiple Lm-RFP while in others no Lm-RFP could be detected (Video S10). Interactions between L9.6-EGFP cells and scDC were extensive as DC wrapped their dendrites around T cells and the T cells frequently remained attached to one area on the DC for the entire imaging period (up to 1 hour).
As an additional control for antigen specific effects at Lm foci, we used a mutant strain Lm-218S, in which a mutation in the p60 amino acid sequence prevents loading of the p60217–225 peptide onto class I, but spares p60 function [58]. Because the response to p60217–225 is sub-dominant, it can be eliminated without altering the kinetics of bacterial clearance [58]. Because Lm-218S is not fluorescent, we identified infectious foci with propidium iodide (PI), which stains nucleic acids accessible in dead cells and neutrophil nucleic acid nets [59], [60]. In vitro-activated L9.6-EGFP cells were labeled with Bodipy-630 and transferred to CD11c-EYFP CB6/F1 mice 48 hours p.i. (Figure S10A in Text S1). L9.6 CD8+ T cells were detected at a higher frequency close to Lm-RFP foci compared to Lm-218S foci (Figure S10B in Text S1), suggesting antigen specific T cells were retained at foci. The average L9.6-EGFP cell speed and displacement rate was decreased significantly in both Lm-RFP and Lm-218S foci as compared to outside the foci (Figure S10C–D in Text S1). However, T cell motility was further reduced in Lm-RFP foci relative to Lm-218S foci (3.2 vs. 5.5 µm/min, p<0.0001), demonstrating antigen dependent differences in the speed and confinement of crawling cells at the foci. This is further supported by decreased straightness index and higher arrest coefficients in Lm-RFP foci relative to Lm-218S foci (Figure S10E–F in Text S1).
Discussion
We anticipated that our intravital analysis would require confirming some results that are known from earlier studies, but also allow us to break new ground in understanding the dynamics of immune responses in the spleen RP. Our results confirm earlier studies regarding the role of CD11c+ cells in initial capture of Lm [7] and the importance of MMC in the control of Lm growth [9], [10], [11]. We break new ground in demonstrating the speed of Lm capture, the dynamic process of directed migration of MMC to the focus, the role of MMC in reducing blood flow in foci, the relatively minor role of CD11c+ cells in ongoing innate control of Lm in the foci, and the demonstration of antigen independent and dependent components that affect CD8+ T cell movement in foci. Some would define DC based on their migration to T cell zones where they present antigen to naïve T cells, while others would include cells that reside in peripheral tissues and promote pathogen clearance by stimulating local cytokine secretion and T cell proliferation [25], [26], [27], [28]. Our results suggest that scDC are bona fide DC by the later inclusion criteria and are phenotypically similar to cells recently described to be essential for activating cytokine production by effector cells in the dermis [25]. Similar DC networks exist in the intestines, kidney and brain where these cells may largely act in situ, rather than migrating to secondary lymphoid tissues [31], [61], [62].
DC are responsible for initiating both innate and adaptive immune responses to Lm in the spleen [8], [14], but the function of the scDC networks was previously unknown. Our result that Lm associate with scDC immediately after injection is consistent with DC depletion studies that show CD11c+ cells are required to capture Lm in the spleen [7]. Extension and retraction of DC dendrites was observed before and after interaction with Lm. The continued environmental probing even after associating with Lm may enhance interactions with immune cells such as neutrophils, inflammatory monocytes, natural killer (NK) cells, memory T cells or CTLs that can contribute to innate or adaptive recognition of infection. One day after infection, scDC contained live, intracellular bacteria (as detected by actA driven RFP expression) and Lm displayed mechanisms for cell-to-cell spread, such as listeriopods. Depletion of CD11c+ cells at 48–72 hours p.i. eliminated the Lm+ DC and moderately decreased the number of viable Lm in the spleen. This suggests that scDC may serve as a reservoir for bacteria and that Lm may exploit the scDC niche to maintain the infectious foci. Consistent with this, it was previously shown that elevated numbers of DC in the spleen resulted in increased bacterial load [63]. Infection of DC may be beneficial to the host as these cells orchestrate both innate and adaptive immune responses [8], [14]. Although DC are required to prime adaptive cells required for clearing Lm, our data also suggest that once this role is fulfilled the persistently infected scDC in the red pulp are not necessary for innate control of infection. However, the scDC may have already fulfilled their roles at the time of deletion by early recruitment of MMC, which can then take over bacteriacidal and antigen presenting functions [64].
MMC were required for control of Lm as previously described [9], [10], but are not required to initiate or maintain foci through the first 48 hours of infection. This contrasts with Leishmania major infection in the skin, in which neutrophils are the reservoir required to establish infection [34]. These results also contrast with the role of macrophages in granulomas of zebrafish [37] in which motile macrophages promote spread of infection. The chemotactic attraction of MMC to Lm foci may serve to reduce egress of infected cells and dissemination to other organs. NK cell and inflammatory monocyte recruitment to Lm infected cells in the spleen is dependent on signals from chemokines [8]. However, recently it was shown that recruitment of monocytes to Lm foci in the liver was more dependent on adhesion molecules and not chemokines [12]. Thus, MMC recruitment mechanisms are likely to depend on the cell types infected and the specific structure of the tissue microenvironment. At Lm foci, swarming of MMCs around foci is reminiscent of responses to Toxoplasma gondii infection in the LN [52]. However, MMC swarming and mingling with infected scDC did not result in acute disruption of infected cells as was observed as for CD169+ macrophages in the LN. In contrast, DC internalized MMC at the site of infection. MMC at the site of infection may be a source of antigens important for priming adaptive responses [18]. Swarming and aggregation of MMCs at Lm foci was protective and maintained integrity of surrounding tissue. The MMC dependent restriction of blood flow in the foci may serve to wall off potentially harmful inflammation as well as spread of bacteria. Densely packed phagocytic cells surrounding the infected cells may act as a secondary containment to prevent bacterial escape from foci.
Antigen specific effector CD8+ T cells infiltrated Lm foci and made prolonged interactions with infected cells. The speeds of L9.6-EGFP cells in the spleen RP were similar to effector T cells in the lymph nodes and peripheral sites such as skin [40], [65], [66], [67], [68]. The average speed of T cells within Lm-RFP+ foci (day 5 p.i.) was significantly reduced, but cells were quite dynamic with some forming asymmetric mobile junctions or “kinapses” and others forming more stable non-motile symmetric contacts that may represent immunological synapses [69]. Indeed, L9.6 T cells engaged infected cells with prolonged arrest durations over 10 minutes which is sufficient time to perform CTL activity [23]. However, we did not observe any obvious cytolysis of infected cells, which may indicate other mechanisms of clearance such as anti-microbial activity stimulated by IFNγ [21], [22]. Interestingly, antigen specific cells resumed migration coincident with clearance of live bacteria. This suggests that antigen presentation does not persist at the site of infection in the absence of live bacteria. The introduction of systemic cognate antigen acutely arrested crawling T cells suggesting TCR-pMHC interactions do induce a robust “stop” signal to CD8+ T cells. Previous reports show that CD4+ T cells moved more rapidly (∼6 µm/min) in liver granulomas of BCG infected mice with few T cells arrested [38]. Mycobacterium tuberculosis (TB) organisms grow slowly and induce delayed CD4+ T cell responses [70]. The relatively faster movement to CD4+ T cells in liver granulomas compared to CD8+ T cells in Lm foci in the spleen may reflect the relatively poor direct presentation of TB or BCG antigens. The comparison of polyclonal and antigen specific T cells, as well as use of “antigen null” Lm allowed us to finely dissect out antigen dependent and independent affects on motility at the site of infection. Antigen independent components that reduce T cell movement in Lm foci of the spleen may include reduced oxygenation/nutrient supply due to poor blood flow, increased cellular congestion, changes in extracellular matrix and increased expression of adhesion molecules like ICAM-1 on infected cells [12], [71]. Recruitment of non-specific T cells may induce local crowding and prevent productive interactions between specific T cells and DC [72]. In a recent study, recall responses to Lm resulted in clusters of antigen specific and non-specific memory CD8+ T cells around infected cells in the RP within 6 hours and both specific and non-specific cells generated IFNγ, whereas only antigen specific memory cells made CCL3 [73]. It will be interesting to determine if non-specific effector cells are also stimulated to make IFNγ in Lm foci in the RP in primary responses. However, our data show that recruitment of non-specific T cells is transient as only antigen specific T cells were retained at foci in the effector phase of the primary response. Hierarchic antigen specific and antigen independent affects on motility are also observed in CD8+ and CD4+ T cells recruited to sites of Leishmania donovani infection in the liver and Leishmania major infection in the ear dermis, respectively [39], [42].
In a recent study, ex vivo spleen fragments were imaged to study T cell and DC interactions during priming in Lm infection in the WP [16]. Imaging spleen sections allows access to the WP. In contrast, we imaged the intact spleen where blood flow was maintained [45], but limited our observations to the RP and the effector arm of the immune response. Preservation of blood flow was integral to several findings in this study: a) ability to visualize the fate of Lm immediately after injection; b) observing the recruitment of MMC from the blood, which occurred continuously throughout the infection; c) and that MMC accumulation in foci excludes blood flow potentially ‘walling-off’ the infection from the rest of the host. Our observations suggest a complex relationship between Lm and spleen DC where DC may provide a niche for pathogen growth but at the same time mediate protection by recruitment of innate effectors and presenting antigens to effector T cells.
Materials and Methods
Ethics statement
This study was carried out in strict accordance with the recommendations in the Guide for the Care and Use of Laboratory Animals of the Public Health Service (National Institutes of Health). The protocol was approved by the Institutional Animal Care and Use Committee of the New York University School of Medicine (Assurance of Compliance Number: A3435-01). All surgery was performed under Ketamine, Xyalazine and Acepromazine anesthesia, and all efforts were made to minimize suffering.
Mice
LysM-EGFP, a gift of Dr. T. Graf, CD11c-EYFP mice, a gift of Dr. M. Nussenzweig, and CD11c-DtR, a gift of Dr. D. Littman, on the C57/B6 background were maintained in a colony at the barrier facility of the Skirball Institute of Biomolecular Medicine at New York University (New York, NY). CB6/F1 recipients were purchased from Jackson Labs (Bar Harbor, ME). L9.6 on a Balb/c background and Ub-GFP mice on a C57/B6 background were crossed to generate L9.6-EGFP CB6/F1 donors. CD11c-EYFP homozygous mice on the C57Bl6 background were bred to Balb/c mice to generate CD11c-EYP CB6/F1 recipients. OT-1 and Actin-dsRed mice were purchased from Jackson and crossed to generate OT-1-dsRED. Lm infected mice were housed under animal BSL2 conditions in a special room of the Skirball Institute specific pathogen free facility.
Fluorescent Lm-RFP (DP-L 5538)
Lm strains were constructed in the DP-L4056 strain background [74]. TagRFP from Entacmaea quadricolor [75] was codon optimized for expression in gram positive bacteria with Gene Designer software [76] and the cDNA was synthesized de novo (DNA2.0, Menlo Park, CA). The synthetic gene was cloned downstream of the actA promoter in the vector pPL2 and stably integrated at the tRNAArg locus of the bacterial chromosome in the as described previously [74]. All molecular constructs were confirmed by DNA sequencing.
Bacteria culture and inoculation of mice
Virulent Lm strain aliquots were kept at −80°C and grown in Brain Heart Infused media (BHI, Fisher) for 3–4 hours until ∼0.1 optical density (OD) at 600 nm. Lm were diluted to the appropriate concentration in 200 µl PBS for inoculation into mice. For acute imaging experiments 1×10⁷ Bodipy-630 labeled bacteria were injected into the retro-orbital plexus during image acquisition. For all other time points (24 hours and later) 2.5×10⁴ bacteria were injected. To facilitate location of infectious foci, in some experiments mice were infected with a 10-fold higher infectious dose (2.5×10⁵ Lm-RFP).
MMC and DC depletion in mice
For MMC depletion, LysM-EGFP mice were treated with 125 or 250 µg RB6-8C5 antibody by i.p. injection 5 hours prior to infection with Lm-RFP. Assays were performed 48 hours p.i. For DC depletion, C57/B6 and CD11c-DtR transgenic mice were infected with Lm-RFP and 48 hours later treated with 1 µg DT by i.p. injection. Assays were performed 72 hours p.i. (24 hours after DT treatment). Images of the spleens were taken by intravital micrcoscopy and then splenocytes were collected for FACS or lysed with 0.05% Triton-X 100 and bacteria were plated in serial dilutions on Brain heart infused (BHI) agarose plates to obtain colony counts.
Cells
Naïve CD8+ T cells were isolated from spleen by CD8+ T cell negative selection kit (Miltenyi Biotec, Auburn, CA). 0.5×10⁶ L9.6-EGFP or 500 OT-1-dsRed naïve cells were adoptively transferred to CB6/F1 and CD11c-EYFP CB6/F1 or C57/B6 recipients by i.v. retro-orbital injection in 100–200 µl PBS, one day before infection.
In vitro T cell activation
1×10⁶ negatively selected naïve CD8+ T cells were incubated with 2.5×10⁷ APC (ACK treated and irradiated spleen cell suspension) in 20 ml OK-DMEM, 10% fetal bovine serum with 10 nM p60217–225 and supplemented with 25 U/ml recombinant IL-2 in T25 flask (Corning 430372 or BD 353081). On day 4 post-activation, medium was replaced with fresh media plus 25 U/ml recombinant IL-2 and expanded up to 50 ml in T75 flask (BD 353135). T cells were used on day 6 post activation.
Bacteria and cell labeling
In vitro activated T cells were labeled with 1 µM Bodipy 630/650 methyl bromide (B22802, Invitrogen, Carlsbad, CA) or 1 µM Snarf-1 (S22801, Invitrogen, Carlsbad, CA) by incubation at a concentration of 10–20×106 cells per ml in PBS at 37°C for 15 minutes. Lm were labeled at a concentration of 0.5–2×10⁸ CFU per ml of 5 µM Bodipy 630/650 methyl bromide in BHI at 37°C for 15 minutes. After labeling, cells or bacteria were washed 2–3 times with PBS.
Immunostaining
Cell preparations for FACS were prepared by mashing the spleen through 40 µm filters in FACS buffer. Red blood cells were lysed by ACK. Frozen sections were prepared by fixing tissue fragments with 4% PFA PBS for 1 hour on ice and perfused with 30% sucrose PBS at least until tissue sank to the bottom of solution. Cells and tissue were stained with the following antibodies from eBioscience (San Diego, CA): CD11c (N418)-APC, CD11b (M1/70)-APC, MHC class II (M5/114.15.2)-APC, F4/80 (BM8)-APC, Ly-6C (AL-21) Pe-Cy7, Ly-6G (RB6-8C5) Alexa-700.
Peptide injections
10 µl of 10 µM p60217–225 peptide or 10 µg of OVA257–264 peptide plus 4 µg Alexa-647 10 kDa dextran (D-22914, Molecular Probes) were diluted into 100 µl PBS and injected i.v. into the retro-orbital plexus of anesthetized mice during image acquisition. Alexa-647 10 kDa dextran was included to mark the time of injection.
Surgical preparation for spleen intravital imaging
Mice were anesthetized with an intraperitoneal injection of Ketamine (50 mg/kg), Xyalazine (10 mg/kg) and Acepromazine (1.7 mg/kg) and boosted with a half dose every 30–60 minutes. The spleen was externalized by making a 1 cm incision just below the ribcage. The organ was gently tethered out of the body and a custom made plastic apparatus slid between the spleen and the mouse body. The apparatus was used to keep the organ out of the body and aids in stability. The apparatus does not disrupt the vasculature or connective tissue of the spleen. The mouse was then laid on a stage with the spleen positioned over a cover slip. The stage and mouse were heated to 37°C by flowing heated air over the system. The mouse was covered to prevent drying out the tissue and overheating. Oxygen was delivered to a mask that covers the snout to ensure the animal, and tissue, receive adequate oxygen. To verify that blood circulation through the spleen was not disrupted by the procedure, 4 µg Alexa-647 10 kDa dextran in 100 µl PBS were routinely injected i.v. into the retro-orbital plexus during image acquisition.
Confocal intravital microscopy
For intravital imaging in spleen, we used a Zeiss LSM 510 or 710 laser scanning confocal microscope (Carl Zeiss, Thornwood, NY) using an inverted Plan-Apochromat 20×/0.75, 25×/0.8, 40×/1.3 Oil DIC, or FLUAR 40×/1.3 Oil objectives. EGFP, RFP and Alexa-647 10 kDa Dextran were imaged using appropriate combinations of 488-nm, 546-nm, and 633-nm laser lines and BP 505–530, BP 560–615, and LP 650 filter sets, respectively. ECFP, EGFP and EYFP were imaged using combinations of 458-nm, 488-nm and 514-nm laser lines and BP 475–525, BP 505–530 and LP 530 filter sets, respectively. Time-lapse images were acquired by scanning 20×460.7×460.7 (20×) or 20×230.3×230.3 (40×) µm at 30 second intervals. In some cases z - stacks of images were taken at 3×10 µm steps or images were tiled during acquisition using a motorized stage. For high-resolution images of scDC and Lm, z - stack images were taken at 1 µm steps covering 14 to 20 µm.
Motility analysis and statistical calculations
Movement of cells in tissue was tracked using Volocity software (Improvision, Waltham, MA). Only cells that remained in the field of view for more than 5 frames (2.5 minutes) out of a total at least 30 frames (15 minutes) were counted as crawling cells. Distribution of cell velocities and motility parameters were non-Gaussian and thus Mann-Whitney rank sum test was used to compare data from each group. Statistical calculations and graphing were done in Prism (GraphPad Software, LaJolla, CA).
Mouse Genome Database (MGD) accession ID numbers
LysM (Lyz2) MGI:96897, LysM-eGFP (Lyz2tm1.1Graf) MGI:2654931, CD11c (Itgax) MGI:96609, CD11c-eYFP (Tg(Itgax-Venus)1Mnz) MGI:3835666, CD11c-DTR (Tg(Itgax-DTR/EGFP)57Lan) MGI:3057163, CD11b (Itgam) MGI:96607, MHC class II (H2-Ab1) MGI:103070, F4/80 (Emr1) MGI:106912, Gr-1 (Ly6g) MGI:109440, Ly-6C (Ly6c1) MGI:96882, CD8 (Cd8a) MGI:88346, TCR α (Tcra) MGI:98553, TCR β (Tcrb) MGI:98578. Mouse Genome Informatics, The Jackson Laboratory, Bar Harbor, Maine. World Wide Web (URL: http://www.informatics.jax.org).
Supporting Information
Zdroje
1. CossartP
2007 Listeriology (1926–2007): the rise of a model pathogen. Microbes Infect 9 1143 1146
2. UnanueER
1997 Studies in listeriosis show the strong symbiosis between the innate cellular system and the T-cell response. Immunol Rev 158 11 25
3. PamerEG
2004 Immune responses to Listeria monocytogenes. Nat Rev Immunol 4 812 823
4. PortnoyDA
AuerbuchV
GlomskiIJ
2002 The cell biology of Listeria monocytogenes infection: the intersection of bacterial pathogenesis and cell-mediated immunity. J Cell Biol 158 409 414
5. ConlanJW
1996 Early pathogenesis of Listeria monocytogenes infection in the mouse spleen. J Med Microbiol 44 295 302
6. AoshiT
CarreroJA
KonjufcaV
KoideY
UnanueER
2009 The cellular niche of Listeria monocytogenes infection changes rapidly in the spleen. Eur J Immunol 39 417 425
7. NeuenhahnM
KerksiekKM
NauerthM
SuhreMH
SchiemannM
2006 CD8alpha+ dendritic cells are required for efficient entry of Listeria monocytogenes into the spleen. Immunity 25 619 630
8. KangSJ
LiangHE
ReizisB
LocksleyRM
2008 Regulation of hierarchical clustering and activation of innate immune cells by dendritic cells. Immunity 29 819 833
9. ConlanJW
NorthRJ
1994 Neutrophils are essential for early anti-Listeria defense in the liver, but not in the spleen or peritoneal cavity, as revealed by a granulocyte-depleting monoclonal antibody. J Exp Med 179 259 268
10. CzuprynskiCJ
BrownJF
MaroushekN
WagnerRD
SteinbergH
1994 Administration of anti-granulocyte mAb RB6-8C5 impairs the resistance of mice to Listeria monocytogenes infection. J Immunol 152 1836 1846
11. SerbinaNV
PamerEG
2006 Monocyte emigration from bone marrow during bacterial infection requires signals mediated by chemokine receptor CCR2. Nat Immunol 7 311 317
12. ShiC
VelazquezP
HohlTM
LeinerI
DustinML
2010 Monocyte trafficking to hepatic sites of bacterial infection is chemokine independent and directed by focal intercellular adhesion molecule-1 expression. J Immunol 184 6266 6274
13. LadelCH
FleschIE
ArnoldiJ
KaufmannSH
1994 Studies with MHC-deficient knock-out mice reveal impact of both MHC I - and MHC II-dependent T cell responses on Listeria monocytogenes infection. J Immunol 153 3116 3122
14. JungS
UnutmazD
WongP
SanoG
De los SantosK
2002 In vivo depletion of CD11c(+) dendritic cells abrogates priming of CD8(+) T cells by exogenous cell-associated antigens. Immunity 17 211 220
15. MurailleE
GianninoR
GuirnaldaP
LeinerI
JungS
2005 Distinct in vivo dendritic cell activation by live versus killed Listeria monocytogenes. Eur J Immunol 35 1463 71
16. AoshiT
ZinselmeyerBH
KonjufcaV
LynchJN
ZhangX
2008 Bacterial entry to the splenic white pulp initiates antigen presentation to CD8+ T cells. Immunity 29 476 486
17. BrzozaKL
RockelAB
HiltboldEM
2004 Cytoplasmic entry of Listeria monocytogenes enhances dendritic cell maturation and T cell differentiation and function. J Immunol 173 2641 2651
18. TvinnereimAR
HamiltonSE
HartyJT
2004 Neutrophil involvement in cross-priming CD8+ T cell responses to bacterial antigens. J Immunol 173 1994 2002
19. AlbertML
SauterB
BhardwajN
1998 Dendritic cells acquire antigen from apoptotic cells and induce class I-restricted CTLs. Nature 392 86 89
20. KhannaKM
McNamaraJT
LefrancoisL
2007 In situ imaging of the endogenous CD8 T cell response to infection. Science 318 116 120
21. Narni-MancinelliE
CampisiL
BassandD
CazarethJ
GounonP
2007 Memory CD8+ T cells mediate antibacterial immunity via CCL3 activation of TNF/ROI+ phagocytes. J Exp Med 204 2075 2087
22. HartyJT
TvinnereimAR
WhiteDW
2000 CD8+ T cell effector mechanisms in resistance to infection. Annu Rev Immunol 18 275 308
23. MempelTR
PittetMJ
KhazaieK
WeningerW
WeisslederR
2006 Regulatory T cells reversibly suppress cytotoxic T cell function independent of effector differentiation. Immunity 25 129 141
24. BreartB
LemaitreF
CelliS
BoussoP
2008 Two-photon imaging of intratumoral CD8+ T cell cytotoxic activity during adoptive T cell therapy in mice. J Clin Invest 118 1390 1397
25. McLachlanJB
CatronDM
MoonJJ
JenkinsMK
2009 Dendritic cell antigen presentation drives simultaneous cytokine production by effector and regulatory T cells in inflamed skin. Immunity 30 277 288
26. McGillJ
Van RooijenN
LeggeKL
2008 Protective influenza-specific CD8 T cell responses require interactions with dendritic cells in the lungs. J Exp Med 205 1635 1646
27. WakimLM
WaithmanJ
van RooijenN
HeathWR
CarboneFR
2008 Dendritic cell-induced memory T cell activation in nonlymphoid tissues. Science 319 198 202
28. AldridgeJRJr
MoseleyCE
BoltzDA
NegovetichNJ
ReynoldsC
2009 TNF/iNOS-producing dendritic cells are the necessary evil of lethal influenza virus infection. Proc Natl Acad Sci U S A 106 5306 5311
29. CoombesJL
RobeyEA
2010 Dynamic imaging of host-pathogen interactions in vivo. Nat Rev Immunol 10 353 364
30. RescignoM
UrbanoM
ValzasinaB
FrancoliniM
RottaG
2001 Dendritic cells express tight junction proteins and penetrate gut epithelial monolayers to sample bacteria. Nat Immunol 2 361 367
31. NiessJH
BrandS
GuX
LandsmanL
JungS
2005 CX3CR1-mediated dendritic cell access to the intestinal lumen and bacterial clearance. Science 307 254 258
32. ChieppaM
RescignoM
HuangAY
GermainRN
2006 Dynamic imaging of dendritic cell extension into the small bowel lumen in response to epithelial cell TLR engagement. J Exp Med 203 2841 2852
33. NgLG
HsuA
MandellMA
RoedigerB
HoellerC
2008 Migratory dermal dendritic cells act as rapid sensors of protozoan parasites. PLoS Pathog 4 e1000222
34. PetersNC
EgenJG
SecundinoN
DebrabantA
KimblinN
2008 In vivo imaging reveals an essential role for neutrophils in leishmaniasis transmitted by sand flies. Science 321 970 974
35. AuffrayC
FoggD
GarfaM
ElainG
Join-LambertO
2007 Monitoring of blood vessels and tissues by a population of monocytes with patrolling behavior. Science 317 666 670
36. SwirskiFK
NahrendorfM
EtzrodtM
WildgruberM
Cortez-RetamozoV
2009 Identification of splenic reservoir monocytes and their deployment to inflammatory sites. Science 325 612 616
37. DavisJM
RamakrishnanL
2009 The role of the granuloma in expansion and dissemination of early tuberculous infection. Cell 136 37 49
38. EgenJG
RothfuchsAG
FengCG
WinterN
SherA
2008 Macrophage and T cell dynamics during the development and disintegration of mycobacterial granulomas. Immunity 28 271 284
39. BeattieL
PeltanA
MaroofA
KirbyA
BrownN
2010 Dynamic imaging of experimental Leishmania donovani-induced hepatic granulomas detects Kupffer cell-restricted antigen presentation to antigen-specific CD8 T cells. PLoS Pathog 6 e1000805
40. SchaefferM
HanSJ
ChtanovaT
van DoorenGG
HerzmarkP
2009 Dynamic imaging of T cell-parasite interactions in the brains of mice chronically infected with Toxoplasma gondii. J Immunol 182 6379 6393
41. WilsonEH
HarrisTH
MrassP
JohnB
TaitED
2009 Behavior of parasite-specific effector CD8+ T cells in the brain and visualization of a kinesis-associated system of reticular fibers. Immunity 30 300 311
42. Filipe-SantosO
PescherP
BreartB
LippunerC
AebischerT
2009 A dynamic map of antigen recognition by CD4 T cells at the site of Leishmania major infection. Cell Host Microbe 6 23 33
43. AoshiT
ZinselmeyerBH
KonjufcaV
LynchJN
ZhangX
2008 Bacterial Entry to the Splenic White Pulp Initiates Antigen Presentation to CD8(+) T Cells. Immunity 29 476 86
44. BajenoffM
GlaichenhausN
GermainRN
2008 Fibroblastic reticular cells guide T lymphocyte entry into and migration within the splenic T cell zone. J Immunol 181 3947 3954
45. SimsTN
SoosTJ
XeniasHS
Dubin-ThalerB
HofmanJM
2007 Opposing effects of PKCtheta and WASp on symmetry breaking and relocation of the immunological synapse. Cell 129 773 785
46. MurailleE
GianninoR
GuirnaldaP
LeinerI
JungS
2005 Distinct in vivo dendritic cell activation by live versus killed Listeria monocytogenes. Eur J Immunol 35 1463 1471
47. LindquistRL
ShakharG
DudziakD
WardemannH
EisenreichT
2004 Visualizing dendritic cell networks in vivo. Nat Immunol 5 1243 1250
48. LeenenPJ
RadosevicK
VoermanJS
SalomonB
van RooijenN
1998 Heterogeneity of mouse spleen dendritic cells: in vivo phagocytic activity, expression of macrophage markers, and subpopulation turnover. J Immunol 160 2166 2173
49. FaustN
VarasF
KellyLM
HeckS
GrafT
2000 Insertion of enhanced green fluorescent protein into the lysozyme gene creates mice with green fluorescent granulocytes and macrophages. Blood 96 719 726
50. TilneyLG
PortnoyDA
1989 Actin filaments and the growth, movement, and spread of the intracellular bacterial parasite, Listeria monocytogenes. J Cell Biol 109 1597 1608
51. WatkinsSC
SalterRD
2005 Functional connectivity between immune cells mediated by tunneling nanotubules. Immunity 23 309 318
52. ChtanovaT
SchaefferM
HanSJ
van DoorenGG
NollmannM
2008 Dynamics of neutrophil migration in lymph nodes during infection. Immunity 29 487 496
53. ProbstHC
TschannenK
OdermattB
SchwendenerR
ZinkernagelRM
2005 Histological analysis of CD11c-DTR/GFP mice after in vivo depletion of dendritic cells. Clin Exp Immunol 141 398 404
54. JungS
UnutmazD
WongP
SanoG
De los SantosK
2002 In vivo depletion of CD11c+ dendritic cells abrogates priming of CD8+ T cells by exogenous cell-associated antigens. Immunity 17 211 220
55. BadovinacVP
HartyJT
2000 Adaptive immunity and enhanced CD8+ T cell response to Listeria monocytogenes in the absence of perforin and IFN-gamma. J Immunol 164 6444 6452
56. PamerEG
1994 Direct sequence identification and kinetic analysis of an MHC class I-restricted Listeria monocytogenes CTL epitope. J Immunol 152 686 694
57. BadovinacVP
HaringJS
HartyJT
2007 Initial T cell receptor transgenic cell precursor frequency dictates critical aspects of the CD8(+) T cell response to infection. Immunity 26 827 841
58. VijhS
PilipIM
PamerEG
1998 Effect of antigen-processing efficiency on in vivo T cell response magnitudes. J Immunol 160 3971 3977
59. BrunsS
KniemeyerO
HasenbergM
AimaniandaV
NietzscheS
2010 Production of extracellular traps against Aspergillus fumigatus in vitro and in infected lung tissue is dependent on invading neutrophils and influenced by hydrophobin RodA. PLoS Pathog 6 e1000873
60. BrinkmannV
ReichardU
GoosmannC
FaulerB
UhlemannY
2004 Neutrophil extracellular traps kill bacteria. Science 303 1532 1535
61. BullochK
MillerMM
Gal-TothJ
MilnerTA
Gottfried-BlackmoreA
2008 CD11c/EYFP transgene illuminates a discrete network of dendritic cells within the embryonic, neonatal, adult, and injured mouse brain. J Comp Neurol 508 687 710
62. SoosTJ
SimsTN
BarisoniL
LinK
LittmanDR
2006 CX3CR1+ interstitial dendritic cells form a contiguous network throughout the entire kidney. Kidney Int 70 591 596
63. AlanizRC
SandallS
ThomasEK
WilsonCB
2004 Increased dendritic cell numbers impair protective immunity to intracellular bacteria despite augmenting antigen-specific CD8+ T lymphocyte responses. J Immunol 172 3725 3735
64. ScapiniP
Lapinet-VeraJA
GasperiniS
CalzettiF
BazzoniF
2000 The neutrophil as a cellular source of chemokines. Immunol Rev 177 195 203
65. KawakamiN
NagerlUV
OdoardiF
BonhoefferT
WekerleH
2005 Live imaging of effector cell trafficking and autoantigen recognition within the unfolding autoimmune encephalomyelitis lesion. J Exp Med 201 1805 1814
66. MatheuMP
BeetonC
GarciaA
ChiV
RangarajuS
2008 Imaging of effector memory T cells during a delayed-type hypersensitivity reaction and suppression by Kv1.3 channel block. Immunity 29 602 614
67. BoissonnasA
FetlerL
ZeelenbergIS
HuguesS
AmigorenaS
2007 In vivo imaging of cytotoxic T cell infiltration and elimination of a solid tumor. J Exp Med 204 345 356
68. JohnB
HarrisTH
TaitED
WilsonEH
GreggB
2009 Dynamic Imaging of CD8(+) T cells and dendritic cells during infection with Toxoplasma gondii. PLoS Pathog 5 e1000505
69. DustinML
2008 Hunter to gatherer and back: immunological synapses and kinapses as variations on the theme of amoeboid locomotion. Annu Rev Cell Dev Biol 24 577 596
70. WolfAJ
DesvignesL
LinasB
BanaieeN
TamuraT
2008 Initiation of the adaptive immune response to Mycobacterium tuberculosis depends on antigen production in the local lymph node, not the lungs. J Exp Med 205 105 115
71. DrevetsDA
1997 Listeria monocytogenes infection of cultured endothelial cells stimulates neutrophil adhesion and adhesion molecule expression. J Immunol 158 5305 5313
72. RiggsT
WaltsA
PerryN
BickleL
LynchJN
2008 A comparison of random vs. chemotaxis-driven contacts of T cells with dendritic cells during repertoire scanning. J Theor Biol 250 732 751
73. BajenoffM
Narni-MancinelliE
BrauF
LauvauG
2010 Visualizing early splenic memory CD8+ T cells reactivation against intracellular bacteria in the mouse. PLoS ONE 5 e11524
74. LauerP
ChowMY
LoessnerMJ
PortnoyDA
CalendarR
2002 Construction, characterization, and use of two Listeria monocytogenes site-specific phage integration vectors. J Bacteriol 184 4177 4186
75. MerzlyakEM
GoedhartJ
ShcherboD
BulinaME
ShcheglovAS
2007 Bright monomeric red fluorescent protein with an extended fluorescence lifetime. Nat Methods 4 555 557
76. VillalobosA
NessJE
GustafssonC
MinshullJ
GovindarajanS
2006 Gene Designer: a synthetic biology tool for constructing artificial DNA segments. BMC Bioinformatics 7 285
Štítky
Hygiena a epidemiologie Infekční lékařství LaboratořČlánek vyšel v časopise
PLOS Pathogens
2011 Číslo 3
- Parazitičtí červi v terapii Crohnovy choroby a dalších zánětlivých autoimunitních onemocnění
- Vakcíny proti klíšťové encefalitidě
- Kdy je nejlepší očkovat
- Možné vedlejší účinky očkování
- Imunogenita vakcín
Nejčtenější v tomto čísle
- A Toxin that Hijacks the Host Ubiquitin Proteolytic System
- Invasive Extravillous Trophoblasts Restrict Intracellular Growth and Spread of
- Blood Meal-Derived Heme Decreases ROS Levels in the Midgut of and Allows Proliferation of Intestinal Microbiota
- Metabolite Cross-Feeding Enhances Virulence in a Model Polymicrobial Infection
Zvyšte si kvalifikaci online z pohodlí domova
Mazová zátka a její řešení
nový kurzVšechny kurzy