
Underweight, Markers of Cachexia, and Mortality in Acute Myocardial Infarction: A Prospective Cohort Study of Elderly Medicare Beneficiaries
In this prospective cohort study of elderly medicare beneficiaries, Harlan Krumholz and colleagues investigate the association between underweight and mortality after acute myocardial infarction independent of cachexia and frailty.
Published in the journal:
. PLoS Med 13(4): e32767. doi:10.1371/journal.pmed.1001998
Category:
Research Article
doi:
https://doi.org/10.1371/journal.pmed.1001998
Summary
In this prospective cohort study of elderly medicare beneficiaries, Harlan Krumholz and colleagues investigate the association between underweight and mortality after acute myocardial infarction independent of cachexia and frailty.
Introduction
Underweight patients are at significantly higher risk of death after acute myocardial infarction (AMI) than patients with weights in the normal range [1–8]. Prior studies have largely attributed the excess mortality in underweight patients to confounding by cachexia, defined as unintentional weight loss, muscle atrophy, and fatigue that occur in the setting of chronic disease [3,9–12]; however, most studies lack information on measures of cachexia and thus are unable to test this hypothesis. As a result, it is unclear whether low body mass index (BMI) is a marker of generalized illness and risk or represents an independent risk factor worthy of attention in its own right.
Cachexia is likely mediated by neuroendocrine, metabolic, and inflammatory pathways [13,14], and the criteria used to define cachexia vary widely. Definitions in studies usually include some combination of current BMI or recent weight loss, symptoms of fatigue or anorexia, and biochemical markers in the setting of chronic disease [15]. In the absence of information on recent weight trends and patient-reported symptoms, studies in non-AMI populations have used other markers of severe illness or frailty as proxies to determine which patients are likely cachectic [16–20]. However, most studies in AMI populations lack information on patient comorbidities, frailty measures, or laboratory markers to identify these patients.
Understanding how low BMI relates to post-AMI mortality has implications for the care and management of underweight patients in hospital and after discharge. Because nutritional supplementation alone is often ineffective in reversing cachexia, treatment focuses instead on managing underlying conditions [21,22]. If low BMI is associated with mortality after AMI independent of other conditions and function, then promoting weight gain and optimizing caloric intake in underweight patients after AMI may improve outcomes, a hypothesis that could be tested. However, if the relationship between underweight and post-AMI mortality is largely explained by cachexia or other comorbid illnesses, then managing the underlying condition is as important as improving nutritional status alone.
Accordingly, we sought to further delineate the relationship between low BMI, cachexia, and mortality after AMI. We used detailed chart-abstracted data from a large cohort of Medicare beneficiaries with AMI to compare short - and long-term mortality in underweight and normal weight patients while adjusting for numerous patient comorbidities, frailty measures, and laboratory markers of nutritional status. In addition we repeated the analyses in a subset of patients without significant chronic illness. We posed two questions: (1) does comprehensive risk adjustment for comorbid illness and frailty measures explain the higher mortality after AMI in underweight patients, and (2) is the relationship between underweight and mortality also observed in patients with AMI who are otherwise without significant chronic illness and are presumably free of cachexia? Finally, we examined interactions of sex and age with underweight to determine whether the effect of underweight varies by other patient characteristics.
Methods
Study Sample
We analyzed data from the Cooperative Cardiovascular Project, a quality improvement initiative designed by the Centers for Medicare and Medicaid Services to evaluate the quality of care delivered to patients with AMI in the US [23,24]. In brief, the Cooperative Cardiovascular Project sampled fee-for-service Medicare beneficiaries hospitalized with a principal discharge diagnosis code of AMI (International Classification of Diseases, Ninth Revision, Clinical Modification code 410) from acute-care nongovernmental hospitals in the US between January 1994 and February 1996. Trained personnel performed the detailed medical record abstraction using an automated system to ensure standardization of techniques. Data quality was monitored by random reabstractions and assessment of reliability statistics. This study was approved by the Yale University institutional review board (Protocol HIC #1209010804). Informed consent was not required for this study by the Yale University institutional review board because all data had been previously collected in 1994–1996 through a centralized Medicare initiative. All data were deidentified during the analytic stages.
For this study, we limited our analysis to patients ≥65 y old who were hospitalized with AMI that was confirmed by medical record. The diagnosis of AMI was confirmed by elevated cardiac enzymes (e.g., elevation of creatine kinase–myocardial band level [>5% of total creatine kinase] or elevation of lactate dehydrogenase enzyme [LDH] level with isoenzyme reversal [LDH1 > LDH2]) or the presence of at least two of the following: chest pain, 2-fold elevation in total creatine kinase, or diagnostic changes on electrocardiogram (e.g., ST-segment elevation or new pathological Q waves). If patients were admitted more than once for AMI during the study period, we included only the first admission. Finally, we excluded patients with missing height (n = 24,014) or weight (n = 13,180) data because we could not calculate BMI for these patients.
Variable Definitions
BMI values were calculated from patients’ chart-documented height and weight at the time of AMI hospitalization. We used criteria from the Centers for Disease Control and Prevention to classify patients as underweight (BMI < 18.5 kg/m2) or normal weight (18.5 kg/m2 ≤ BMI < 25 kg/m2).
The primary outcomes were mortality at 30 d, 1 y, 5 y, and 17 y calculated from the day of hospital admission. Vital status was ascertained over 17 y through linkage to the 1994–2012 Medicare Denominator Files, which provide complete death information on all beneficiaries enrolled in Medicare.
Cachexia-related variables were identified using prior literature, clinical judgment, and face validity for their association with underweight, cachexia, and frailty. Specifically, we included comorbidities that are known to cause cachexia (i.e., congestive heart failure [CHF], chronic obstructive pulmonary disease [COPD], cerebrovascular accident (CVA) or stroke, cirrhosis/liver disease, chronic kidney disease [CKD], infection with human immunodeficiency virus [HIV] or immunocompromised state, cancer, Alzheimer disease or dementia, and other terminal illnesses). Comorbidities were ascertained through chart-documented medical history information, which was part of the patient’s medical record or collected during the index admission. In addition, we included two laboratory markers of nutritional status extracted from patient charts (anemia [hematocrit < 30%] and hypoalbuminemia [serum albumin < 3 g/dl]), and three variables reflecting frailty prior to admission (admission from a skilled nursing facility [SNF], mobility, and urinary continence on admission). Mobility (walks independently, walks with assistance, unable to walk) and incontinence (continent, totally/occasionally incontinent, anuric) on admission were determined from provider notes and chart-documented impairments. We selected these variables because validated frailty scales have typically included some combination of activities of daily living or self-sufficiency [25–27], urinary continence [26–28], mobility [25,28–30], stamina [25,28], and cognitive functioning [27–30]. Although we lacked information on cognitive functioning and stamina, we incorporated assessments of mobility and continence, and we used residence at a SNF as a proxy for self-sufficiency.
In addition to cachexia-related variables, we included information on patient demographics (age, gender, race), cardiovascular risk factors (diabetes, hypertension, smoking, prior coronary artery disease [CAD]), clinical presentation (Killip classification, systolic blood pressure, heart rate on presentation, ST-elevation AMI, anterior infarction, cardiac arrest on admission, renal insufficiency), treatment (percutaneous coronary intervention [PCI] or coronary artery bypass grafting [CABG] within the first 30 d, fibrinolytic therapy, aspirin on admission, and beta-blockers on admission), and in-hospital complications. Patients with missing systolic blood pressure were assigned the median value in the overall cohort and a dummy variable to denote missing. Patients with missing categorical variables (mobility, urinary continence, and PCI/CABG) were included in the model using dummy variables for missing data.
Statistical Analyses
Baseline characteristics (i.e., at the index admission) were compared between underweight and normal weight patients using chi-squared tests for categorical variables and Student’s t tests for continuous variables. To evaluate the relationship of underweight to short - and long-term mortality, we performed two sets of analyses modeling BMI first as a categorical and then as a continuous variable. In analyses of BMI as a categorical variable, we used chi-squared tests, Kaplan–Meier curves with log-rank tests, and Cox proportional hazards regression to compare unadjusted and adjusted mortality at 30 d, 1 y, 5 y, and 17 y after AMI between normal weight and underweight patients. In addition, we calculated conditional hazard ratios (HRs) for the intervals 0 to 30 d, >30 d to 1 y, >1 to 5 y, and >5 to 17 y to determine whether underweight patients were at higher risk of death early after AMI or accrued a survival disadvantage over time. Interaction terms for sex and age with underweight were tested in all models.
In the second set of analyses, we modeled BMI as a continuous variable to better characterize the shape of the association of low BMI with 1 - and 17-y mortality. Specifically, we modeled the hazards of death relative to patients with a BMI of 20 kg/m2 using proportional hazards regression restricted cubic spline models with knots located at each BMI integer value [31,32]. This approach combines linear and nonlinear transformations of BMI at different sections of the BMI curve to identify the best-fitting transformations for the association between BMI and mortality. Models were then repeated adjusting for the same covariates above.
Finally, because multivariate adjustment may be insufficient to remove confounding by cachexia, we repeated the above analyses in a subset of patients without significant comorbidity or frailty (n = 20,587). Specifically, we excluded patients with CHF, COPD, CVA/stroke, cirrhosis/liver disease, CKD, HIV, cancer, Alzheimer disease/dementia, terminal illness, anemia, or hypoalbuminemia; patients admitted from SNFs; and patients with mobility issues or incontinence. All statistical analyses were performed using SAS 9.2 (SAS Institute).
Results
Our sample included 5,678 (9.8%) underweight patients and 51,896 (90.2%) normal weight patients. Underweight and normal weight patients represented 44% of all eligible patients. Compared with patients with recorded BMI values, patients with missing BMI were on average older (mean age 78.6 versus 76.0 y, p < 0.001). In addition, they were more likely to be admitted from SNFs (14.0% versus 5.0%, p < 0.001) and less likely to be mobile (68.1% versus 80.7%, p < 0.001) or continent (82.0% versus 92.0%, p < 0.001) on admission. Patients with missing BMI had higher in-hospital and 17-y mortality rates (in hospital: 27.0% versus 11.9%, p < 0.001; 17 y: 96.1% versus 92.3%, p < 0.001).
Underweight patients, compared with normal weight patients, were older, on average, and a greater percentage of them were women (Table 1). Although underweight patients had a lower prevalence of diabetes, hypertension, and prior CAD, they had significantly higher rates of smoking, nearly all other comorbidities (including CHF, COPD, CVA/stroke, CKD, cancer, and Alzheimer disease/dementia), anemia, and hypoalbuminemia. They were also more likely to be admitted from SNFs and to have decreased mobility and urinary continence on admission (Table 1). Underweight patients were significantly less likely to receive guideline-based therapies on admission including aspirin, beta-blockers, fibrinolytic therapy, and revascularization procedures.

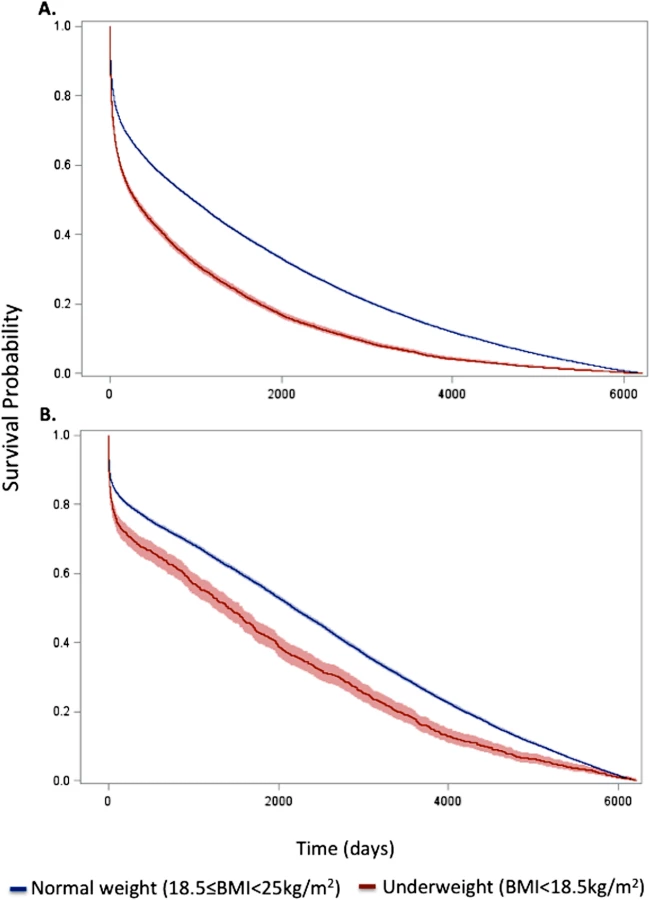
In-hospital mortality was significantly higher for underweight patients compared with normal weight patients; however, rates of most other in-hospital complications were similar (Table 1). Crude mortality was significantly higher for underweight patients than normal weight patients at 30 d (25.2% versus 16.4%), 1 y (51.3% versus 33.8%), 5 y (79.2% versus 59.4%), and 17 y (98.3% versus 94.0%) (all p < 0.001) (Fig 1; Table 1). Conditional HRs showed divergence of the survival curves over all 17 y of follow-up, suggesting that underweight patients remained at a significant survival disadvantage over time (Table 2). After adjustment for patient and treatment characteristics during the index admission, underweight patients remained at a significant survival disadvantage across all follow-up time points: the curves diverged early and remained separate over the 17 y of follow-up. Underweight patients had a 13% greater risk of death within the first 30 d and a 26% greater risk of death over the full 17 y of follow-up (30-d adjusted HR 1.13, 95% CI 1.07–1.20; 17-y adjusted HR 1.26, 95% CI 1.23–1.30) (Table 2).

When BMI was examined as a continuous variable, there was an inverse relationship between BMI and the hazards of death at both 1 and 17 y. The highest risk of death was observed in those with very low BMI (<17 kg/m2), and the lowest risk in those with BMIs in the upper range of normal (>24 kg/m2). This relationship persisted after adjustment (Figs 2 and S1).

To further reduce the potential for confounding by cachexia, we repeated the analyses in a subset of underweight and normal weight patients without significant comorbidities or markers of frailty. Compared with the previous analyses, a smaller percentage of the cohort was classified as underweight (n = 1,081, 5.2%). However, baseline comparisons between underweight and normal weight patients in this subset were similar to those in the previous analyses (Table 1). Crude mortality rates were higher for underweight patients across all follow-up time points (30 d: 16.7% versus 10.7%; 1 y: 29.9% versus 19.0%; 5 y: 53.8% versus 37.3%; 17 y: 94.5% versus 87.7%) (Fig 1; Table 1), and risk estimates were similar to those in the analyses of all patients (Table 2). Conditional HRs again showed early divergence of the survival curves, which remained separate over all 17 y of follow-up (Table 2). After adjustment, underweight and normal weight patients had a similar risk of 30-d mortality (HR 1.08, 95% CI 0.93–1.26); however, the long-term risk of death in underweight patients remained significantly higher than that in normal weight patients (17-y HR 1.21, 95% CI 1.14–1.29). Similarly, when BMI was modeled as a continuous variable, we observed an inverse relationship between BMI and the hazards of death; however, the magnitudes of the HRs for low BMIs were smaller in the subset of patients without significant comorbidity than in all patients (Fig 2).
Underweight was associated with an increased risk of death in both sexes and at all ages at both 1 and 17 y; however, the relationship between underweight and mortality was stronger in men and younger patients (65–75 y of age) (p-values for interactions < 0.01) (Fig 3). After limiting the cohort to patients without significant comorbidity, however, only the interaction between underweight and age on 17-y mortality was significant (S2 Fig).

Discussion
Using detailed clinical data from a large study of elderly patients with AMI, we found that low BMI was associated with increased short - and long-term mortality after AMI. Underweight patients had a 61% to 73% higher crude risk of death than normal weight patients at all follow-up time points. The survival curves for underweight and normal weight patients diverged early and remained separate over all 17 y of follow-up, suggesting that underweight patients accrued a survival disadvantage over time. Although adjustment for markers of cachexia (comorbid conditions and measures of frailty and nutritional status) as well as other patient and treatment characteristics attenuated some of the excess risk in underweight patients, underweight patients still had a 13% to 27% higher risk of death than normal weight patients. Furthermore, when we restricted the cohort to a subset of patients without significant comorbidity or frailty, underweight patients continued to have an 8% to 22% higher risk of death than normal weight patients.
Like our study, prior studies, focusing largely on shorter-term outcomes, have consistently reported higher mortality for underweight patients [1–8]; however, these findings have been largely attributed to incomplete adjustment and confounding by other cachexia-related conditions, a conclusion that has not to our knowledge been previously tested [3,9–11]. Building on prior studies, we were able to demonstrate that although cachexia explains some of the excess mortality in underweight patients after AMI, low BMI is an independent predictor of mortality after AMI even in patients at lowest risk for cachexia. These findings point to different mechanisms in the relationship between underweight and mortality after AMI than those previously hypothesized and have implications for interventions.
Several mechanisms may explain the higher mortality in underweight patients. First, patients with low BMI have decreased physiologic reserve and fat stores, which may lower their ability to withstand insults to health over time and make them more vulnerable to adverse events. Patients with CAD have increased cardiometabolic demands due to activation of neurohormonal and inflammatory pathways [5]. Increased subcutaneous fat and energy reserves may help to overcome these catabolic changes. For underweight patients, hospitalizations for cardiac events may lead to additional weight loss, which can place them at higher risk of infection, complications, and, ultimately, repeat hospitalizations. Once in this cyclic process, patients may never fully recover to baseline and may remain at increased risk of mortality long after the index hospitalization. Indeed, our finding that the underweight and normal weight survival curves remain separated over time indicates that underweight patients are still accruing a survival disadvantage for years after the initial hospitalization.
Second, we observed that underweight patients were significantly less likely to receive guideline-recommended therapies for AMI including primary reperfusion and revascularization procedures. These lower treatment rates in underweight patients may be due to either physician bias or poorer clinical presentations on arrival. Some studies have hypothesized that the lack of functional reserve in underweight patients can lead to unfavorable hemodynamic changes during AMI, which may preclude these patients from receiving therapies [33]. Furthermore, underweight patients may be at higher risk of medication - or procedure-related complications. Prior studies have shown that underweight patients have smaller coronary vessels, which may lead to suboptimal artery-to-device ratios and higher rates of bleeding after PCI [34]. Similarly, others have proposed that medications used to treat CAD may have limited efficacy or greater toxicity in underweight patients, although there is limited evidence supporting this claim [35]. Although we adjusted for eligibility and receipt of therapies, we were unable to adjust for procedure-related variables or complications, which may offer more insight into the effectiveness of these therapies in underweight patients.
Third, the pathophysiology of AMI may be a fundamentally different process in underweight patients than in normal weight and overweight patients. Because CAD is largely attributable to the detrimental effects of adiposity and other modifiable risk factors associated with obesity, underweight patients may have an underlying genetic predisposition to CAD, which could be associated with worse prognosis [36]. Indeed, other studies have found that despite their lower prevalence of cardiovascular risk factors, underweight patients have more severe and extensive coronary disease than normal weight and overweight patients [37,38].
Finally, it is possible that residual confounding either by variables in the model or other unmeasured variables may explain the association of low BMI with mortality. Although we adjusted for and subsequently excluded patients with comorbid conditions such as CHF, COPD, and cancer, we were unable to adjust for the severity, duration, or complications of illness. Thus, it is possible that, in addition to having more comorbidity, underweight patients also had longer standing or more severe disease or were at higher risk of having undiagnosed disease, which may have compounded their risk of mortality after AMI. Additionally, we lacked information on other BMI-associated risk factors and comorbidities such as malnutrition, autoimmune and inflammatory disorders, and severe systemic illnesses or multi-organ dysfunction, which may be more prevalent in underweight patients.
To our knowledge, this is the first study to report differences in the effect of underweight on mortality after AMI by age and sex. Although the mechanisms underlying these differences are unclear, it is possible that lower BMI in men reflects a more malnourished or cachetic state since men typically have higher BMIs and lean body mass than women. We also found that underweight was more potent in younger patients. Although these differences by age may reflect our ability to detect larger differences in mortality in younger patients, who have higher overall survival, it is also possible that older age acts as an equalizer of risk because both underweight and normal weight older patients have reduced physiologic reserve to overcome acute events like AMI [39–41].
Clinically, our findings imply that underweight patients may benefit from treatment strategies that focus on promoting nutritional status and weight gain, regardless of the reason for their low BMI. Such strategies may include inpatient caloric supplementation and outpatient nutritional consults in addition to pharmacotherapy. Recently, pharmaceutical agents, such as megestrol acetate, medroxyprogesterone, ghrelin, and omega-3-fatty acid, have been used to promote weight gain and improve survival in the setting of cancer and cardiac cachexia [42–44]. Such agents may benefit underweight patients with and without cachexia after AMI; however, trials are needed to test whether use of these therapies improves weight gain in patients with AMI and whether weight gain in underweight patients improves survival after AMI. Similarly, a better understanding of why underweight patients are at increased risk of mortality after AMI—including the physiologic, therapeutic, and systems-level causes—would help us to better target therapies to improve outcomes in these patients.
Our study has some limitations. First, we were unable to directly determine which patients met the criteria for cachexia. Although many criteria exist, most include current BMI or recent weight loss, symptoms of fatigue or anorexia, and biochemical markers in the setting of chronic disease. Like many other studies, we lacked information on recent weight trends and thus relied on other markers of frailty, nutritional status, and comorbid conditions to identify patients at highest risk for cachexia. Second, many factors other than cachexia may contribute to low BMI in elderly patients, including malnutrition, sarcopenia, genetics, or increased metabolic demands. We lacked information on nutritional status and recent weight loss and therefore were unable to determine the primary cause of low BMI in underweight patients. Thus, it is possible that the effect of underweight on post-AMI mortality varies by cause. Future studies should evaluate the effect of nutritional status and lifetime changes in BMI on the relationship between underweight and mortality after AMI. Third, we used patient BMI measured at the index hospitalization. Reports from other AMI cohorts have been mixed, with some reporting minimal weight changes in the year after AMI [45] and others reporting sizeable weight gains or losses [46,47], although these studies have largely been performed in cohorts of heavier patients. Fourth, we excluded 27,690 patients (17.5% of the initial sample) for missing BMI data. Because patients with missing BMI data had higher short - and long-term mortality rates than patients in our sample, our cohort may be healthier than the general AMI population. Fifth, we lacked information on cause of death and thus could not identify the cause of the excess deaths. Finally, we used dummy variables for missing data rather than imputing missing values. Although this approach is not preferred because patients with missing data can have dissimilar values [48], we chose this approach due to the high computational cost of multiple imputations and the low missing data rates.
Conclusions
In summary, we found that low BMI was associated with short - and long-term mortality after AMI independent of confounding by factors associated with cachexia. These findings suggest a different mechanism than previously hypothesized and highlight the need for additional research in underweight patients, who are frequently excluded from studies evaluating BMI in patients with CAD. Clinically, these findings suggest that strategies to promote weight gain in underweight patients after AMI are worthy of testing.
Supporting Information
Zdroje
1. Aronson D, Nassar M, Goldberg T, Kapeliovich M, Hammerman H, Azzam ZS. The impact of body mass index on clinical outcomes after acute myocardial infarction. Int J Cardiol. 2010;145 : 476–480. doi: 10.1016/j.ijcard.2009.12.029 20096942
2. Kang WY, Jeong MH, Ahn YK, Kim JH, Chae SC, Kim YJ, et al. Obesity paradox in Korean patients undergoing primary percutaneous coronary intervention in ST-segment elevation myocardial infarction. J Cardiol. 2010;55 : 84–91. doi: 10.1016/j.jjcc.2009.10.004 20122553
3. Kragelund C, Hassager C, Hildebrandt P, Torp-Pedersen C, Kober L. Impact of obesity on long-term prognosis following acute myocardial infarction. Int J Cardiol. 2005;98 : 123–131. 15676176
4. Lazzeri C, Valente S, Chiostri M, Attana P, Picariello C, Sorini Dini C, et al. Impact of age on the prognostic value of body mass index in ST-elevation myocardial infarction. Nutr Metab Cardiovasc Dis. 2013;23 : 205–211. doi: 10.1016/j.numecd.2012.05.013 22901842
5. O’Brien EC, Fosbol EL, Peng SA, Alexander KP, Roe MT, Peterson ED. Association of body mass index and long-term outcomes in older patients with non-ST-segment-elevation myocardial infarction: results from the CRUSADE Registry. Circ Cardiovasc Qual Outcomes. 2014;7 : 102–109. doi: 10.1161/CIRCOUTCOMES.113.000421 24326936
6. Witassek F, Schwenkglenks M, Erne P, Radovanovic D. Impact of body mass index on mortality in Swiss hospital patients with ST-elevation myocardial infarction: does an obesity paradox exist? Swiss Med Wkly. 2014;144:w13986. doi: 10.4414/smw.2014.13986 25102276
7. Angeras O, Albertsson P, Karason K, Ramunddal T, Matejka G, James S, et al. Evidence for obesity paradox in patients with acute coronary syndromes: a report from the Swedish Coronary Angiography and Angioplasty Registry. Eur Heart J. 2013;34 : 345–353. doi: 10.1093/eurheartj/ehs217 22947610
8. Niedziela J, Hudzik B, Niedziela N, Gasior M, Gierlotka M, Wasilewski J, et al. The obesity paradox in acute coronary syndrome: a meta-analysis. Eur J Epidemiol. 2014;29 : 801–812. doi: 10.1007/s10654-014-9961-9 25354991
9. Lavie CJ, De Schutter A, Milani RV. Healthy obese versus unhealthy lean: the obesity paradox. Nat Rev Endocrinol. 2015;11 : 55–62. doi: 10.1038/nrendo.2014.165 25265977
10. Kennedy LM, Dickstein K, Anker SD, Kristianson K, Willenheimer R. The prognostic importance of body mass index after complicated myocardial infarction. J Am Coll Cardiol. 2014;45 : 154–164.
11. Hastie CE, Padmanabhan S, Slack R, Pell AC, Oldroyd KG, Flapan AD, et al. Obesity paradox in a cohort of 4880 consecutive patients undergoing percutaneous coronary intervention. Eur Heart J. 2010;31 : 222–226. doi: 10.1093/eurheartj/ehp317 19687163
12. Rea TD, Heckbert SR, Kaplan RC, Psaty BM, Smith NL, Lemaitre RN, et al. Body mass index and the risk of recurrent coronary events following acute myocardial infarction. Am J Cardiol. 2001;88 : 467–472. 11524051
13. Evans WJ, Morley JE, Argiles J, Bales C, Baracos V, Guttridge D, et al. Cachexia: a new definition. Clin Nutr. 2008;27 : 793–799. doi: 10.1016/j.clnu.2008.06.013 18718696
14. Anker SD, Sharma R. The syndrome of cardiac cachexia. Int J Cardiol. 2002;85 : 51–66. 12163209
15. von Haehling S, Anker SD. Prevalence, incidence and clinical impact of cachexia: facts and numbers-update 2014. J Cachexia Sarcopenia Muscle. 2014;5 : 261–263. doi: 10.1007/s13539-014-0164-8 25384990
16. Engelman DT, Adams DH, Byrne JG, Aranski SF, Collins JJ, Couper GS, et al. Impact of body mass index and albumin on morbidity and mortality after cardiac surgery. J Thorac Cardiovasc Surg. 1999;118 : 866–873. 10534692
17. Martin L, Birdsell L, Macdonald N, Reiman T, Clandinin MT, McCargar LJ, et al. Cancer cachexia in the age of obesity: skeletal muscle depletion is a powerful prognostic factor, independent of body mass index. J Clin Oncol. 2013;31 : 1539–1547. doi: 10.1200/JCO.2012.45.2722 23530101
18. Pausch T, Hartwig W, Hinz U, Swolana T, Bundy BD, Hackert T, et al. Cachexia but not obesity worsens the postoperative outcome after pancreatoduodenectomy in pancreatic cancer. Surgery. 2012;152:S81–S88. doi: 10.1016/j.surg.2012.05.028 22770957
19. Schols AM, Broekhuizen R, Weling-Scheepers CA, Wouters EF. Body composition and mortality in chronic obstructive pulmonary disease. Am J Clin Nutr. 2005;82 : 53–59. 16002800
20. Wallengren O, Lundholm K, Bosaeus I. Diagnostic criteria of cancer cachexia: relation to quality of life, exercise capacity and survival in unselected palliative care patients. Support Care Cancer. 2013;21 : 1569–1577. doi: 10.1007/s00520-012-1697-z 23314651
21. Springer J, Filippatos G, Akashi YJ, Anker SD. Prognosis and therapy approaches of cardiac cachexia. Curr Opin Cardiol. 2006;21 : 229–233. 16601462
22. QuBaiah O, Morley JE. Pathophysiology of cachexia in the elderly. In: Mantovani G, Anker G, Inui A, Morley JE, Fanelli R, Scevola D, et al, editors. Cachexia and wasting: a modern approach. New York City: Springer Science and Business Media; 2007. pp. 383–395.
23. Marciniak TA, Ellerbeck EF, Radford MJ, Kresowik TF, Gold JA, Krumholz HM, et al. Improving the quality of care for Medicare patients with acute myocardial infarction: results from the Cooperative Cardiovascular Project. JAMA. 1998;279 : 1351–1357. 9582042
24. Ramunno LD, Dodds TA, Traven ND. Cooperative Cardiovascular Project (CCP) quality improvement in Maine, New Hampshire, and Vermont. Eval Health Prof. 1998;21 : 442–460. 10351558
25. Studenski S, Hayes RP, Leibowitz RQ, Bode R, Lavery L, Walston J, et al. Clinical Global Impression of Change in Physical Frailty: development of a measure based on clinical judgment. J Am Geriatr Soc. 2004;52 : 1560–1566. 15341562
26. Rockwood K, Stadnyk K, MacKnight C, McDowell I, Hebert R, Hogan DB. A brief clinical instrument to classify frailty in elderly people. Lancet. 1999;353 : 205–206. 9923878
27. Rolfson DB, Majumdar SR, Tsuyuki RT, Tahir A, Rockwood K. Validity and reliability of the Edmonton Frail Scale. Age Ageing. 2006;35 : 526–529. 16757522
28. Cacciatore F, Abete P, Mazzella F, Viati L, Della Morte D, D’Ambrosio D, et al. Frailty predicts long-term mortality in elderly subjects with chronic heart failure. Eur J Clin Invest. 2005;35 : 723–730. 16313247
29. Bielderman A, van der Schans CP, van Lieshout MJ, de Greef MHG, Boersma F, Krijnen WP, et al. Multidimensional structure of the Groningen Frailty Indicator in community-dwelling older people. BMC Geriatr. 2013;13 : 86. doi: 10.1186/1471-2318-13-86 23968433
30. Gobbens RJ, van Assen MA, Luijkx WG, Wijnen-Sponselee MT, Schols JM. The Tilburg Frailty Indicator: psychometric properties. J Am Med Dir Assoc. 2010;11 : 344–355. doi: 10.1016/j.jamda.2009.11.003 20511102
31. Heinzl H, Kaider A. Gaining more flexibilty in Cox proportional hazards models with cubic spline functions. Comput Methods Programs Biomed. 1997;54 : 201–208. 9421665
32. RCS: gaining more flexibility in Cox proportional hazards regression models with cubic spline functions. [cited 21 Mar 2016]. Vienna: Center for Medical Statistics, Informatics, and Intelligent Systems. Available: http://cemsiis.meduniwien.ac.at/kb/wf/software/statistische-software/rcs/.
33. Steinberg BA, Cannon CP, Hernandez AF, Pan W, Peterson ED, Fonarow GC. Medical therapies and invasive treatments for coronary artery disease by body mass: the “obesity paradox” in the Get With The Guidelines database. Am J Cardiol. 2007;100 : 1331–1335. 17950785
34. Byrne J, Spence MS, Fretz E, Mildenberger R, Chase A, Berry B, et al. Body mass index, periprocedural bleeding, and outcome following percutaneous coronary intervention (from the British Columbia Cardiac Registry). Am J Cardiol. 2009;103 : 507–511. doi: 10.1016/j.amjcard.2008.10.027 19195511
35. Diercks DB, Roe MT, Mulgund J, Pollack CV, Kirk JD, Gibler WB, et al. The obesity paradox in non-ST-segment elevation acute coronary syndromes: results from the Can Rapid risk stratification of Unstable angina patients Suppress ADverse outcomes with Early implementation of the American College of Cardiology/American Heart Association Guidelines Quality Improvement Initiative. Am Heart J. 2006;152 : 140–148. 16824844
36. Sharma A, Vallakati A, Einstein AJ, Lavie CJ, Arbab-Zadeh A, Lopez-Jimenes F, et al. Relationship of body mass index with total mortality, cardiovascular mortality, and myocardial infarction after coronary revascularization: evidence from a meta-analysis. Mayo Clin Proc. 2014;89 : 1080–1100. doi: 10.1016/j.mayocp.2014.04.020 25039038
37. Reeves BC, Ascione R, Chamberlain MH, Angelini GD. Effect of body mass index on early outcomes in patients undergoing coronary artery bypass surgery. J Am Coll Cardiol. 2003;42 : 668–676. 12932599
38. Shirzad M, Karimi A, Armadi SH, Marzban M, Abbasi K, Alinejad B, et al. Effects of body mass index on early outcome of coronary artery bypass surgery. Minerva Chir. 2009;64 : 17–23. 19202532
39. Boss GR, Seegmiller JE. Age-related physiological changes and their clinical significance. West J Med. 1981;135 : 434–440. 7336713
40. Cheitlin MD. Cardiovascular physiology—changes with aging. Am J Geriatr Cardiol. 2003;12 : 9–13. 12502909
41. Goldspink DF. Ageing and activity: their effects on the functional reserve capacities of the heart and vascular smooth and skeletal muscles. Ergonomics. 2005;48 : 1334–1351. 16338704
42. Aoyagi T, Terracina KP, Raza A, Matsubara H, Takabe K. Cancer cachexia, mechanism and treatment. World J Gastrointest Oncol. 2015;7 : 17–29. doi: 10.4251/wjgo.v7.i4.17 25897346
43. Lavie CJ, De Schutter A, Alpert MA, Mehra MR, Milani RV, Ventura HO. Obesity paradox, cachexia, frailty, and heart failure. Heart Fail Clin. 2014;10 : 319–326. doi: 10.1016/j.hfc.2013.12.002 24656108
44. Khajuria V, Gupta S, Rani N, Raina V. Pharmacotherapy of cachexia. JK Sci. 2014;16 : 98–100.
45. Fadl YY, Krumholz HM, Kosiborod M, Masoudi FA, Peterson PN, Reid KJ, et al. Predictors of weight change in overweight patients with myocardial infarction. Am Heart J. 2007;154 : 711–717. 17892997
46. Kennedy LM, Dickstein K, Anker SD, James M, Cook TJ, Kristianson K, et al. Weight-change as a prognostic marker in 12,550 patients following acute myocardial infarction or with stable coronary artery disease. Eur Heart J. 2006;27 : 2755–2762. 16891382
47. Lopez-Jimenez F, Wu CO, Tian X, O’Connor C, Rich MW, Burg MM, et al. Weight change after myocardial infarction—the Enhancing Recovery in Coronary Heart Disease patients (ENRICHD) experience. Am Heart J. 2008;155 : 478–484. doi: 10.1016/j.ahj.2007.10.026 18294480
48. Carpenter J, Bartlett J, Kenward M. Introduction to missing data. [cited 21 Mar 2016]. London: London School of Hygiene & Tropical Medicine. Available: http://missingdata.lshtm.ac.uk/index.php?option=com_content&view=section&id=7&Itemid=96.
Štítky
Interní lékařstvíČlánek vyšel v časopise
PLOS Medicine
2016 Číslo 4
- Srovnání vlivu omeprazolu a pantoprazolu na antiagregační účinek klopidogrelu
- Fixní kombinace kandesartan/amlodipin v terapii arteriální hypertenze
- Současné postavení a přínos sartanů v klinické praxi
- Prognostický význam hladiny natriuretických peptidů při léčbě empagliflozinem
- Hypertrofická obstrukční kardiomyopatie ve světle moderní farmakoterapie – kazuistika
Nejčtenější v tomto čísle
- Observational Evidence of For-Profit Delivery and Inferior Nursing Home Care: When Is There Enough Evidence for Policy Change?
- Experimental Treatment of Ebola Virus Disease with TKM-130803: A Single-Arm Phase 2 Clinical Trial
- The Chernobyl Disaster and Beyond: Implications of the Sendai Framework for Disaster Risk Reduction 2015–2030
- Is There Evidence of Poorer Birth Outcomes for Mothers and Babies When the Most Senior Obstetrician Is Not On Site?
Zvyšte si kvalifikaci online z pohodlí domova
Mazová zátka a její řešení
nový kurzVšechny kurzy