
Assessing Causality in the Association between Child Adiposity and Physical Activity Levels: A Mendelian Randomization Analysis
Background:
Cross-sectional studies have shown that objectively measured physical activity is associated with childhood adiposity, and a strong inverse dose–response association with body mass index (BMI) has been found. However, few studies have explored the extent to which this association reflects reverse causation. We aimed to determine whether childhood adiposity causally influences levels of physical activity using genetic variants reliably associated with adiposity to estimate causal effects.
Methods and Findings:
The Avon Longitudinal Study of Parents and Children collected data on objectively assessed activity levels of 4,296 children at age 11 y with recorded BMI and genotypic data. We used 32 established genetic correlates of BMI combined in a weighted allelic score as an instrumental variable for adiposity to estimate the causal effect of adiposity on activity.
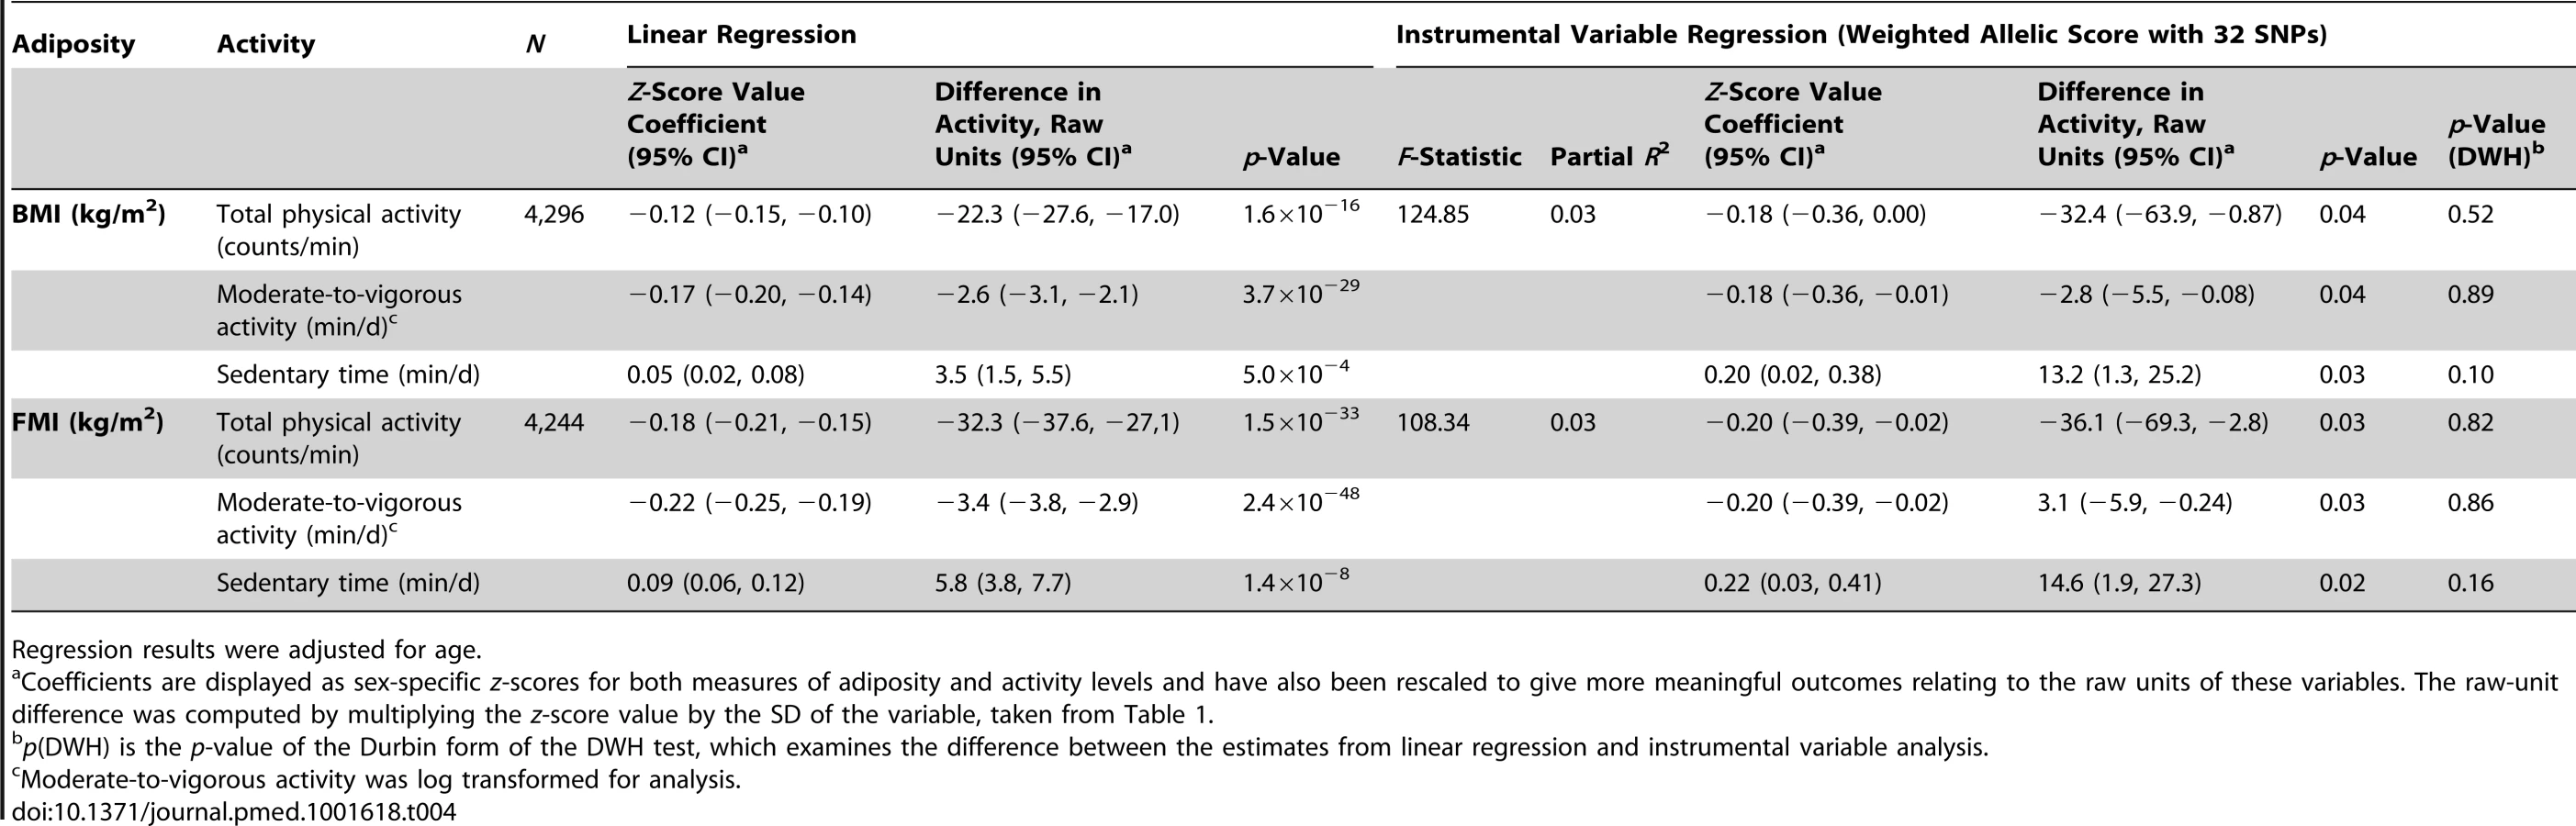
In observational analysis, a 3.3 kg/m2 (one standard deviation) higher BMI was associated with 22.3 (95% CI, 17.0, 27.6) movement counts/min less total physical activity (p = 1.6×10⁻¹⁶), 2.6 (2.1, 3.1) min/d less moderate-to-vigorous-intensity activity (p = 3.7×10⁻²⁹), and 3.5 (1.5, 5.5) min/d more sedentary time (p = 5.0×10⁻⁴). In Mendelian randomization analyses, the same difference in BMI was associated with 32.4 (0.9, 63.9) movement counts/min less total physical activity (p = 0.04) (∼5.3% of the mean counts/minute), 2.8 (0.1, 5.5) min/d less moderate-to-vigorous-intensity activity (p = 0.04), and 13.2 (1.3, 25.2) min/d more sedentary time (p = 0.03). There was no strong evidence for a difference between variable estimates from observational estimates. Similar results were obtained using fat mass index. Low power and poor instrumentation of activity limited causal analysis of the influence of physical activity on BMI.
Conclusions:
Our results suggest that increased adiposity causes a reduction in physical activity in children and support research into the targeting of BMI in efforts to increase childhood activity levels. Importantly, this does not exclude lower physical activity also leading to increased adiposity, i.e., bidirectional causation.
Please see later in the article for the Editors' Summary
Published in the journal:
. PLoS Med 11(3): e32767. doi:10.1371/journal.pmed.1001618
Category:
Research Article
doi:
https://doi.org/10.1371/journal.pmed.1001618
Summary
Background:
Cross-sectional studies have shown that objectively measured physical activity is associated with childhood adiposity, and a strong inverse dose–response association with body mass index (BMI) has been found. However, few studies have explored the extent to which this association reflects reverse causation. We aimed to determine whether childhood adiposity causally influences levels of physical activity using genetic variants reliably associated with adiposity to estimate causal effects.
Methods and Findings:
The Avon Longitudinal Study of Parents and Children collected data on objectively assessed activity levels of 4,296 children at age 11 y with recorded BMI and genotypic data. We used 32 established genetic correlates of BMI combined in a weighted allelic score as an instrumental variable for adiposity to estimate the causal effect of adiposity on activity.
In observational analysis, a 3.3 kg/m2 (one standard deviation) higher BMI was associated with 22.3 (95% CI, 17.0, 27.6) movement counts/min less total physical activity (p = 1.6×10⁻¹⁶), 2.6 (2.1, 3.1) min/d less moderate-to-vigorous-intensity activity (p = 3.7×10⁻²⁹), and 3.5 (1.5, 5.5) min/d more sedentary time (p = 5.0×10⁻⁴). In Mendelian randomization analyses, the same difference in BMI was associated with 32.4 (0.9, 63.9) movement counts/min less total physical activity (p = 0.04) (∼5.3% of the mean counts/minute), 2.8 (0.1, 5.5) min/d less moderate-to-vigorous-intensity activity (p = 0.04), and 13.2 (1.3, 25.2) min/d more sedentary time (p = 0.03). There was no strong evidence for a difference between variable estimates from observational estimates. Similar results were obtained using fat mass index. Low power and poor instrumentation of activity limited causal analysis of the influence of physical activity on BMI.
Conclusions:
Our results suggest that increased adiposity causes a reduction in physical activity in children and support research into the targeting of BMI in efforts to increase childhood activity levels. Importantly, this does not exclude lower physical activity also leading to increased adiposity, i.e., bidirectional causation.
Please see later in the article for the Editors' Summary
Introduction
Cross-sectional studies have shown that objectively measured physical activity is associated with childhood adiposity [1]–[6], and a strong inverse dose–response association with body mass index (BMI) has been found [1]. However, confounding or reverse causation (where adiposity influences inactivity, rather than vice versa) may explain part of the association [7],[8]. Indeed, there may be a bidirectional relationship between adiposity and physical activity, and this would imply that only a small change in adiposity or physical activity may be required to initiate a cycle of weight gain and increased inactivity [9].
There are few randomized trials examining the effectiveness of physical activity interventions for weight loss [10]. Those that exist report smaller, if any, effects on BMI [11]–[14] than predicted by observational associations. However, the efficacy of BMI as a measure of adiposity is subject to debate, and some improvements in other measures of fatness such as skinfold thickness have been demonstrated in school-based physical activity interventions, without an accompanying reduction in BMI [14]. Nevertheless, the small effect seen in these trials suggests that reverse causation may in part have generated the association between physical activity and adiposity observed in cross-sectional studies. These findings, together with the quality of the trials—which has been limited by short trial duration, lack of assessment of trial adherence, or a limited difference in activity achieved between intervention and control groups [12]—call for further investigation and the use of genetic instruments as a better surrogate for adiposity.
To address the issue of reverse causation, prospective studies have measured activity and adiposity at multiple time points in children [7],[15]–[22], although few studies have investigated bidirectional associations between activity and fatness in childhood and adolescence. Of those that have, one showed a lack of longitudinal association between physical activity and body composition [21], while three showed that whereas physical activity could not predict fatness, fatness was predictive of future physical inactivity [7],[20],[22]. Sample size and poorly assessed activity have limited the ability to infer the causal direction of effects, even where longitudinal data are available.
Mendelian randomization (MR) can be used to assess whether adiposity causally affects activity levels [23]. MR is an approach that applies instrumental variable methods, using genetic variants as a proxy for environmentally modifiable exposures. This technique, which is analogous to a randomized trial where randomization to genotype takes place at conception, is not susceptible to reverse causation or confounding and so may be used to reassess observational associations and strengthen causal inference [23]–[26].
Previous MR studies investigating the effect of adiposity on various outcomes have used one or a few of the common genetic locus variants with the largest effect sizes to serve as instruments [27]–[32]. In this study, we aimed to use 32 independent genetic correlates of BMI, confirmed in a large-scale meta-analysis of genome-wide association studies (GWASs) [33], to elucidate the causality and magnitude of the effect of adiposity on activity levels in children (Figure 1A).

Methods
Study Sample
The Avon Longitudinal Study of Parents and Children (ALSPAC) is a prospective birth cohort that enrolled over 13,000 pregnant women in the former County of Avon, UK, with an expected delivery date between April 1991 and December 1992 [34],[35]. Detailed information has been collected on these women and their offspring using self-administered questionnaires, research clinic examinations, data extraction from medical notes, and linkage to routine information systems. The study website contains details of all available data through a fully searchable data dictionary (http://www.bristol.ac.uk/alspac/researchers/data-access/data-dictionary/). Ethical approval was obtained from the ALSPAC Law and Ethics Committee and local research ethics committees.
Exposure Variables
Body composition was measured at a clinic where the children's average age was 11.7 y [1]. BMI, the primary exposure variable, was calculated as weight (in kilograms) divided by height (in meters) squared. BMI as a measure of adiposity has well-recognised limitations [36],[37], and of particular concern for this analysis is that BMI does not distinguish between fat and lean mass, since lean mass correlates positively with levels of activity [2]. Therefore, phenotypic refinement was employed through the use of total body fat, assessed using a Lunar Prodigy dual energy X-ray absorptiometry scanner [1]. The fat mass index (FMI) was subsequently calculated as fat mass (in kilograms) divided by height (in meters) squared.
Outcome Variables
All children who attended the age 11-y clinic were asked to wear an MTI Actigraph AM7164 2.2 accelerometer for 7 d [38]. Only data from children who wore the Actigraph for at least 10 h/d for 3 d were included in this analysis. Movement counts were detected as a combined function of the frequency and intensity of movements. Activity was expressed as the total daily volume of physical activity averaged over the period of valid recording (counts/minute), and as time spent on moderate-to-vigorous-intensity physical activity (>3,600 counts/min) [39] and sedentary time (<199 counts/min) in minutes/day [40].
Genotyping
9,912 ALSPAC children were genotyped using the Illumina HumanHap550 quad genome-wide single nucleotide polymorphism (SNP) genotyping platform by the Wellcome Trust Sanger Institute (Cambridge, UK) and the Laboratory Corporation of America (Burlington, North Carolina, US). Individuals with incorrect sex assignments, extreme heterozygosity (<0.320 and >0.345 for Wellcome Trust Sanger Institute data and <0.310 and >0.330 for Laboratory Corporation of America data), disproportionate levels of individual missingness (>3%), evidence of cryptic relatedness (>10% identity by descent), or non-European ancestry were excluded. The resulting dataset consisted of 8,365 individuals. Of 609,203 SNPs, those with a minor allele frequency of <1%, with a call rate of <95%, or not in Hardy–Weinberg equilibrium (p<5×10⁻⁷) were removed, leaving 500,527 SNPs that passed quality control. Established BMI variants that had not been genotyped directly were imputed with MACH 1.0.16 Markov Chain Haplotyping software [41],[42] using CEPH individuals from HapMap phase 2 (release 22) as a reference set.
From these genome-wide data, a weighted allelic score was created using 32 independent variants shown to be robustly associated with BMI in a large-scale GWAS meta-analysis [33] (Table S1). The dose of the effect allele at each locus was weighted by the effect size of the variant in this independent meta-analysis [33], and these doses were summed to reflect the average number of BMI-increasing alleles carried by an individual. This weighted allelic score was created to act as an instrumental variable in MR analysis, and explained a greater proportion of variance in BMI than single SNPs [43]. The allelic score was also used as an instrument for FMI.
Statistical Methods
Means and standard deviations (SD) were calculated for continuous variables to describe baseline characteristics. The distribution of moderate-to-vigorous activity was skewed and was therefore log-transformed to achieve normality. All adiposity and activity values were converted to sex-specific SD (z) scores.
Observational associations between adiposity and activity measures were assessed using linear regression adjusted for age. Additional analyses were adjusted for potentially confounding factors that have been found to be independently associated with obesity [44], including maternal pre-pregnancy BMI, estimated gestational age at birth, infant birth weight, maternal education level, parental social class, maternal smoking during pregnancy, child's stage of puberty at age 11 y, total daily dietary intake, and intake of main food groups.
For investigating associations between the allelic score and standardised phenotypes, continuous effects were estimated using linear regression with adjustment for age. An additive genetic model was assumed since there was no evidence for interaction effects among the SNPs combined in the allelic score [33]. MR analysis may generally forego the need for inclusion of other covariates, which are anticipated to be randomly distributed with respect to genotype [23]. Despite this, we examined associations between the confounding factors and genotypes to check the core instrumental variable assumption that the instrument (genotype) is independent of factors that potentially confound the observational association [25],[26].
For MR analyses, we performed two-stage least squares using the weighted allelic score as an instrument for adiposity and implementing the “ivreg2” function in Stata. F-statistics from the first-stage regression between genotype and adiposity were examined to check the instrumental variable assumption that the instrument is sufficiently associated with the exposure, in order to reduce the possibility of weak instrument bias [45]. The Durbin-Wu-Hausman (DWH) test for endogeneity [46] was used to compare effect estimates from the second stage of the instrumental variable analysis and observational analysis. Stata 12 (StataCorp) was used for all analyses.
Sensitivity Analyses
Multiple independent instruments
The existence of pleiotropy, where a genetic instrument has an effect on an outcome (activity) independent of its effect on the exposure (adiposity), would have implications for assumptions made in MR analyses [47]. Similar instrumental variable estimates acquired using independent instruments would provide suggestive evidence against an influence of pleiotropic effects, as it is unlikely that they have shared pleiotropy [43],[48]. The two independent genetic instruments generated were rs1558902 in FTO, the individual SNP with the largest effect size in the meta-analysis of GWASs for BMI [33], and a weighted allelic score constructed from the remaining 31 BMI-associated SNPs.
Genome-wide prediction for physical activity
An exploratory MR analysis investigating the association between adiposity and activity levels may provide evidence for causality in this direction. However, it does not exclude the possibility that physical activity has a causal effect on adiposity levels. A genetic instrument for activity is required to test the relationship in a bidirectional manner (Figure 1B) [31],[32]. No meta-analysis of GWASs has so far been reported for physical activity, and no genetic variants have been robustly associated with activity to date [49],[50]. Genome-wide prediction scores, which examine the aggregated contribution of genome-wide variation in a trait, have the potential to recover some of the information lost by dismissing false-negative results in GWASs [51]–[55] and may be used as instruments in MR analysis.
Before the generation of a genetic instrument for physical activity, the heritability of activity in ALSPAC was assessed to consider the plausibility of a genetic contribution to activity. GCTA (Genome-wide Complex Trait Analysis) (version 1.04) [56] was used to estimate the total amount of variance captured by all 500,527 SNPs in the genotypic data for the activity measures. The approach first involves the estimation of a genetic relationship matrix for individuals based on autosomal genotype information, with a further cryptic relatedness cutoff of 2.5% applied to reduce the potential for biased estimates. The variance of each activity trait attributable to all SNPs was estimated using restricted maximum likelihood. Given evidence of a heritable contribution to observed variance in activity measures (Table S2), genome-wide prediction scores were generated for total physical activity, moderate-to-vigorous activity, and sedentary time. Individuals in the complete sample were randomized into two subgroups. Using activity and genotypic data from the first subgroup (n = 2,148), genetic variants yielding a p-value≤0.1 in a GWAS for each activity variable were extracted, and prediction scores were constructed using profile scoring and the “–score” command within PLINK (version 1.07) [57]. The prediction score is a sum across SNPs of the number of reference alleles multiplied by the weight for that SNP, which is its effect size in the GWAS with activity.
We used split sample analysis, where the physical activity prediction scores from the first subgroup (composed of one half of the sample) were applied to individuals in the second independent subgroup (composed of the other half of the sample) and used in two-stage least squares instrumental variable analysis to assess a causal effect of activity on adiposity. This method was repeated with prediction scores generated from data in the second subgroup and applied to instrumental variable analysis in the first [58]. The results of these two instrumental variable analyses were meta-analysed using the inverse variance-weighted method with a fixed-effects model. A test for heterogeneity [59] was performed to investigate similarity between instrumented effects in the two independent subgroups.
We performed all of the above analyses stratified by sex because a sex interaction for the associations between adiposity and activity levels has been shown previously [1] (Tables S11, S12, S13).
Results
Of the 11,952 children who were invited to attend the research clinic, 7,159 (59.9%) came to the clinic. 6,622 of the 7,159 (92.5%) agreed to wear an Actigraph accelerometer, and 5,595 of the 6,622 (84.5%) returned Actigraph accelerometer data that satisfied the validity criteria. Of the 5,595, BMI and genotypic data were available for 4,296 children (76.8%). FMI estimates were available for 4,244 children (75.8%) (Figure 2).

Of the individuals included in this analysis, 22.1% (950/4,296) were defined as being overweight and 4.2% (181/4,296) as obese, according to age - and sex-specific cutoffs proposed by the International Obesity Task Force [60]. A comparison of the baseline characteristics of individuals who did and did not attend the age 11-y clinic has been described in detail elsewhere [1]. Differences in baseline characteristics between the subset of children included in this analysis and those who did not attend the age 11-y clinic are shown in Table S3. The children included in this analysis were more likely to be girls and had a higher birth weight, higher gestational age at birth, higher social class, higher dietary intake at age 10 y and mothers who were less likely to be smokers and were more highly educated.
Observational Analysis
From observational analysis of baseline characteristics, objectively assessed activity levels were higher for boys than girls for total physical activity (664.6 versus 555.1 mean movement counts/min, p<0.001) and for moderate-to-vigorous activity (25.8 versus 16.0 median min/d, p<0.001). Sedentary time was higher for girls than for boys (435.6 versus 418.2 mean min/d, p<0.001), as were mean values of BMI (19.1 versus 18.7 kg/m2, p<0.001) and fat mass (12.7 versus 10.2 kg, p<0.001) (Table 1). BMI and FMI were strongly correlated (Pearson's correlation coefficient = 0.94).

A 3.3 kg/m2 (1 SD) higher BMI was associated with 22.3 (95% CI, 17.0, 27.6) counts/min less total physical activity (p = 1.6×10⁻¹⁶), 2.6 (2.1, 3.1) min/d less moderate-to-vigorous activity (p = 3.7×10⁻²⁹), and 3.5 (1.5, 5.5) min/d more sedentary time (p = 5.0×10⁻⁴). These associations were stronger when using FMI instead of BMI and were largely unaltered by adjusting for additional confounders (Table 2). In observational analyses stratified by sex, effect estimates were larger in boys for all activity phenotypes (Table S11).

Direct Genotypic Associations
The BMI allelic score was normally distributed, with a mean of 29.6, SD of 3.9, and range of 16.3–42.3 (Figure S1). A per (average BMI-increasing) allele change in the allelic score was associated with a 0.14 (95% CI, 0.12, 0.17) kg/m2 increase in BMI (p = 5.5×10⁻²⁹), and a 0.11 (0.09, 0.13) kg/m2 increase in FMI (p = 2.3×10⁻²⁵) (Table 3). The BMI allelic score explained 2.8% of the variance in standardised BMI in this cohort, and 2.5% of the variance in FMI.

In contrast to BMI and FMI, confounding factors were not associated with the genotypes in this cohort (Table S4). Although the allelic score showed some weak associations with reported dietary intake and certain food groups and macronutrients (Table S5), these associations are largely driven by the inclusion of FTO in the score. As dietary intake is a known mediator in the association between FTO and adiposity [61], adjustment in instrumental variable analysis would not be appropriate.
A per allele change in the BMI allelic score was associated with a decrease of 1.4 (95% CI, 0.0, 2.8) counts/min of total physical activity (p = 0.05), an approximate decrease of 0.1 (0.0, 0.2) min/d of moderate-to-vigorous activity (p = 0.05), and an increase of 0.6 (0.1, 1.1) min/d of sedentary time (p = 0.03) (Table 3).
Mendelian Randomization
Instrumental variable analysis using the BMI allelic score showed that a 3.3 kg/m2 higher BMI was associated with 32.4 (95% CI, 0.9, 63.9) counts/min less total physical activity (p = 0.04) (equivalent to 5.3% of the mean counts/min), 2.8 (0.1, 5.5) min/d less moderate-to-vigorous activity (p = 0.04), and 13.2 (1.3, 25.2) min/d more sedentary time (p = 0.03) (F-statistic = 124.9; partial R2 = 0.03).
There was no evidence of a departure of instrumental-variable-derived estimates from observational results, as demonstrated by DWH tests (p≥0.10), indicating similarity between observational and MR estimates in the effect of BMI on physical activity levels. Furthermore, point estimates for effect sizes from the instrumental variable analysis were equal to or greater than those derived from basic observational analyses for all traits, though wider confidence intervals for the instrumental variable estimates resulted in larger pvalues.
Similar results were found when FMI was instrumented (Table 4). In addition, similar results were found when using physical activity and adiposity data for individuals at age 13 y, though the number of individuals at this time point was smaller (Table S6). In sensitivity analyses stratified by sex, wide confidence intervals for instrumental variable estimates did not allow the resolution of differences between boys and girls (Table S11).
Multiple Independent Instruments
An analysis of the alleles included in the BMI allelic score showed that rs1558902 (FTO) was the variant contributing most to its association with BMI (Figure 3). Results of instrumental variable analysis using this genetic variant were compared with those of a weighted allelic score consisting of the 31 genetic variants excluding FTO (Tables 5 and 6). The instrumented effect for FTO showed some difference to observational estimates, especially for sedentary time, where the instrumental variable analysis produced larger effect estimates than the observational analysis (p = 0.01 for DWH test). However, there was no strong statistical evidence that the instrumented effects of BMI on activity levels were different from one another (p for heterogeneity ≥0.06). An additional analysis was run that showed that independent pairs of variants from the 32 SNPs have normally distributed instrumental variable effects. Although pairs of variants including FTO lie at the lower end of this distribution, indicating that variation in FTO produces a larger-than-average effect in the instrumental variable analysis, this effect is not an outlier (Figure S2). Similar results were found when FMI was instrumented.


Genome-Wide Prediction for Physical Activity
The additive heritability of activity measures was estimated to be 17%–25% (Table S2), indicating a non-negligible contribution of genetic variation to variance in physical activity levels. Genome-wide prediction scores were generated for each of the activity measures and applied in instrumental variable analysis to independent subgroups. Physical activity scores were normally distributed and showed some association with their respective activity measures in the other subgroups (Table S7). The physical activity scores had no substantive correlation with the BMI allelic score (Table S8), providing evidence that the instruments for adiposity and physical activity were independent of each other.
There was no strong statistical evidence that the instrumented effects of activity on adiposity in the subgroups were different from each other (p for heterogeneity ≥0.11). A meta-analysis of both instrumental variable analyses, unlike observational analysis, found no strong evidence for a causal effect of physical activity on BMI at age 11 y (regression coefficient 0.27 [95% CI, −0.41, 0.94], p = 0.44, for total physical activity; −0.03 [−0.72, 0.66], p = 0.93, for moderate-to-vigorous activity; −0.51 [−1.24, 0.22], p = 0.17, for sedentary time, with z-standardised units of BMI and activity measures) (Table S9). Results were similar when FMI was the outcome (Table S10). However, confidence intervals were wide, and small F-statistics indicated that caution should be applied when using these instruments for physical activity (F≤6.80).
Discussion
This study used a MR approach to investigate a causal role for elevated BMI and FMI in lower physical activity levels in children. In agreement with previous findings that adiposity loci identified by GWASs in adults are associated with childhood anthropometric traits [62],[63], the allelic score derived from established genetic variants for BMI was strongly associated with both exposures of interest (BMI and FMI). The allelic score explained a larger proportion of the variation in BMI compared with FMI. Nonetheless, the F-statistic for the association between the allelic score and FMI was large (>100), supporting previous findings for consistent associations between the 32 BMI-associated loci and other measures of adiposity [64].
The similarity between observational and instrumental variable estimates for the association between BMI and physical activity provides evidence suggesting that increasing adiposity leads to a causal reduction in total and moderate-to-vigorous physical activity, and a causal increase in the length of sedentary time. Associations from instrumental variable analysis were marginally stronger between FMI and activity levels, as expected given that BMI does not differentiate between fat and lean mass, and lean mass correlates positively with levels of activity. These results are in line with findings from recent prospective studies that show that fatness is predictive of reduced physical activity at later time points [7],[20],[22].
The finding that the calculated effect sizes in this MR analysis account for a substantial proportion of the association between adiposity and activity identified in observational studies [1]–[6] has important public health implications. Whilst the mechanisms of this pathway are unclear and may constitute both physiological and psychological factors [65],[66], evidence that adiposity is a causal risk factor for low physical activity is important, since it has been recommended that children spend at least 60 min in moderate-to-vigorous-intensity physical activity each day in order to maintain their physical health [67]–[73]. In particular, this evidence highlights the importance of developing programmes targeting body weight in order to increase physical activity levels in overweight children [74].
A limitation of the study was that we were not able to collect physical activity, body composition, or genetic data on a substantial number of children originally enrolled in the study. These missing data can lead to a bias if the causal effect of adiposity on physical activity (and vice versa) is different in the children who did not take part. Whilst we cannot fully exclude such a bias, associations were not altered by adjustment for factors associated with missing data [1]. Possible limitations to the MR analysis in general include the possibility of population stratification, canalization, power deficiency, pleiotropy, and linkage disequilibrium [23],[47]. Major population stratification is unlikely since this analysis was completed in unrelated individuals of European ancestry. A pleiotropic association of a genetic variant included in the allelic score with the outcome, or linkage disequilibrium with a functional variant associated with the outcome, would violate the assumptions of MR analysis. Multiple independent instruments were used to provide evidence against the existence of shared pleiotropy and against the influence of linkage-disequilibrium-induced confounding [48]. Whereas instrumental variable estimates for the association between adiposity and physical activity obtained using the 31-SNP allelic score (excluding FTO) were consistently similar to observational effect sizes, the estimates produced using the FTO variant as an instrument were generally larger than observational findings. However, there was no strong statistical evidence for a difference between the instrumented estimates, arguing against a pleiotropic effect. It should be emphasised that this investigation does not provide definitive evidence against the existence or impact of pleiotropy, and more functional knowledge of the variants is required to assess this more comprehensively.
With evidence for causality in the direction from adiposity to activity levels, further analyses were undertaken to address the reciprocal association between physical activity and levels of adiposity in children at age 11 y. The absence of a causal effect of physical activity on adiposity goes some way towards explaining the lack of impact of short-term physical activity intervention trials on adiposity levels in children [11]–[13]. It is also in line with the fact that there is little evidence that there has been a major decline in physical activity during the course of the obesity epidemic [75], compared with stronger evidence that there has been an increase in energy intake in the same time period [76]. Although no causal effect was shown in our preliminary analysis, this analysis is likely to suffer from limitations of small sample sizes and inadequacy of the prediction scores for physical activity in terms of the association between genotype and physical activity [77]–[79], genetic confounding, or pleiotropy. In addition, split sample instrumental variable methods have been shown to generate estimates that are biased towards the null [58]. Before we can confirm or refute a complete lack of effect of activity levels on adiposity using MR analysis, a well-powered study with strong genetic instruments for physical activity variables is required. Therefore, findings from this secondary analysis do not exclude lower physical activity also leading to increases in adiposity and a “vicious cycle” being initiated [9].
Results of our main analysis suggest that increased adiposity leads to a reduction in physical activity. Although further work is required to determine a more accurate estimate of the causal effect in the reverse direction, this study provides insight into the causal contributions of adiposity to activity levels in children and supports research into the targeting of BMI in efforts to increase childhood activity levels.
Supporting Information
Zdroje
1. NessAR, LearySD, MattocksC, BlairSN, ReillyJJ, et al. (2007) Objectively measured physical activity and fat mass in a large cohort of children. PLoS Med 4: e97.
2. EkelundU, SardinhaLB, AnderssenSA, HarroM, FranksPW, et al. (2004) Associations between objectively assessed physical activity and indicators of body fatness in 9 - to 10-y-old European children: a population-based study from 4 distinct regions in Europe (the European Youth Heart Study). Am J Clin Nutr 80 : 584–590.
3. DenckerM, ThorssonO, KarlssonMK, LindenC, EibergS, et al. (2006) Daily physical activity related to body fat in children aged 8–11 years. J Pediatr 149 : 38–42.
4. TrostSG, KerrLM, WardDS, PateRR (2001) Physical activity and determinants of physical activity in obese and non-obese children. Int J Obes Relat Metab Disord 25 : 822–829.
5. OrtegaFB, RuizJR, SjostromM (2007) Physical activity, overweight and central adiposity in Swedish children and adolescents: the European Youth Heart Study. Int J Behav Nutr Phys Act 4 : 61.
6. Jimenez-PavonD, KellyJ, ReillyJJ (2010) Associations between objectively measured habitual physical activity and adiposity in children and adolescents: systematic review. Int J Pediatr Obes 5 : 3–18.
7. MetcalfBS, HoskingJ, JefferyAN, VossLD, HenleyW, et al. (2011) Fatness leads to inactivity, but inactivity does not lead to fatness: a longitudinal study in children (EarlyBird 45). Arch Dis Child 96 : 942–947.
8. LukeA, CooperRS (2013) Physical activity does not influence obesity risk: time to clarify the public health message. Int J Epidemiol 42 : 1831–1836.
9. ChristiansenE, SwannA, SorensenTI (2008) Feedback models allowing estimation of thresholds for self-promoting body weight gain. J Theor Biol 254 : 731–736.
10. CookCM, SchoellerDA (2011) Physical activity and weight control: conflicting findings. Curr Opin Clin Nutr Metab Care 14 : 419–424.
11. KamathCC, VickersKS, EhrlichA, McGovernL, JohnsonJ, et al. (2008) Behavioral interventions to prevent childhood obesity: a systematic review and metaanalyses of randomized trials. J Clin Endocrinol Metab 93 : 4606–4615.
12. HarrisKC, KuramotoLK, SchulzerM, RetallackJE (2009) Effect of school-based physical activity interventions on body mass index in children: a meta-analysis. CMAJ 180 : 719–726.
13. McGovernL, JohnsonJN, PauloR, HettingerA, SinghalV, et al. (2008) Clinical review: treatment of pediatric obesity: a systematic review and meta-analysis of randomized trials. J Clin Endocrinol Metab 93 : 4600–4605.
14. SunC, PezicA, TikellisG, PonsonbyAL, WakeM, et al. (2013) Effects of school-based interventions for direct delivery of physical activity on fitness and cardiometabolic markers in children and adolescents: a systematic review of randomized controlled trials. Obes Rev 14 : 818–838.
15. RiddochCJ, LearySD, NessAR, BlairSN, DeereK, et al. (2009) Prospective associations between objective measures of physical activity and fat mass in 12–14 year old children: the Avon Longitudinal Study of Parents and Children (ALSPAC). BMJ 339: b4544.
16. MooreLL, GaoD, BradleeML, CupplesLA, Sundarajan-RamamurtiA, et al. (2003) Does early physical activity predict body fat change throughout childhood? Prev Med 37 : 10–17.
17. RemmersT, SleddensEF, GubbelsJS, de VriesSI, MommersM, et al. (2014) Relationship between physical activity and the development of body mass index in children. Med Sci Sports Exerc 46 : 177–184.
18. ReichertFF, Baptista MenezesAM, WellsJC, Carvalho DumithS, HallalPC (2009) Physical activity as a predictor of adolescent body fatness: a systematic review. Sports Med 39 : 279–294.
19. WilksDC, SharpSJ, EkelundU, ThompsonSG, ManderAP, et al. (2011) Objectively measured physical activity and fat mass in children: a bias-adjusted meta-analysis of prospective studies. PLoS ONE 6: e17205.
20. EkelundU, LuanJ, SherarLB, EsligerDW, GriewP, et al. (2012) Moderate to vigorous physical activity and sedentary time and cardiometabolic risk factors in children and adolescents. JAMA 307 : 704–712.
21. HallalPC, ReichertFF, EkelundU, DumithSC, MenezesAM, et al. (2012) Bidirectional cross-sectional and prospective associations between physical activity and body composition in adolescence: birth cohort study. J Sports Sci 30 : 183–190.
22. HjorthMF, ChaputJP, RitzC, DalskovSM, AndersenR, et al. (2013) Fatness predicts decreased physical activity and increased sedentary time, but not vice versa: support from a longitudinal study in 8 - to 11-year-old children. Int J Obes (Lond) E-pub ahead of print.
23. Davey SmithG, EbrahimS (2003) ‘Mendelian randomization’: can genetic epidemiology contribute to understanding environmental determinants of disease? Int J Epidemiol 32 : 1–22.
24. Davey SmithG, LawlorDA, HarbordR, TimpsonN, DayI, et al. (2007) Clustered environments and randomized genes: a fundamental distinction between conventional and genetic epidemiology. PLoS Med 4: e352.
25. LawlorDA, HarbordRM, SterneJA, TimpsonN, Davey SmithG (2008) Mendelian randomization: using genes as instruments for making causal inferences in epidemiology. Stat Med 27 : 1133–1163.
26. DidelezV, SheehanN (2007) Mendelian randomization as an instrumental variable approach to causal inference. Stat Methods Med Res 16 : 309–330.
27. TimpsonNJ, HarbordR, Davey SmithG, ZachoJ, Tybjaerg-HansenA, et al. (2009) Does greater adiposity increase blood pressure and hypertension risk?: Mendelian randomization using the FTO/MC4R genotype. Hypertension 54 : 84–90.
28. LawlorDA, HarbordRM, Tybjaerg-HansenA, PalmerTM, ZachoJ, et al. (2011) Using genetic loci to understand the relationship between adiposity and psychological distress: a Mendelian randomization study in the Copenhagen General Population Study of 53,221 adults. J Intern Med 269 : 525–537.
29. LawlorDA, TimpsonNJ, HarbordRM, LearyS, NessA, et al. (2008) Exploring the developmental overnutrition hypothesis using parental-offspring associations and FTO as an instrumental variable. PLoS Med 5: e33.
30. NordestgaardBG, PalmerTM, BennM, ZachoJ, Tybjaerg-HansenA, et al. (2012) The effect of elevated body mass index on ischemic heart disease risk: causal estimates from a Mendelian randomisation approach. PLoS Med 9: e1001212.
31. TimpsonNJ, NordestgaardBG, HarbordRM, ZachoJ, FraylingTM, et al. (2011) C-reactive protein levels and body mass index: elucidating direction of causation through reciprocal Mendelian randomization. Int J Obes (Lond) 35 : 300–308.
32. WelshP, PoliseckiE, RobertsonM, JahnS, BuckleyBM, et al. (2010) Unraveling the directional link between adiposity and inflammation: a bidirectional Mendelian randomization approach. J Clin Endocrinol Metab 95 : 93–99.
33. SpeliotesEK, WillerCJ, BerndtSI, MondaKL, ThorleifssonG, et al. (2010) Association analyses of 249,796 individuals reveal 18 new loci associated with body mass index. Nat Genet 42 : 937–948.
34. BoydA, GoldingJ, MacleodJ, LawlorDA, FraserA, et al. (2013) Cohort profile: the ‘children of the 90s’—the index offspring of the Avon Longitudinal Study of Parents and Children. Int J Epidemiol 42 : 111–127.
35. FraserA, Macdonald-WallisC, TillingK, BoydA, GoldingJ, et al. (2013) Cohort profile: the Avon Longitudinal Study of Parents and Children: ALSPAC mothers cohort. Int J Epidemiol 42 : 97–110.
36. GarnSM, LeonardWR, HawthorneVM (1986) Three limitations of the body mass index. Am J Clin Nutr 44 : 996–997.
37. PrenticeAM, JebbSA (2001) Beyond body mass index. Obes Rev 2 : 141–147.
38. RiddochCJ, MattocksC, DeereK, SaundersJ, KirkbyJ, et al. (2007) Objective measurement of levels and patterns of physical activity. Arch Dis Child 92 : 963–969.
39. MattocksC, LearyS, NessA, DeereK, SaundersJ, et al. (2007) Calibration of an accelerometer during free-living activities in children. Int J Pediatr Obes 2 : 218–226.
40. MattocksC, NessA, LearyS, TillingK, BlairSN, et al. (2008) Use of accelerometers in a large field-based study of children: protocols, design issues, and effects on precision. J Phys Act Health 5 (Suppl 1) S98–S111.
41. LiY, WillerC, SannaS, AbecasisG (2009) Genotype imputation. Annu Rev Genomics Hum Genet 10 : 387–406.
42. LiY, WillerCJ, DingJ, ScheetP, AbecasisGR (2010) MaCH: using sequence and genotype data to estimate haplotypes and unobserved genotypes. Genet Epidemiol 34 : 816–834.
43. PalmerTM, LawlorDA, HarbordRM, SheehanNA, TobiasJH, et al. (2012) Using multiple genetic variants as instrumental variables for modifiable risk factors. Stat Methods Med Res 21 : 223–242.
44. ReillyJJ, ArmstrongJ, DorostyAR, EmmettPM, NessA, et al. (2005) Early life risk factors for obesity in childhood: cohort study. BMJ 330 : 1357–1359.
45. StaigerD, StockJH (1997) Instrumental variables regression with weak instruments. Econometrica 65 : 557–586.
46. Baum C, Schaffer M, Stillman S (2007) IVENDOG: Stata module to calculate Durbin-Wu-Hausman endogeneity test after ivreg. Statistical Software Components S494401. Boston: Boston College Department of Economics.
47. Davey SmithG, EbrahimS (2004) Mendelian randomization: prospects, potentials, and limitations. Int J Epidemiol 33 : 30–42.
48. Davey SmithG (2011) Use of genetic markers and gene-diet interactions for interrogating population-level causal influences of diet on health. Genes Nutr 6 : 27–43.
49. De MoorMH, LiuYJ, BoomsmaDI, LiJ, HamiltonJJ, et al. (2009) Genome-wide association study of exercise behavior in Dutch and American adults. Med Sci Sports Exerc 41 : 1887–1895.
50. KimJ, OhS, MinH, KimY, ParkT (2011) Practical issues in genome-wide association studies for physical activity. Ann N Y Acad Sci 1229 : 38–44.
51. EvansDM, VisscherPM, WrayNR (2009) Harnessing the information contained within genome-wide association studies to improve individual prediction of complex disease risk. Hum Mol Genet 18 : 3525–3531.
52. PurcellSM, WrayNR, StoneJL, VisscherPM, O'DonovanMC, et al. (2009) Common polygenic variation contributes to risk of schizophrenia and bipolar disorder. Nature 460 : 748–752.
53. de los CamposG, GianolaD, AllisonDB (2010) Predicting genetic predisposition in humans: the promise of whole-genome markers. Nat Rev Genet 11 : 880–886.
54. YangJ, BenyaminB, McEvoyBP, GordonS, HendersAK, et al. (2010) Common SNPs explain a large proportion of the heritability for human height. Nat Genet 42 : 565–569.
55. WrayNR, YangJ, HayesBJ, PriceAL, GoddardME, et al. (2013) Pitfalls of predicting complex traits from SNPs. Nat Rev Genet 14 : 507–515.
56. YangJ, LeeSH, GoddardME, VisscherPM (2011) GCTA: a tool for genome-wide complex trait analysis. Am J Hum Genet 88 : 76–82.
57. PurcellS, NealeB, Todd-BrownK, ThomasL, FerreiraMAR, et al. (2007) PLINK: a tool set for whole-genome association and population-based linkage analyses. Am J Hum Genet 81 : 559–575.
58. AngristJD, KruegerAB (1995) Split-sample instrumental variables estimates of the return to schooling. J Bus Econ Stat 13 : 225–235.
59. DerSimonianR, LairdN (1986) Meta-analysis in clinical trials. Control Clin Trials 7 : 177–188.
60. ColeTJ, BellizziMC, FlegalKM, DietzWH (2000) Establishing a standard definition for child overweight and obesity worldwide: international survey. BMJ 320 : 1240–1243.
61. TimpsonNJ, EmmettPM, FraylingTM, RogersI, HattersleyAT, et al. (2008) The fat mass - and obesity-associated locus and dietary intake in children. Am J Clin Nutr 88 : 971–978.
62. den HoedM, EkelundU, BrageS, GrontvedA, ZhaoJH, et al. (2010) Genetic susceptibility to obesity and related traits in childhood and adolescence: influence of loci identified by genome-wide association studies. Diabetes 59 : 2980–2988.
63. BradfieldJP, TaalHR, TimpsonNJ, ScheragA, LecoeurC, et al. (2012) A genome-wide association meta-analysis identifies new childhood obesity loci. Nat Genet 44 : 526–531.
64. KilpelainenTO, ZillikensMC, StancakovaA, FinucaneFM, RiedJS, et al. (2011) Genetic variation near IRS1 associates with reduced adiposity and an impaired metabolic profile. Nat Genet 43 : 753–760.
65. SallisJF, ProchaskaJJ, TaylorWC (2000) A review of correlates of physical activity of children and adolescents. Med Sci Sports Exerc 32 : 963–975.
66. SzendroediJ, RodenM (2008) Mitochondrial fitness and insulin sensitivity in humans. Diabetologia 51 : 2155–2167.
67. JanssenI, LeBlancAG (2010) Systematic review of the health benefits of physical activity and fitness in school-aged children and youth. Int J Behav Nutr Phys Act 7 : 40.
68. StrongWB, MalinaRM, BlimkieCJ, DanielsSR, DishmanRK, et al. (2005) Evidence based physical activity for school-age youth. J Pediatr 146 : 732–737.
69. LearySD, NessAR, Davey SmithG, MattocksC, DeereK, et al. (2008) Physical activity and blood pressure in childhood—findings from a population-based study. Hypertension 51 : 92–98.
70. EkelundU, BrageS, FrobergK, HarroM, AnderssenSA, et al. (2006) TV viewing and physical activity are independently associated with metabolic risk in children: the European Youth Heart Study. PLoS Med 3 : 2449–2457.
71. BrageS, WedderkoppN, EkelundU, FranksPW, WarehamNJ, et al. (2004) Objectively measured physical activity correlates with indices of insulin resistance in Danish children. the European Youth Heart Study (EYHS). Int J Obes 28 : 1503–1508.
72. AndersenLB, RiddochC, KriemlerS, HillsA (2011) Physical activity and cardiovascular risk factors in children. Br J Sports Med 45 : 871–876.
73. LukeA, DugasLR, Durazo-ArvizuRA, CaoGC, CooperRS (2011) Assessing physical activity and its relationship to cardiovascular risk factors: NHANES 2003–2006. BMC Public Health 11 : 387.
74. DeforcheB, HaerensL, de BourdeaudhuijI (2011) How to make overweight children exercise and follow the recommendations. Int J Pediatr Obes 6 : 35–41.
75. WesterterpKR, SpeakmanJR (2008) Physical activity energy expenditure has not declined since the 1980s and matches energy expenditures of wild mammals. Int J Obes (Lond) 32 : 1256–1263.
76. SwinburnB, SacksG, RavussinE (2009) Increased food energy supply is more than sufficient to explain the US epidemic of obesity. Am J Clin Nutr 90 : 1453–1456.
77. StubbeJH, BoomsmaDI, De GeusEJ (2005) Sports participation during adolescence: a shift from environmental to genetic factors. Med Sci Sports Exerc 37 : 563–570.
78. FranksPW, RavussinE, HansonRL, HarperIT, AllisonDB, et al. (2005) Habitual physical activity in children: the role of genes and the environment. Am J Clin Nutr 82 : 901–908.
79. FisherA, van JaarsveldCH, LlewellynCH, WardleJ (2010) Environmental influences on children's physical activity: quantitative estimates using a twin design. PLoS ONE 5: e10110.
Štítky
Interní lékařstvíČlánek vyšel v časopise
PLOS Medicine
2014 Číslo 3
- Srovnání vlivu omeprazolu a pantoprazolu na antiagregační účinek klopidogrelu
- Ivabradin zlepšuje kvalitu života starších pacientů se srdečním selháním
- Fixní kombinace kandesartan/amlodipin v terapii arteriální hypertenze
- Současné postavení a přínos sartanů v klinické praxi
- Prognostický význam hladiny natriuretických peptidů při léčbě empagliflozinem
Nejčtenější v tomto čísle
- and Water, Sanitation, and Hygiene: A Committed Relationship
- Representation and Misrepresentation of Scientific Evidence in Contemporary Tobacco Regulation: A Review of Tobacco Industry Submissions to the UK Government Consultation on Standardised Packaging
- The Impact of Pyrethroid Resistance on the Efficacy of Insecticide-Treated Bed Nets against African Anopheline Mosquitoes: Systematic Review and Meta-Analysis
- The Role of Viral Introductions in Sustaining Community-Based HIV Epidemics in Rural Uganda: Evidence from Spatial Clustering, Phylogenetics, and Egocentric Transmission Models
Zvyšte si kvalifikaci online z pohodlí domova
Mazová zátka a její řešení
nový kurzVšechny kurzy