
Neonatal Mortality Levels for 193 Countries in 2009 with Trends since 1990: A Systematic Analysis of Progress, Projections, and Priorities
Background:
Historically, the main focus of studies of childhood mortality has been the infant and under-five mortality rates. Neonatal mortality (deaths <28 days of age) has received limited attention, although such deaths account for about 41% of all child deaths. To better assess progress, we developed annual estimates for neonatal mortality rates (NMRs) and neonatal deaths for 193 countries for the period 1990–2009 with forecasts into the future.
Methods and Findings:
We compiled a database of mortality in neonates and children (<5 years) comprising 3,551 country-years of information. Reliable civil registration data from 1990 to 2009 were available for 38 countries. A statistical model was developed to estimate NMRs for the remaining 155 countries, 17 of which had no national data. Country consultation was undertaken to identify data inputs and review estimates. In 2009, an estimated 3.3 million babies died in the first month of life—compared with 4.6 million neonatal deaths in 1990—and more than half of all neonatal deaths occurred in five countries of the world (44% of global livebirths): India 27.8% (19.6% of global livebirths), Nigeria 7.2% (4.5%), Pakistan 6.9% (4.0%), China 6.4% (13.4%), and Democratic Republic of the Congo 4.6% (2.1%). Between 1990 and 2009, the global NMR declined by 28% from 33.2 deaths per 1,000 livebirths to 23.9. The proportion of child deaths that are in the neonatal period increased in all regions of the world, and globally is now 41%. While NMRs were halved in some regions of the world, Africa's NMR only dropped 17.6% (43.6 to 35.9).
Conclusions:
Neonatal mortality has declined in all world regions. Progress has been slowest in the regions with high NMRs. Global health programs need to address neonatal deaths more effectively if Millennium Development Goal 4 (two-thirds reduction in child mortality) is to be achieved.
: Please see later in the article for the Editors' Summary
Published in the journal:
. PLoS Med 8(8): e32767. doi:10.1371/journal.pmed.1001080
Category:
Research Article
doi:
https://doi.org/10.1371/journal.pmed.1001080
Summary
Background:
Historically, the main focus of studies of childhood mortality has been the infant and under-five mortality rates. Neonatal mortality (deaths <28 days of age) has received limited attention, although such deaths account for about 41% of all child deaths. To better assess progress, we developed annual estimates for neonatal mortality rates (NMRs) and neonatal deaths for 193 countries for the period 1990–2009 with forecasts into the future.
Methods and Findings:
We compiled a database of mortality in neonates and children (<5 years) comprising 3,551 country-years of information. Reliable civil registration data from 1990 to 2009 were available for 38 countries. A statistical model was developed to estimate NMRs for the remaining 155 countries, 17 of which had no national data. Country consultation was undertaken to identify data inputs and review estimates. In 2009, an estimated 3.3 million babies died in the first month of life—compared with 4.6 million neonatal deaths in 1990—and more than half of all neonatal deaths occurred in five countries of the world (44% of global livebirths): India 27.8% (19.6% of global livebirths), Nigeria 7.2% (4.5%), Pakistan 6.9% (4.0%), China 6.4% (13.4%), and Democratic Republic of the Congo 4.6% (2.1%). Between 1990 and 2009, the global NMR declined by 28% from 33.2 deaths per 1,000 livebirths to 23.9. The proportion of child deaths that are in the neonatal period increased in all regions of the world, and globally is now 41%. While NMRs were halved in some regions of the world, Africa's NMR only dropped 17.6% (43.6 to 35.9).
Conclusions:
Neonatal mortality has declined in all world regions. Progress has been slowest in the regions with high NMRs. Global health programs need to address neonatal deaths more effectively if Millennium Development Goal 4 (two-thirds reduction in child mortality) is to be achieved.
: Please see later in the article for the Editors' Summary
Introduction
The first 4 wk of life—the neonatal period—carries one of the highest risks of death of any 4-wk period in the human lifespan [1]. In high-income countries (HIC), neonates are now a major focus of child health both for mortality and morbidity reduction. However, in lower-income countries neonatal mortality rates (NMRs), trends, and causes have attracted relatively little attention compared to maternal deaths or deaths among older children under 5 and in international public health policy and programmes, neonatal deaths still do not receive attention commensurate with their burden [2]. A specific focus on neonatal mortality is required as the epidemiology, cause-of-death distribution, and health interventions differ to older children. Child survival programmes have typically focused on diseases affecting children aged over 1 mo—primarily pneumonia, malaria, diarrhoea, and vaccine-preventable diseases—and safe motherhood programmes have tended to focus on the mother and not her newborn [3].
The single most important factor behind increased attention for neonatal deaths is Millennium Development Goal (MDG) 4, which calls for a two-thirds reduction in mortality risks of children under 5 y of age between 1990 and 2015, equivalent to an average annual reduction of 4.4% [2]. The last few years have seen a welcome acceleration in progress towards this goal, but less attention has been paid to neonates and less progress made compared to older children under the age of 5. Hence neonatal deaths represent an increasing proportion of global under-five deaths [4],[5]. In 2005, The Lancet Neonatal Survival Series highlighted the annual toll of 4 million neonatal deaths, provided the first systematic estimates of neonatal deaths by cause [1], identified 16 simple and extremely cost-effective interventions that could reduce neonatal deaths by 67% [6], and proposed specific actions in countries [7] and globally [8].
One key action to increase attention and guide action is the availability of annual estimates by country of the NMR (the probability of dying in the first 28 d of life) [8],[9]; this remains a gap. United Nations (UN) partners, led by the World Health Organization (WHO), have produced maternal mortality ratio (MMR) estimates every 5 y [10]. Each year the UN Inter-agency Group for Child Mortality Estimation (IGME) produces national estimates of infant mortality rate (IMR) and under-five mortality rate (U5MR). The inputs, methodology, and determination of uncertainty bounds for these estimates have been improved over recent years (www.childinfo.org/mortality_igme.html). The sources of NMR data are very similar to those for under-five mortality and available in the same countries and with the same frequency, yet so far NMR estimates have not been part of this annual process, and publication of neonatal mortality estimates has been unpredictable in timing and used changing methods, which has limited trend analysis and reduced policy attention. For example, the recent 2010 Millennium Development Goals summit and multiple associated progress reports barely mentioned neonatal deaths [11].
During 2010, national and global estimates for both maternal [12],[13] and child mortality [14],[15] were published by both the UN and by the Institute of Health Metrics and Evaluation (IHME). Considerable debate ensued around the various inputs, methods, and estimates. IHME's child mortality publication and the associated media interest were primarily focused on under-five mortality, and national and regional estimates of NMR and neonatal deaths were provided for only 2 y, 1990 and 2010.
A recent series on global health estimates in PLoS [16] has highlighted many of the debates in global estimation, and lessons learned and proposed ways forward [17]–[21]. Given defects or deficiencies in existing empirical NMR data, statistical estimation will be necessary for most countries for the foreseeable future [18], and a key message is that countries, academics, and UN agencies have a role to play in improving the data and methods and in ensuring transparency.
In this article we build on these lessons to develop an improved modeling approach for national estimates of NMRs for the years 1990 to 2009 and for forecasts of future trends. Our work is linked to a wider collaboration between UN agencies and academic research groups to understand and estimate rates (www.childinfo.org/mortality_igme.html) and causes of deaths in neonates and children (Child Health Epidemiology Reference Group, www.cherg.org) in order to inform public health policy. In addition, a country consultation process was undertaken by WHO to maximize identification of all input data and to allow countries to review and provide feedback to estimates.
Methods
Ethics Statement
An ethics statement was not required for this work.
Data Identification and Inclusion
Data on neonatal mortality come from a variety of sources, including civil registration systems and household surveys such as Demographic and Health Surveys (DHS; www.measuredhs.com), as well as special studies. Box 1 presents an overview of challenges and limitations to data and neonatal mortality estimation.
Box 1. Challenges and Limitations to NMR Estimation
NMRs are highest in countries and communities with the least information on these deaths. This inverse relationship naturally leads to uncertainties in global, regional, and country estimates of NMRs.
The gold standard for mortality data collection is a high-coverage, high-quality civil registration system. We assessed that only 38 countries had a civil registration system of sufficient population coverage, quality, and completion for the period 1990–2009 to be used for neonatal mortality estimation, and censuses have typically only collected data that enable estimation of infant and under-five mortality rates, or have not asked or reported specifically on neonatal outcomes. Mortality data collection is often difficult in countries with ongoing or recent civil conflict or disaster—most often due to breakdown of collection systems or because data collection risks compromising the security of participants. In our study, the 17 countries that had no relevant, recent data of any kind include countries that have experienced recent civil unrest.
The most common data source globally for child and neonatal mortality is retrospective household surveys such as the DHS, which rely on birth histories and do report neonatal outcomes. The neonatal period has historically been granted little space and effort in data collection and analyses. UNICEF's Multiple Indicator Cluster Surveys (MICS) are an increasing source of national estimates for under-five mortality but usually rely on demographic indirect estimation techniques that have been developed to estimate mortality rates when exact information on times of births and deaths of children is missing, and usually do not provide estimates of NMRs. Some MICS have used birth histories and have reported NMR (Malawi and several of the central Asian Republics). If more MICS followed this lead then data on neonatal deaths would increase markedly.
For retrospective birth histories and incomplete civil registration systems, under-reporting of neonatal deaths is believed to be a bigger problem than under-reporting of deaths among older children. Neonatal deaths are less likely to be recorded if the baby dies in the first few hours or days after birth or is very small. Additionally, misclassification of stillbirths and early neonatal deaths is likely to occur [36]. There is an urgent need for research into the extent and frequency of possible under-reporting of neonatal deaths from retrospective surveys, ideally by comparing such data with prospective data for the same population within the same time period. Additionally asking for a pregnancy history would theoretically be superior to asking only for live births in terms of capture of early neonatal deaths and stillbirths.
We assessed all these different data sources and included those meeting our inclusion criteria, that is, reporting population-based data with neonatal deaths and under-five deaths with a denominator of livebirths. Although under-reporting of neonatal deaths is a concern even in middle - and high-income settings [22]–[24], we did not adjust neonatal mortality data points for under-reporting. To ensure consistency with U5MR estimates produced for the UN by IGME and to account for variation in survey-to-survey measurement errors, we rescaled U5MR and NMR data points for all years to match the latest time series estimates of U5MR produced by IGME [14]. On average, rescaled values were 9.7% higher than original observation values, with 38% of data points increasing in value, 18% decreasing, and the remaining data points (all from civil registration) being unchanged. This rescaling assumes that the proportionate difference in NMR and U5MR is equal for each data point.
A country consultation was undertaken by WHO between December 2010 and January 2011 to give the Ministry of Health in each of the 193 countries the opportunity to review all data inputs and NMR draft estimates for the years 1990, 2000, and 2009 for their country. No countries had comments on the NMR estimates themselves, but 18 countries provided a total of 19 additional data points—all civil registration data points for the years 2008 and 2009. The final database and results presented in this paper incorporate the additional data points from the country consultation process.
The final input database included 3,551 country-years with data from 176 countries representing all WHO regions. Civil registration and surveillance system data provided 2,378 data points, and household survey data 1,173 data points (of which 976 were from DHS) (Figure 1). The empirical dataset (original and with U5MRs and NMRs rescaled) can be found on the following Web site (www.who.int/healthinfo/statistics/mortality/en/).

Countries were classified by their income level as assessed in 2010 by the World Bank (World Bank List of Economies, July 2010, http://go.worldbank.org/K2CKM78CC0). Estimates of livebirths were taken from the World Population Prospects: The 2008 Revision [25]. Our regional grouping of countries is based on World Bank income-group and WHO region (Figure 2). Our analyses and results are presented by WHO region for low - and middle-income countries (LMICs), and separately for HICs. Equatorial Guinea is an exception to this rule being the only HIC in Africa. Given the similarity of Equatorial Guinea's NMR to those of other countries in Africa, Equatorial Guinea was grouped with the other countries in the WHO Africa region.

NMR Estimation by Country
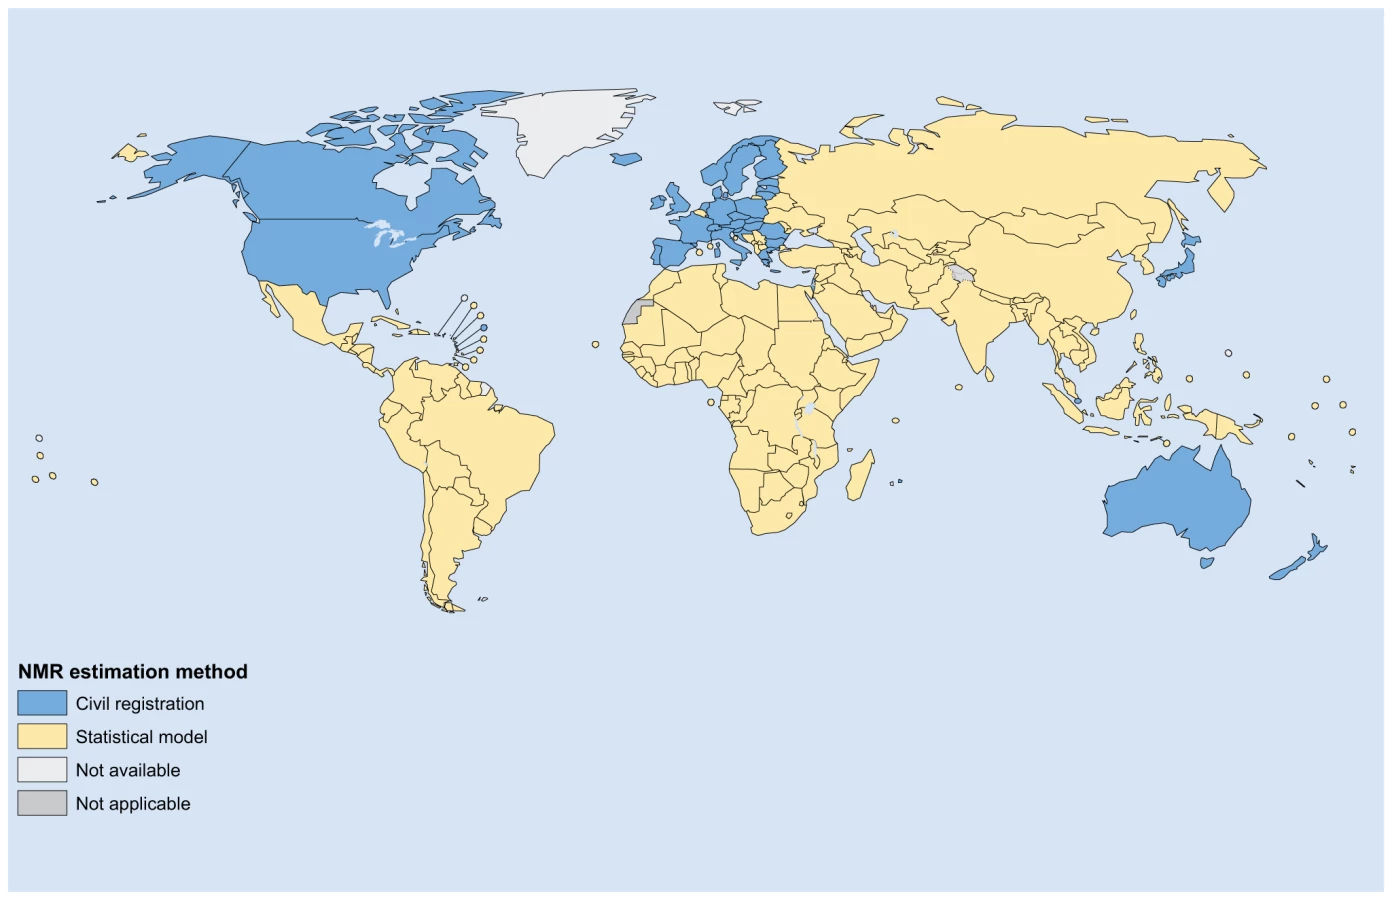
We used two methods to estimate country-specific NMRs, with the choice of method depending on the data available for each country. Figure 3 outlines which method was used for each country. Method 1 was used for 38 countries (8% of global livebirths in 2009), and method 2 for 155 countries (92% of global livebirths in 2009).
Method 1. Civil registration data
For countries with high-quality civil registration data covering at least 17 of the 20 y in the period 1990–2009, and with no more than two consecutive years without data, NMR estimates were taken directly from civil registration systems and rescaled by the same proportion as the IGME adjustment to U5MR as outlined above. Thus, we used the empirical ratios of NMR to U5MR, but IGME adjusted U5MR levels. High-quality civil registration was defined as follows: (a) 100% complete for adults [26] and (b) greater than 85% complete for children when comparing under-five mortality estimates from civil registration with estimates produced by IGME [14]. If there were no empirical data for a given year, we used data from the years closest to the year of estimate using the average of ratios of NMR to U5MR for surrounding years, or if the year of estimate was more recent than the year of data, the ratio of NMR to U5MR from the most recent year with empirical data.
Method 2. Statistical model (Figure 3)
For the remaining countries, a multilevel statistical model was developed and used to predict NMR. The statistical model selected was the best performing model from a series of potential statistical models evaluated by ten-fold cross-validation [27]. Cross-validation involves splitting the dataset randomly into ten equally sized subsets, and then for each of the subsets examining the prediction errors obtained when fitting a model to the other nine subsets. To minimize chance effects from splitting the dataset into subsets, ten-fold cross-validation was carried out five times. Prediction accuracy was assessed using two criteria: (a) the absolute difference between observed and predicted NMRs, and (b) the relative difference between observed and predicted NMRs. Text S1 lists cross-validation results. On the basis of the evaluation of model performance, only the most recent data point for each survey was included—reducing the number of country-years of observation from 3,551 to 2,648—and the final model was fitted to data from 1990 onwards only—which further reduced the dataset used to fit the final model from 2,648 to 1,388 observations. The 2007 study by Murray et al. [28] similarly concluded that inclusion of only the most recent data point for each survey improved the performance of their statistical model. It seems that the inclusion of older data points for each survey is more likely to add additional noise than additional useful information for the statistical modeling. This effect is likely due to greater measurement errors, and or greater recall or survival bias of data points further back in time in retrospective surveys.
The final model was as follows:where, for observation i, that is for each country-year of observation, αj[i] and αk[i] are country-level and region-level random effects, respectively, and εi is a random error term. Figure 4 illustrates our modeled relationship between U5MR and NMR as used to estimate NMR for method 2 countries. The country-level random effect was assumed to be zero when predicting for countries without country-specific input data meeting our inclusion criteria. Other statistical models evaluated included HIV/AIDS mortality rates and malaria prevalence as predictors, as these had been used as predictors in previous exercises conducted by WHO to estimate NMR [5].

Uncertainty Estimation by Country
To generate estimates of uncertainty for method 2 countries, we drew 1,000 bootstrap samples from the estimation dataset and repeated the estimation steps for each sample. The new NMR parameter estimates for each sample, including the estimate of the country - and region-specific random effects, were used to generate a new set of predictions. For countries not included in the bootstrap sample, and, thus, without an estimate of the country-specific random effect, we randomly generated a country-specific effect using the estimated between-country standard deviation for that country's region derived from the bootstrap sample. For Method 1 countries, we used the uncertainty range around U5MR to generate uncertainty estimates for NMR. Here, ratios of upper and lower uncertainty ranges of NMR to the NMR estimate were assumed to be the same as for U5MR. To obtain global and regional level estimates of uncertainty, we summed the data at global or regional level for each bootstrap prediction run. We used the 2.5th and 97.5th percentiles of the resulting distributions around the estimates as uncertainty range.
Trend Analysis of Neonatal Mortality Levels
We analysed trends of neonatal mortality using two indicators, the NMR and the absolute number of neonatal death. The two indicators measure or convey complementary information. NMR is an indication of the risk of neonatal death per livebirth, and as a risk measure is comparable across time and countries. The number of neonatal deaths depends on the NMR and the number of livebirths and is a useful measure of burden when comparing with other conditions. Both indicators are needed by public health policy-makers and health programmes to understand the scope of neonatal deaths in their country and, together with similar information on levels and causes of morbidity and mortality for other age groups, to prioritize public health interventions. Regional and global NMRs can be interpreted as mortality risk measures weighted by livebirths in individual countries. For example, NMR levels and trends in the Western Pacific LMIC region are largely driven by China, as the vast majority of annual livebirths in this region are in China, and, similarly, trends and levels in the Southeast Asia LMIC region are predominantly driven by India. We estimated absolute numbers of neonatal deaths using our estimated NMRs and livebirths for each country from 1990 onwards. Regional and global deaths and NMRs were also calculated. Forecasts for 2010 and onwards are based on average annual changes in NMR over the period 1999–2009, and assuming constant rates of change from 2009 onwards. To adequately consider neonatal deaths due to the Rwanda genocide, we assumed that 1/60 of the child deaths under five attributed to the genocide, as estimated by IGME [14], occurred in the neonatal period.
Results
Over the 20 y from 1990 to 2009, an estimated 79 million babies died in the first 4 wk of life. Of these, the vast majority (>98%) died in LMIC, with 31 million in Southeast Asian LMIC, and 21 million in African LMIC. There were 1 million deaths in HIC.
All regions of the world have seen reductions in NMR, but there are major regional variations in the estimated rate of reduction. Globally, the average NMR has fallen by more than a quarter over 20 y, from 33.2 to 23.9 per 1,000 livebirths, or an average of 1.7% per year. The biggest percentage reductions in NMR have been in European LMIC (down 49%), American LMIC (down 48%), and Western Pacific LMIC (down 48%) (see Tables 1, S1, S2, S3, S4; Figure S1, which have estimates and graphs for all countries and regions, including a summary of levels and trends across MDG regions). Southeast Asian LMIC had the highest NMR in 1990 (NMR = 46.9) but only the third highest in 2009 (30.7) after Eastern Mediterranean LMIC (31.1) and African LMIC (35.9). The two latter regions have seen the smallest reductions in NMR over the period, and are the only two regions with average annual reductions in NMR of less than 2%. The Africa LMIC region saw the smallest reduction in NMR, with a total reduction of only 17.6% (1.0% per year) between 1990 and 2009.

Over the period 1990–2009, regions fall into three broad categories in terms of NMR level (Figure 5): HICs have much lower NMR and fewer neonatal deaths compared to the rest of the world, currently accounting for 1.4% of annual global neonatal deaths. Yet these countries continue to see major relative reductions in NMR, from 6.0 to 3.6 per 1,000 livebirths between 1990 and 2009—a 40% reduction, and greater than the global average reduction. Among LMICs, there is a clear separation between the higher NMR regions of Africa, Eastern Mediterranean, and Southeast Asia (NMR range 30.7–35.9 in 2009) and the lower NMR regions of Western Pacific, Europe, and the Americas (NMR range 10.7–12.0 in 2009).

In 2009, an estimated 3.3 million babies died globally before reaching the age of 28 d compared with an estimated 4.6 million deaths in 1990 (Figure 5; Table 1), a reduction of 29% in annual deaths. The proportion of neonatal deaths that occurs in African LMIC is increasing. If trends from the 11-y period 1999–2009 continue, the African region will overtake Southeast Asian LMIC in 2010 as the region with most neonatal deaths. This reflects the slower annual reduction in NMR in Africa LMIC compared to other regions of the world (Table 1), and that Africa LMIC has seen a 39.2% increase in annual births between 1990 and 2009, whereas annual births have decreased for most other regions of the world (Table S4).
The proportion of child deaths that occur in the neonatal period has increased in all regions of the world; globally the proportion increased from 37% in 1990 to 41% in 2009 (Figure 5D). The regions with the largest relative increase in neonatal mortality compared to mortality in older children under five were European LMIC (39% to 50%), Southeast Asian LMIC (42% to 53%), and Western Pacific LMIC (44% to 54%).
Of the 40 countries with the highest NMRs in 2009 (see Figure 6), only six are from outside the African continent (Afghanistan, Pakistan, India, Bhutan, Myanmar, and Cambodia). Among the 15 countries with the highest NMRs (all above 39), 12 were from the African region (Democratic Republic of the Congo, Mali, Sierra Leone, Guinea-Bissau, Chad, Central African Republic, Burundi, Angola, Mauritania, Mozambique, Guinea, and Equatorial Guinea), and three were from the Eastern Mediterranean (Afghanistan, Somalia, and Pakistan). Throughout the period 1990–2009, India has been the country with largest number of neonatal deaths. In 2009, the five countries with most deaths accounted for more than half of all neonatal deaths (1.7 million deaths = 52%), and 44% of global livebirths: India (27.8% of deaths, 19.6% of global livebirths), Nigeria (7.2%, 4.5%), Pakistan (6.9%, 4.0%), China (6.4%, 13.4%), and Democratic Republic of the Congo (4.6%, 2.1%). The top five contributors to the 4.6 million neonatal deaths in 1990 were: India (29.5% of deaths, 19.8% of global livebirths), China (12.3%, 18.0%), Pakistan (5.4%, 3.4%), Bangladesh (5.0%, 2.9%), and Nigeria (4.8%, 3.3%). NMR estimates for each country can be found in Table S1.

In eight countries NMRs are estimated to have increased over the 20 y of study, and five of these countries are in Africa (Nauru, Congo, Zimbabwe, Niue, Chad, Cameroon, Trinidad and Tobago, and South Africa), and NMRs are unchanged over the 20 y for the Democratic Republic of Congo and Somalia. These trends in NMRs between 1990 and 2009 are a result of U5MR being estimated by IGME to have been increasing or been constant over the period, respectively (Figure 7). Of the ten countries with the greatest relative reductions in NMR (all saw reductions of more than 68%), eight were HIC (San Marino, Luxembourg, Czech Republic, Estonia, Cyprus, Singapore, Greece, and Oman), one a Southeast Asian LMIC (Maldives), and one a European LMIC (Serbia). When interpreting NMR trends for countries with small numbers of annual livebirths the low number of livebirths makes the estimation of an underlying true population NMR less certain.

Discussion
This analysis is the first published set, to our knowledge, of national annual time series for neonatal deaths for all the countries of the world, involving country consultation, with forecasts, and with a presentation and discussion of country and regional levels and trends. The input database is extensive and the modeling methods have been improved over previous exercises by UN agencies [5], yet uncertainty remains wide and may not fully capture remaining issues around underestimation and misclassification of neonatal deaths and stillbirths. Because of the lack of evidence and understanding of the frequency and extent of possible under-reporting of neonatal deaths across data sources (see Box 1), we have not attempted to adjust input data for possible under-reporting, as is routinely done by many other global health estimates [10]. Instead, we rescaled NMR and U5MR input data to match U5MR estimates produced by IGME. This rescaling assumes that the proportionate difference in NMR and U5MR is equal for each data point. However, it is believed that under-reporting of neonatal deaths is greater than for older children in retrospective mortality data collection systems, especially household surveys which may ask about births in the previous 5 y (see Box 1), which consequently would make our estimates of neonatal deaths conservative.
As the risk of children dying before the age of five has fallen, the proportion of child deaths that occur in the neonatal period has increased. This increase is primarily a consequence of decreasing non-neonatal mortality in children under five from infectious diseases such as measles, pneumonia, diarrhea, malaria, and AIDS. Globally, 41% of under-five deaths now occur in the neonatal period. Over the 20 y between 1990 and 2009, the proportion of global neonatal deaths that occurred in Africa increased. Although Africa is now the region with the highest NMR, the proportion of under-five child deaths that are neonatal remains relatively low in Africa—the fraction increased from 26% to 29% between 1990 and 2009. This apparent anomaly reflects the fact that Africa accounts for approximately 90% of child deaths due to malaria (0.7 million under-five deaths) and HIV/AIDS (0.2 million under-five deaths) [4], resulting in relatively higher post-neonatal child mortality than other regions.
Globally, the average annual reduction in NMR appears to be accelerating and was twice as high for the period 1999–2009 (2.3%) compared to that experienced in the period 1990–1999 (1.1%). Only HIC experienced lower average reduction in NMR in the period 1999–2009 (1.7%) compared to that experienced in the period 1990–1999 (3.7%), which may reflect the challenge of reducing mortality in very preterm babies. However, while progress appears to be increasing, the average annual rate of NMR reduction is well below the MDG-4 goal (of 4.4%) at 1.7% per year globally in the period 1990–2009, and less than for under-five mortality at 2.1% per year in the same period [14] and maternal mortality over the period 1990–2008 at 2.3% per year [12].
If trends for NMR and U5MR from the period 1999–2009 continue, the risk of dying within the first 4 wk of life in Africa will match the current risk in HIC by the year 2166 (Figure 8). Although this forecast is simplistic as it assumes that the average annual rate of reduction in Africa experienced between 1999 and 2009 will remain constant over the next 160 y in Africa (see Figure 8), it highlights the very high current NMR levels in Africa and the very slow progress in NMR reduction compared to other regions of the world, particularly to HIC.

The trend and numbers in Western Pacific LMIC are predominantly driven by China—e.g., in 2009, the proportions of livebirths and neonatal deaths in the region that occurred in China were 78% and 74%, respectively. In the period 1993–1998, China appears to have experienced relatively large fluctuations in the age distribution of child deaths aged less than five (Figure 5). The Chinese Maternal and Child Health Surveillance System (MCHSS) used in the neonatal mortality estimation makes use of trained female health workers or village doctors to register child births and deaths in villages and communities, and is believed to be nationally representative and of relatively high quality [29]. However, we excluded data from MCHSS prior to 1999 because of uncertainty about the quality of data [29], and used the statistical model to predict NMRs for China for the whole time period, 1990–2009. The number of non-neonatal deaths in children under five decreased markedly in the period 1993–1998, whereas the number of neonatal deaths was relatively constant, as were both neonatal and under-five mortality rates. The observed fluctuation in the age distribution of child deaths in China between 1993 and 1998 appear to be predominantly driven by changes in the population of children under five, as estimated by the United Nations Population Division (see Figure S2), which we used to estimate child deaths under five.
In our statistical model, the only predictor of NMR that can change over time is U5MR. Our model allows for a nonlinear association between NMR and U5MR on a logarithmic scale, and for the ratio of NMR to U5MR to vary depending on U5MR, country, and region (see Methods, Figure 4 in particular). The Preliminary Report for the Malawi DHS 2010 survey was recently released [30], and estimated a NMR of 31 for the 5-y period 2005–2010, that is with midpoint years 2007 and 2008. The survey was not included in our input data used to develop our statistical model, as it was not available at the time, but can be used as a post hoc exploration of the performance of our statistical model. Using our statistical model, we estimated NMR to be 31.5 (29.0–35.7) in 2007 and 30.5 (28.0–34.6) in 2008, which agrees closely with the preliminary survey estimate, and, thus, suggests that our statistical model is performing well, at least for recent years' trend in this African country.
In 2010, Rajaratnam et al. published NMR time series as part of their systematic evaluation of trends and levels of child mortality [15]. Figures S3, S4, S5, S6 present a detailed comparison of estimates at country, regional, and global levels in the period 1990–2009, including Bland-Altman plots for each year with the relative difference plotted as a function of the average of the two estimates for each country. Our estimation process differs from that of Rajaratnam et al. in a number of ways: we carried out a country consultation, which allowed countries to review data inputs and estimates and provide us with their feedback; (a) we used more recent data, primarily as our estimates were finalized 2 y later, which allowed us to better predict current and recent years' NMRs (assuming same methods are used); (b) our focus is on neonatal mortality levels and trends, whereas Rajaratnam et al. focused on child mortality under five. However, from a statistical modeling perspective, both approaches use a multilevel modeling approach with U5MR as the main predictor of NMR, together with country and regional information. The main differences to our methods are that Rajaratnam et al. allowed slope coefficients to vary by country and region, that Rajaratnam et al. made use of their own estimated U5MR time series, and in that Rajaratnam et al. predict NMR separately for the two sexes. Rajaratnam et al. furthermore do a joint decomposition of the U5MR into the age groups neonatal, postneonatal (1–11 mo), and child (12–59 mo). This approach requires each observation in the data base to have information on all three rates (assuming data imputation is not carried out), which most likely explains why their data base for NMR modeling has half the number of observations of ours. Generally, the two sets of NMR time series are in close agreement. At global and regional levels relative differences are for most years on the order of ±5% and ±10%, respectively, which are well inside the uncertainty range of the estimates. For most countries, relative differences between NMR estimates are within ±25% for most years. For example, the number of countries with differences greater than ±25% are 44 for year 2009 (24%) and 34 for year 1990 (18%).
The most recent systematic evaluation of child causes of deaths is for year 2008 [4]. Major causes of neonatal deaths globally in 2008 were estimated to be complications from preterm delivery (29%), asphyxia (23%), and infections with sepsis and pneumonia as the major causes contributing a combined 25% of neonatal deaths [4]. Countries with lower NMR typically had higher proportions of neonatal deaths caused by preterm delivery complications and congenital anomalies [4], and those with high mortality have around half of neonatal deaths due to infections, which are eminently preventable or treatable [1].
Conclusion
In the absence of regular, reliable civil registration data from 92% of the world's births, modeling is necessary for public health policy and priority setting. However, until national data collection systems and surveys improve the measurement of neonatal deaths and also stillbirths [31], considerable uncertainty around both these mortality rates and progress in reducing them will remain. More investment is required to improve and establish the quality of pregnancy outcome data especially in retrospective surveys [32]. Regular annual reporting of NMR through the UN system should become the norm, as is the case for under-five mortality rates.
Our findings highlight inter-regional variation in progress but also remarkable variation between countries in the same region. More evaluation is required to understand this variation in progress and better understanding of the underlying reasons would be critical in accelerating progress for neighboring countries.
The relative contribution of neonatal deaths to child deaths is expected to increase into the future. Progress in reducing neonatal mortality risk over the last 20 y has been slow, particularly in regions with the greatest risk. National governments, international organizations, nongovernmental organizations, and other international health bodies must increase investment in care at birth and the first few weeks of life within existing health programs, adding targeted interventions especially at the time of birth [33]. The majority of neonatal deaths could be prevented with existing interventions including some that can be delivered at community level with potential to reduce neonatal deaths by one-third, such as improved hygiene at birth, breastfeeding, and simple approaches to keeping babies warm [6]. Maternal health programs and child health programs are beginning to place greater emphasis on newborn survival, but major missed opportunities remain even in existing programs [34]—for example midwives who are not trained and equipped for simple newborn care and neonatal resuscitation [35]. Many of the 79 million babies who died in the neonatal period since 1990 were born with little or no access to health services and in settings with little health information to drive health system improvement. If MDG-4 is to be achieved, and this needless loss of life prevented, it is essential that national governments, international agencies, and civil society increase attention to systematically preventing and tracking neonatal deaths [9].
Supporting Information
Zdroje
1. LawnJECousensSZupanJ 2005 4 million neonatal deaths: when? Where? Why? Lancet 365 891 900
2. ShiffmanJ 2010 Issue attention in global health: the case of newborn survival. Lancet 375 2045 2049
3. TinkerAten Hoope-BenderPAzfarSBustreoFBellR 2005 A continuum of care to save newborn lives. Lancet 365 822 825
4. BlackRECousensSJohnsonHLLawnJERudanI 2010 Global, regional, and national causes of child mortality in 2008: a systematic analysis. Lancet 375 1969 1987
5. ZupanJAahmanE 2005 Perinatal mortality for the year 2000: estimates developed by the WHO Geneva WHO
6. DarmstadtGLBhuttaZACousensSAdamTWalkerN 2005 Evidence-based, cost-effective interventions: how many newborn babies can we save? Lancet 365 977 988
7. KnippenbergRLawnJEDarmstadtGLBegkoyianGFogstadH 2005 Systematic scaling up of neonatal care in countries. Lancet 365 1087 1098
8. MartinesJPaulVKBhuttaZAKoblinskyMSoucatA 2005 Neonatal survival: a call for action. Lancet 365 1189 1197
9. LawnJECousensSNDarmstadtGLBhuttaZAMartinesJ 2006 1 year after The Lancet Neonatal Survival Series—was the call for action heard? Lancet 367 1541 1547
10. HillKThomasKAbouZahrCWalkerNSayL 2007 Estimates of maternal mortality worldwide between 1990 and 2005: an assessment of available data. Lancet 370 1311 1319
11. United Nations 2010 The Millennium Development Goals Report 2010 New York United Nations
12. 2010 Trends in maternal mortality: 1990 to 2008. Estimates developed by WHO, UNICEF, UNFPA and The World Bank Geneva WHO
13. HoganMCForemanKJNaghaviMAhnSYWangM 2010 Maternal mortality for 181 countries, 1980–2008: a systematic analysis of progress towards Millennium Development Goal 5. Lancet 375 1609 1623
14. YouDJonesGHillKWardlawTChopraM 2010 Levels and trends in child mortality, 1990–2009. Lancet 376 931 933
15. RajaratnamJKMarcusJRFlaxmanADWangHLevin-RectorA 2010 Neonatal, postneonatal, childhood, and under-5 mortality for 187 countries, 1970–2010: a systematic analysis of progress towards Millennium Development Goal 4. Lancet 375 1988 2008
16. Editorial 2010 Can we count on global health estimates. PLoS Medicine 7 e1001002 doi:10.1371/journal.pmed.1001002
17. BoermaTJMathersCAbou-ZahrC 2010 WHO and global health monitoring: the way forward. PLoS Medicine 7 e1000373 doi:10.1371/journal.pmed.1000373
18. ByassP 2010 The imperfect world of global health estimates. PLOS Medicine 7 e1001006 doi:10.1371/journal.pmed.1001006
19. MurrayCJLLopezAD 2010 Production and analysis of health indicators: the role of academia. PLoS Medicine 7 e1001004 doi:10.1371/journal.pmed.1001004
20. GrahamWJAdjeiS 2010 A call for responsible estimation of global health. PLoS Medicine 7 e1001003 doi:10.1371/journal.pmed.1001003
21. SankohO 2010 Global health estimates: stronger collaboration needed with low - and middle-income countries. PLoS Medicine 7 e1001005 doi:10.1371/journal.pmed.1001005
22. McCarthyBJTerryJRochatRWQuaveSTylerCWJr 1980 The underregistration of neonatal deaths: Georgia 1974–77. Am J Pub Health 70 977
23. LumbiganonPPanamontaMLaopaiboonMPothinamSPatithatN 1990 Why are Thai official perinatal and infant mortality rates so low? Int J Epidemiol 19 997
24. BangAReddyMHDeshmukhMD 2002 Child mortality in Maharashtra. Econ Polit Weekly 4947 4965
25. United Nations Population Division (nd) World Population Prospects: The 2008 Revision New York United Nations
26. MathersCDMa FatDInoueMChalapatiRLopezAD 2005 Counting the dead and what they died from: an assessment of the global status of cause of death data. B World Health Organ 83 171 177
27. HastieTTibshiraniRFriedmanJ 2010 The elements of statistical learning: data mining, inference, and prediction. 2nd edition New York Springer
28. MurrayCJLLaaksoTShibuyaKHillKLopezAD 2007 Can we achieve Millennium Development Goal 4? New analysis of country trends and forecasts of under-5 mortality to 2015. Lancet 370 1040 1054
29. RudanIChanKYZhangJSFTheodoratouEFengXL 2010 Causes of deaths in children younger than 5 years in China in 2008. Lancet 375 1083 1089
30. Measure DHS ICF Macro 2011 Malawi demographic and health survey 2010. Preliminary report Calverton (Maryland) ICF Macro
31. LawnJEBlencoweHPattinsonRCousensSKumarR 2011 Stillbirths: where? When? Why? How to make the data count. Lancet 377 1448 1463
32. LawnJEGravettMGNunesTMRubensCEStantonC 2010 Global report on preterm birth and stillbirth (1 of 7): definitions, description of the burden and opportunities to improve data. BMC Pregnancy Childbirth 10 Suppl 1 S1
33. LawnJEKinneyMLeeACCChopraMDonnayF 2009 Reducing intrapartum-related deaths and disability: can the health system deliver? Int J Gynaecol Obstet 107 S123 S142
34. LawnJKerberK 2006 Opportunities for Africa's newborns: practical data, policy and programmatic support for newborn care in Africa Geneva WHO on behalf of Partnership for Maternal, Newborn and Child Health (PMNCH)
35. WallSNLeeACCNiermeyerSEnglishMKeenanWJ 2009 Neonatal resuscitation in low-resource settings: what, who, and how to overcome challenges to scale up? Int J Gynaecol Obstet 107 S47 S62, S63–S64
36. HillKChoiY 2006 Neonatal mortality in the developing world. Demographic research 14 429 452
Štítky
Interní lékařstvíČlánek vyšel v časopise
PLOS Medicine
2011 Číslo 8
- Využití HemaGelu při hojení ran v RVmedCentru privátní klinice s. r. o., zabývající se estetickou a laserovou chirurgií hlavy a krku, ušním, nosním, krčním a korektivní dermatologií
- Současnost a budoucnost péče o rány
- PPI nezvyšují riziko kardiovaskulárních příhod u pacientů užívajících ASA v antiagregační terapii
- U pacientů s traumatem je častěji dosaženo adekvátních hladin anti-Xa při dávkování enoxaparinu podle hmotnosti
- Souhrn českých doporučení pro diagnostiku a léčbu schizofrenie u dětí a dospívajících 2022
Nejčtenější v tomto čísle
- Commercial Serological Tests for the Diagnosis of Active Pulmonary and Extrapulmonary Tuberculosis: An Updated Systematic Review and Meta-Analysis
- Are HIV Epidemics among Men Who Have Sex with Men Emerging in the Middle East and North Africa?: A Systematic Review and Data Synthesis
- Government Inaction on Ratings and Government Subsidies to the US Film Industry Help Promote Youth Smoking
- Serological Testing Versus Other Strategies for Diagnosis of Active Tuberculosis in India: A Cost-Effectiveness Analysis
Zvyšte si kvalifikaci online z pohodlí domova
Mazová zátka a její řešení
nový kurzVšechny kurzy