
Use of DNA–Damaging Agents and RNA Pooling to Assess Expression Profiles Associated with and Mutation Status in Familial Breast Cancer Patients
A large number of rare sequence variants of unknown clinical significance have been identified in the breast cancer susceptibility genes, BRCA1 and BRCA2. Laboratory-based methods that can distinguish between carriers of pathogenic mutations and non-carriers are likely to have utility for the classification of these sequence variants. To identify predictors of pathogenic mutation status in familial breast cancer patients, we explored the use of gene expression arrays to assess the effect of two DNA–damaging agents (irradiation and mitomycin C) on cellular response in relation to BRCA1 and BRCA2 mutation status. A range of regimes was used to treat 27 lymphoblastoid cell-lines (LCLs) derived from affected women in high-risk breast cancer families (nine BRCA1, nine BRCA2, and nine non-BRCA1/2 or BRCAX individuals) and nine LCLs from healthy individuals. Using an RNA–pooling strategy, we found that treating LCLs with 1.2 µM mitomycin C and measuring the gene expression profiles 1 hour post-treatment had the greatest potential to discriminate BRCA1, BRCA2, and BRCAX mutation status. A classifier was built using the expression profile of nine QRT–PCR validated genes that were associated with BRCA1, BRCA2, and BRCAX status in RNA pools. These nine genes could distinguish BRCA1 from BRCA2 carriers with 83% accuracy in individual samples, but three-way analysis for BRCA1, BRCA2, and BRCAX had a maximum of 59% prediction accuracy. Our results suggest that, compared to BRCA1 and BRCA2 mutation carriers, non-BRCA1/2 (BRCAX) individuals are genetically heterogeneous. This study also demonstrates the effectiveness of RNA pools to compare the expression profiles of cell-lines from BRCA1, BRCA2, and BRCAX cases after treatment with irradiation and mitomycin C as a method to prioritize treatment regimes for detailed downstream expression analysis.
Published in the journal:
. PLoS Genet 6(2): e32767. doi:10.1371/journal.pgen.1000850
Category:
Research Article
doi:
https://doi.org/10.1371/journal.pgen.1000850
Summary
A large number of rare sequence variants of unknown clinical significance have been identified in the breast cancer susceptibility genes, BRCA1 and BRCA2. Laboratory-based methods that can distinguish between carriers of pathogenic mutations and non-carriers are likely to have utility for the classification of these sequence variants. To identify predictors of pathogenic mutation status in familial breast cancer patients, we explored the use of gene expression arrays to assess the effect of two DNA–damaging agents (irradiation and mitomycin C) on cellular response in relation to BRCA1 and BRCA2 mutation status. A range of regimes was used to treat 27 lymphoblastoid cell-lines (LCLs) derived from affected women in high-risk breast cancer families (nine BRCA1, nine BRCA2, and nine non-BRCA1/2 or BRCAX individuals) and nine LCLs from healthy individuals. Using an RNA–pooling strategy, we found that treating LCLs with 1.2 µM mitomycin C and measuring the gene expression profiles 1 hour post-treatment had the greatest potential to discriminate BRCA1, BRCA2, and BRCAX mutation status. A classifier was built using the expression profile of nine QRT–PCR validated genes that were associated with BRCA1, BRCA2, and BRCAX status in RNA pools. These nine genes could distinguish BRCA1 from BRCA2 carriers with 83% accuracy in individual samples, but three-way analysis for BRCA1, BRCA2, and BRCAX had a maximum of 59% prediction accuracy. Our results suggest that, compared to BRCA1 and BRCA2 mutation carriers, non-BRCA1/2 (BRCAX) individuals are genetically heterogeneous. This study also demonstrates the effectiveness of RNA pools to compare the expression profiles of cell-lines from BRCA1, BRCA2, and BRCAX cases after treatment with irradiation and mitomycin C as a method to prioritize treatment regimes for detailed downstream expression analysis.
Introduction
Rare sequence variants in BRCA1 and BRCA2 that are not predicted to lead to obvious or easily detectable molecular aberrations, such as protein truncation or RNA splicing defects, are currently difficult to classify clinically as pathogenic or neutral. These variants attribute to approximately 10% of clinical test results, and create a significant challenge for counseling and clinical decision making when identified in patients with a strong family history of breast cancer. Laboratory based methods that can distinguish between carriers of known pathogenic mutations and non-carriers are likely to have utility for the classification of sequence variants of unknown clinical significance.
Expression profiling has been used successfully to characterize molecular subtypes in breast cancer whether based on gene expression patterns in primary tumor cells [1]–[3], metastatic cells [4], or stroma-derived cells [5]. Distinctive patterns of global gene expression have also been shown between breast tumors with BRCA1 mutations and breast tumors with BRCA2 mutations [6]. More recently, evidence has been presented from several studies to suggest that heterozygous carriers of BRCA1 and BRCA2 mutations, and breast cancer patients without such alterations may be distinguished based on mRNA profiling of fibroblasts and lymphoblastoid cell-lines (LCLs) [7]–[9]. In one study, short-term breast fibroblast cell-lines were established from nine individuals with a BRCA1 germ-line mutation, and five healthy control individuals with no personal or family history of breast cancer [7]. Class prediction analysis using expression data from irradiated fibroblast cultures showed that BRCA1 carriers could be distinguished from controls with 85% accuracy [7]. A similar study used short-term fibroblast cultures from skin biopsies from 10 BRCA1 and 10 BRCA2 mutation carriers and 10 individuals who had previously had breast cancer but were unlikely to contain BRCA1/2 mutations [8]. Class prediction analysis using expression data from irradiated fibroblast cultures showed that BRCA1 and BRCA2 samples could be classified with 95% accuracy, and BRCA1/2 carriers could be distinguished from noncarriers with 90% to 100% accuracy [8].
In contrast to short-term fibroblast cell-lines, lymphoblastoid cell-lines (LCLs) are a minimally invasive source of germline material that can be maintained as long term culture, and which have proven to be a valuable model system for studying gene expression signatures in relation to genetic variation and external stimulants [10]–[13]. A recent study from our laboratory utilizing this model system suggested that post-irradiation (IR) gene expression data from LCLs derived from blood of patients with sequence alterations in BRCA1 and BRCA2, and from familial breast cancer patients without such alterations (BRCAX) has potential to predict BRCA1, BRCA2 and BRCAX mutation status with up to 62% accuracy [9]. In view of improving prediction accuracy, especially between BRCA1 and BRCA2, we used expression arrays to assess the effect of the DNA damaging agents, IR and mitomycin C (MMC), at different time points, on cellular response in relation to mutation status. To facilitate analysis of the large number of treated LCLs, an RNA pooling strategy was implemented to reduce the number of microarray experiments by three-fold. Previous studies have used RNA pooling as a strategy to reduce the effects of biological variation in order to help identify key features that differ between biological class [14],[15]. We have therefore explored a similar approach in this study using patient derived LCLs as well as prior knowledge that LCL expression profiles are influenced by both genotype and exogenous factors. This strategy was shown to be effective in identifying genes dysregulated in response to DNA damaging agents. This study also demonstrated the effectiveness of RNA pools to compare the effect of various IR and MMC treatment regimes on the mRNA expression profiles of LCLs derived from BRCA1, BRCA2 and BRCAX cases for downstream detailed analysis of individual samples.
Results
Effect of IR and MMC on global gene expression
To identify which treatment caused the greatest amount of change in gene expression levels, we first determined the number of genes that showed differential expression between pools for each treatment, particularly for BRCA1 versus BRCA2 and BRCA1 versus BRCAX (Figure 1). Using fold-change as a measure of differential gene expression revealed that the number of genes differentially expressed (>2-fold) between BRCA1, BRCA2 and BRCAX pools after IR was similar to that shown by the untreated controls (Figure 1A). However, significant differences in the expression of genes acting in the IR-induced ATM signaling pathway was observed between irradiated LCL pools compared to untreated pools (Figure S1), confirming inducement of an expression phenotype by IR. Of the four MMC treatments, the number of genes differentially expressed between pools was greatest when LCLs were treated with 1.2 µM MMC and the RNA isolated 1 hour post-treatment (Figure 1A). There is currently no canonical or consensus pathway based on MMC activity. It was therefore not possible to confirm the effects of this treatment by assessing expression phenotypes.

Identifying which treatment produced expression change in the greatest number of genes was also carried out by performing an F-test separately for each gene and determining the number of genes differentially expressed with significance levels set at 0.05 and 0.01 (Figure 1B). LCLs treated with MMC showed the greatest expression change after 1 hour incubation, with a slightly bigger effect associated with 1.2 µM MMC versus 0.4 µM MMC, thus suggesting that MMC has a greater perturbation effect after the shorter incubation period (Figure 1B). A similar trend in the number of genes differentially expressed between classes was observed when the significance level was set at 0.001 (Data not shown). Overall, these results indicated that, of the treatments used, 1.2 µM MMC(T60) was most likely to induce gene expression profiles that differ significantly between BRCA1, BRCA2 and BRCAX LCLs.
Identification of MMC responsive genes that discriminate BRCA1, BRCA2, and BRCAX mutation type
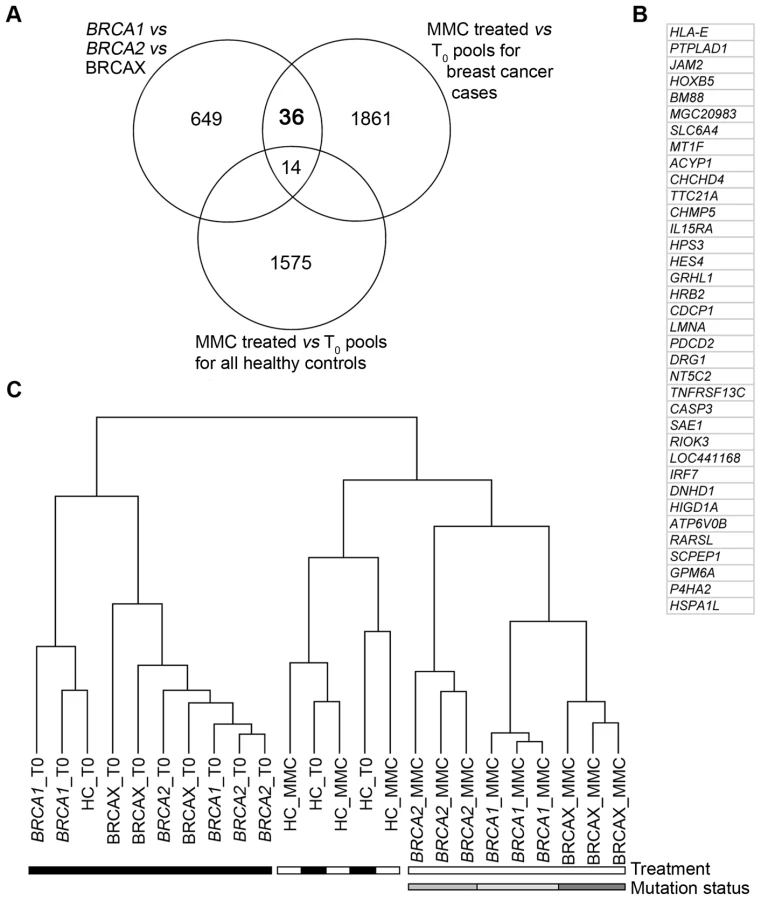
To identify genes that would discriminate pools based on mutation status, three comparative analyses were performed to achieve three objectives. The first objective was to identify genes that were differentially expressed between BRCA1, BRCA2 and BRCAX pools treated with 1.2 µM MMC(T60). This analysis identified 699 genes that are able to discriminate pools based on mutation status (Figure 2A, Table S1). The second objective was to identify genes that were differentially expressed between treated 1.2 µM MMC(T60) and non-treated BRCA1, BRCA2 and BRCAX pools. The 1911 genes identified from this analysis were then characterized as MMC responsive (Figure 2A, Table S1). Combining these two analyses revealed 50 genes that classified pools based on mutation status and that are also MMC responsive (Figure 2A). The third objective was to identify genes that were differentially expressed between treated (1.2 µM MMC(T60)) and non-treated healthy control pools. This analysis was important to identify genes that are MMC responsive in healthy controls and therefore not specific for mutation status in BRCA1, BRCA2 and BRCAX pools (Figure 2A, Table S1). By combining the results of these three analyses, 36 genes were identified that are differentially expressed between BRCA1, BRCA2 and BRCAX pools, and are also MMC responsive in affected carrier pools but not in healthy controls (Figure 2A and 2B). As expected, supervised hierarchical clustering of 1.2 µM MMC(T60) treated and non-treated pools using the 36-gene list demonstrates a separation of treated pools based on mutation type, but no separation by mutation type was observed in untreated pools (Figure 2C). Likewise, there was no discrimination of treated and untreated healthy control pools (Figure 2C).
QRT-PCR was carried out to validate the expression levels of the 36 MMC responsive genes in the BRCA1, BRCA2, and BRCAX derived RNA pools. Despite relatively small fold-changes detected in pools for each of the 36 genes between the three mutation groups, 15 genes were validated by QRT-PCR (Table 1); three times more than that expected by chance.

Of these 15 genes, nine also showed high correlation (r>0.6) in expression level between microarray and the QRT-PCR value of the same RNA pools (Table 1). These nine MMC responsive genes were therefore selected for class prediction tests.
Comparison of RNA pools and virtual pools
To explore potential technical variation associated with generating RNA pools, we compared expression levels of the nine MMC responsive genes, measured by microarray and QRT-PCR analysis in the nine RNA pools, and by QRT-PCR in the 27 individual LCL samples. Virtual pools were also generated by taking the average of QRT-PCR expression values from the individual samples used in the pools. Figure 3 shows that the coefficient of variation (CV) differed between the nine genes regardless of the experiment strategy. The least amount of variation from measured gene expression tended to be observed after microarray analysis of RNA pools with the CV ranging from 0.05 to 0.49 for the nine validated genes (Figure 3). In contrast, the greatest amount of variation from measured gene expression tended to be observed after QRT-PCR analysis of individual RNA samples with the CV of the same genes ranging from 0.33 to 1.11 (Figure 3). Similar gene expression variation was observed between RNA pools (CV ranged from 0.16 to 0.76) and virtual pools (CV ranged from 0.16 to 0.78), with the exception of FAM26F (Figure 3). Moreover, the correlation of expression data between the RNA pools and virtual pools was greater than 0.7 for seven of the nine genes analyzed (Table S2). These results suggest that although pooling reduces measured variation in expression levels, this reduction is most likely the result of a biological averaging effect and not technical issues relating to the different steps involved in the microarray experiment.

Class prediction of BRCA1, BRCA2, and BRCAX mutation status using nine MMC responsive genes
We utilized five different prediction methods (Diagonal Linear Discriminant Analysis, 1-Nearest Neighbour and Nearest Centroid classification, Support Vector Machines, and Compound Covariate Predictor) to determine the accuracy of using the nine MMC responsive genes to predict the three biological classes (BRCA1 truncation mutation, BRCA2 truncation mutation, and BRCAX) by means of a three-way comparison (Details shown in Table S3, S4). If the nine genes selected for classification are related to MMC response pathways we would predict better predictions for MMC treated groups compared to non-treated and IR treated group. Interestingly, BRCA1, BRCA2 and BRCAX pools were poorly classified from the IR(T60) (44%–78%) and T0 (33%–56%) treatments groups compared to the four MMC treated groups (67%–100%) using microarray data from the nine MMC responsive genes (Table S5). Results from the class prediction analysis of 1.2 µM MMC(T60) treated pools and individual samples are shown in Table 2. Not surprisingly, the highest accuracy (67%–100%) for predicting BRCA1, BRCA2 and BRCAX mutation status of pools was achieved using microarray data (Table 2). By comparison, performing the same analysis on BRCA1, BRCA2 and BRCAX pools using QRT-PCR derived expression data achieved an accuracy of 56%-78% in predicting mutation type for each of the pooled RNAs (Table 2).

Prediction analysis with QRT-PCR data from the 27 individual LCL samples used to derive the nine BRCA1, BRCA2, and BRCAX associated pools correctly classified the individual samples with up to 59% accuracy using the NC model (Table 2). Similar to the results shown using QRT-PCR data from the RNA pools, classification of the virtual pools was typically lower than that seen with the microarray data but higher than that achieved when analyzing the individual samples (Table 2). In addition to the three-way comparison, we also performed a series of two-way comparisons to explore the accuracy of the nine MMC responsive genes to classify both pools and individual samples (Details shown in Table S6, S7, S8, S9, S10, S11). Notably, these genes were sufficient to classify BRCA1 versus BRCA2 pools with 100% accuracy, with a slightly reduced prediction accuracy of 83% within the individual samples for all models (Table 2). Classification was lowest when comparing BRCAX and BRCA1 samples (56%–67%), or BRCAX and BRCA2 samples (44%–72%) (Table 2). Although the DLDA classifier performed well using microarray derived expression values from BRCA1, BRCA2 and BRCAX pools, the model performed relatively poorly when classifying individual samples with greater than 50% misclassification in some analyses (Table 2). The best performing classifier of individual samples was the Nearest Centroid model which gave the highest prediction accuracy (59%) for BRCA1, BRCA2 and BRCAX mutation type. Furthermore, this model successfully classified the majority of individual samples from two-way comparisons of BRCA1 versus BRCA2 (83%), BRCA1 versus BRCAX (67%), and BRCA2 versus BRCAX (72%).
Discussion
We have recently reported a study using expression profiling of IR treated LCLs to predict the mutations status of BRCA1 and BRCA2 with the ultimate aim of predicting the significance of unclassified variants of BRCA1 and BRCA2 [9]. Using similar rationale, the present study explores the use of treatment regimes that employ the DNA damaging agents, IR and MMC, with the aim to increase the prediction accuracy from that reported by Waddell et al, especially between BRCA1 and BRCA2 [9]. Furthermore, this study demonstrates the use of RNA pools to compare the effect of five different IR or MMC treatment regimes on the expression profiles of LCLs derived from BRCA1, BRCA2 and BRCAX cases.
Our results from analysis of RNA pools suggested that treating LCLs with 1.2 µM MMC and measuring the gene expression profiles 60 minutes post-treatment had the greatest potential to discriminate BRCA1, BRCA2 and BRCAX mutation status. We subsequently built a classifier using the expression of nine genes that were responsive to the 1.2 µM MMC(T60) treatment regime. Leave-one-out-cross-validation to the whole procedure was not possible with the current study design given that the 9-gene classifier was derived in two stages: 1) from the intersection of three gene lists from three separate analyses, and 2) from only those genes confirmed by QRT-PCR. We acknowledge that overfitting could play a role in this study, and for this reason we used a stringent filtering approach as outlined in Figure 1. The highest prediction accuracy achieved using the 9-gene classifier for individual BRCA1, BRCA2 and BRCAX samples (59%) was similar to that previously reported by Waddell et al (62%) [9], although due to differences in experimental design we cannot exclude the possibility that the prediction accuracy from the latter study may have been influenced by an experimentally induced bias. Importantly, our results showed that after treatment with MMC, BRCA1 and BRCA2 samples were shown here to be more dissimilar than either BRCA1 or BRCA2 was from BRCAX. Furthermore, in contrast to Waddell et al [9], BRCA1 and BRCA2 samples were classified with high accuracy, thus supporting the notion that LCLs harboring pathogenic mutations in BRCA1 and BRCA2 have a distinctive expression. Together these results suggest that compared to BRCA1 and BRCA2 truncating mutation carriers BRCAX comprises a genetically heterogeneous group that requires further molecular-based stratification. This notion is also consistent with linkage studies [16] as well as molecular studies that suggested BRCAX tumors can be classified into at least five molecular subtypes [17],[18]. It is therefore reasonable to propose that the accuracy of classifying pathogenic sequence variants in LCLs by expression profiling will improve as molecular subgroups within BRCAX individuals are identified.
An important method employed by this microarray-based study was the use of RNA pooling primarily to reduce cost. Studies have also used RNA pooling as a strategy to reduce the effects of biological variation with the aim of detecting gene expression profiles that differ between biological class [14],[15]. A disadvantage with pooling RNA is the impact it may have on statistical power in identifying genes that are differentially expressed between two or more classes [19],[20]. This is because pooling RNA prevents both accurate measurement of expression variation within the sample population and identification of deviant samples. Pooling has been shown to be most useful when the gene expression differences between biological conditions are larger than differences introduced by technical variability [21]–[23]. LCLs analyzed in the present study showed relatively low biological variation between pools for many of the genes analyzed, including the nine genes found to be 1.2 µM MMC(T60)-responsive. Expression differences between the biological classes studied were therefore more prone to variance introduced at each step of the microarray experiment. These small differences may account in part for the reduced classification accuracy observed using expression values measured by QRT-PCR as compared to the same analysis using microarray data. However, it is worth noting that we generally observed good correlation between the RNA pools and virtual pools for the expression differences (Table S2), supporting the use of pooling sample RNA for initial microarray experiments to direct downstream analysis of individual samples.
Previous studies have suggested MMC may perturb the Fanconi anemia pathway, in which BRCA2 plays a major role [24]. Interestingly, the protein encoded by one of the nine MMC responsive genes, CASP3, is known to be activated by the Fanconi anemia pathway as result of MMC or IR treatment [25]. The nuclear lamina protein LMNA has also been shown to play a role in ATR mediated DNA repair [26] and through this role may interact with BRCA1 and/or BRCA2 in response to MMC induced DNA damage [27]. It is unclear at this stage whether the remaining seven MMC responsive genes play a role in the Fanconi anemia pathway, and how they are functionally linked to BRCA1 and/or BRCA2. It is possible that unmapped BRCA1 - and/or BRCA2-related pathways are also being perturbed by MMC treatment. An intriguing thought is the possibility that these genes may act as potential modifiers of BRCA1 and/or BRCA2 associated breast cancer risk. We have previously reported a novel method of using expression arrays and the Cancer Genetic Markers of Susceptibility (CGEMS) Breast Cancer Whole Genome Association Scan to prioritize IR response genes that potentially modify breast cancer risk in BRCA1 and BRCA2 carriers [28]. It is interesting to note that of the nine 1.2 µM MMC(T60)-responsive genes, GPM6A and CDCP1 are tagged with single nucleotide polymorphisms that are shown by CGEMS to be associated with breast cancer risk (P<0.05) (data not shown). Furthermore, deletions of chromosome regions harboring GPM6 (4q34.2), CASP3 (4q35.1), and P4HA2 (5q23.3) have been shown to be associated with breast tumors from BRCA1 mutation carriers [29]–[31],[18]. Likewise, genomic regions harboring RARSL (6q15) and FAM26F (6q22.1) have been frequently deleted in BRCA2 associated breast tumors [31]. These results give rise to an intriguing possibility that GPM6, CASP3, P4HA2, RARSL and FAM26F may also be targeted during breast tumorigenesis as the tumor cells undergo genomic copy number change.
In summary, our results demonstrate the use of RNA pooling and microarray profiling to assess LCLs derived from patients with a strong family history of breast cancer. This study highlights the novel use of MMC to perturb LCL expression profiles to identify genes that correlate with BRCA1, BRCA2 and BRCAX mutation status. This strategy proved promising for classifying mutation status by gene expression profile, particularly between BRCA1 and BRCA2, and prediction accuracy may be improved further by exploring different MMC doses and/or analysis time points. We propose that the pooling method is the most practical approach for comparing a number of different treatment regimes across several different sample sets. This strategy is likely to be very useful for identifying treatments that induce the greatest expression changes in LCLs after stimulation. Identifying genes whose expression is associated with BRCA1, BRCA2 and BRCAX mutation status would be a valuable method of screening individuals from multiple case breast cancer families for the presence of pathogenic mutations.
Materials and Methods
Ethics statement
Ethical approvals were obtained from the Human Research Ethics Committees of the Queensland Institute of Medical Research and the Peter MacCallum Cancer Centre. Written informed consent was obtained from each participant.
Subjects and lymphoblastoid cell-lines
Epstein Barr virus-transformed lymphoblastoid cell-lines (LCLs) were derived from breast cancer-affected women in multi-case families recruited into the Kathleen Cuningham Foundation for Research into Breast Cancer (kConFab) [32] and from healthy female controls recruited as volunteers from the Queensland Institute of Medical Research. A cohort of 36 LCLs were used in this study, including nine LCLs from women carrying a pathogenic mutation in BRCA1, nine LCLs from women carrying a pathogenic mutation in BRCA2, nine LCLs from women from breast cancer families that have tested negative for pathogenic mutations in BRCA1 or BRCA2 (termed BRCAX), and nine LCLs from healthy control females. Details of the mutations carried by each of the LCLs used in the study are shown in Table S12.
LCL culture and treatment
LCLs were cultured in RPMI-1640 (Gibco Invitrogen) supplemented with 10% Serum Supreme (Lonza BioWhittaker), 1% penicillin-streptomycin (Gibco Invitrogen). Cell number was normalized to a density of 5×10⁵ cells/mL, approximately 4 h prior to treatment. To extend a previous study where gene expression levels were measured in LCLs after 10 Gy IR and 30 minute incubation [9], this study aims to identify IR responsive genes after an equivalent IR dose but at 60 minutes post-treatment. The MMC treatments were selected based on previous reports that showed LCLs carrying a mutation in the BRCA2 gene were sensitive to MMC at 0.05 µM - 1.2 µM after 1–2 hours incubation [33],[34]. In this study, LCLs from each of the BRCA1, BRCA2 and BRCAX patient groups, and from healthy controls, were irradiated at 10 Gy using a calibrated Cesium-137 source or treated with MMC at two different doses (0.4 µM or 1.2 µM). Cells were harvested prior to IR or MMC treatment (T0), at 1 h after IR exposure, and at 1 and 2 h after exposure for MMC.
Microarray expression profiling
Total RNA was extracted and purified using the RNeasy Mini Kit (Qiagen GmbH). Three RNA pools were generated within each group (BRCA1, BRCA2, BRCAX and healthy controls) that comprised RNA (1000 ng) from each of three individual samples. RNA was quantified pre - and post-pooling using the NanoDrop ND-1000 spectrophotometer (Thermo Scientific). A comparison of estimated and observed RNA concentrations associated with each pool is detailed in Table S13. This procedure was carried out for each of the six treatment groups (including T0), thus generating a total of 72 RNA pools. The Illumina TotalPrep RNA Amplification Kit (Ambion) was used to amplify and biotinylate 450 ng of total RNA from each of the pools. Biotinylated RNA was hybridized to Illumina HumanRef8-V2 Beadchips (∼22,000 probes), washed, and stained with streptavidin-Cy3 before scanning with an Illumina BeadArray Reader. The RNA pools were processed in random order to minimize any chance of technical bias being introduced into the microarray data. Duplicate arrays were performed for eight pools to test for reproducibility, and a high correlation (r2>0.99) was measured within each paired-pool comparison. Only one of each duplicated sample was included in subsequent analyses.
Microarray data analysis
Raw data were processed using Illumina BeadStudio before undergoing quantile normalization to account for systematic variation between arrays. Microarray data are available via GEO: GSE17764. Probes that obtained an Illumina detection score greater than 0.99 in at least one of the arrays (n = 16,478 probes) were retained for further analysis. Subsequent statistical analysis of genes differentially expressed between RNA-pools, classified by mutation and treatment type, was carried out using BRB-ArrayTools version 3.7.0 (http://linus.nci.nih.gov/BRB-ArrayTools.html). Genes differentially expressed between BRCA1, BRCA2 and BRCAX pools, and between treated and untreated LCL pairs of healthy control pools were evaluated using three-sample F-tests and paired T-tests, respectively (α = 0.05). Microarray expression profiles of the treated and untreated LCL pairs of BRCA1, BRCA2 and BRCAX pools were compared using paired T-tests and the number of false discoveries was restricted to 10% at a 90% confidence level using methods described elsewhere [35],[36].
Quantitative reverse transcription–PCR
First-strand cDNA synthesis was performed using 450 ng of total RNA and SuperScript III First-Strand Synthesis System for RT-PCR (Invitrogen), according to manufacturer's instructions. Quantitative reverse transcription PCR (QRT-PCR) was performed using Platinum SYBR Green qPCR SuperMix-UDG (Invitrogen) and the LightCycler480 system (Roche Applied Science). Briefly, each 15 µL reaction contained 1x Platinum SYBR Green qPCR SuperMix-UDG, and 333 nM of each primer. Primer sequences are listed in Table S14. For each gene, primers sequences were designed to target at least one exon detected by the Illumina HumanRef8-V2 Beadchip probe sequence. QRT-PCR conditions were as follows: 50°C for 2 minutes, 95°C for 2 minutes, and then 45 cycles of 95°C for 20 seconds, 60°C for 15 seconds and 72°C for 20 seconds. All QRT-PCR reactions were done in triplicate. The data were normalized to the housekeeping gene EEF1A1 and log2-transformed for further analysis.
Class prediction with microarray and QRT–PCR data
Class prediction was performed using Diagonal Linear Discriminant Analysis [37], K-Nearest Neighbour Classification [37], Nearest Centroid [38], Support Vector Machines (SVM) [39], and Compound Covariate Predictor [40] algorithms in BRB-ArrayTools version 3.7.0. The K-Nearest Neighbour method used one nearest neighbour (k = 1), and the linear kernel method was used for Support Vector Machines. The models incorporated MMC responsive genes confirmed by QRT-PCR (see Results) that were differentially expressed between BRCA1, BRCA2 and BRCAX classes. Leave-one-out cross-validation method was used to compute misclassification rate [41].
Supporting Information
Zdroje
1. PerouCM
SorlieT
EisenMB
van de RijnM
JeffreySS
2000 Molecular portraits of human breast tumours. Nature 406 747 752
2. SorlieT
PerouCM
TibshiraniR
AasT
GeislerS
2001 Gene expression patterns of breast carcinomas distinguish tumor subclasses with clinical implications. Proc Natl Acad Sci U S A 98 10869 10874
3. SorlieT
TibshiraniR
ParkerJ
HastieT
MarronJS
2003 Repeated observation of breast tumor subtypes in independent gene expression data sets. Proc Natl Acad Sci U S A 100 8418 8423
4. WeigeltB
HuZ
HeX
LivasyC
CareyLA
2005 Molecular portraits and 70-gene prognosis signature are preserved throughout the metastatic process of breast cancer. Cancer Res 65 9155 9158
5. FinakG
BertosN
PepinF
SadekovaS
SouleimanovaM
2008 Stromal gene expression predicts clinical outcome in breast cancer. Nat Med 14 518 527
6. HedenfalkI
DugganD
ChenY
RadmacherM
BittnerM
2001 Gene-expression profiles in hereditary breast cancer. N Engl J Med 344 539 548
7. Kote-JaraiZ
WilliamsRD
CattiniN
CopelandM
GiddingsI
2004 Gene expression profiling after radiation-induced DNA damage is strongly predictive of BRCA1 mutation carrier status. Clin Cancer Res 10 958 963
8. Kote-JaraiZ
MatthewsL
OsorioA
ShanleyS
GiddingsI
2006 Accurate prediction of BRCA1 and BRCA2 heterozygous genotype using expression profiling after induced DNA damage. Clin Cancer Res 12 3896 3901
9. WaddellN
Ten HaafA
MarshA
JohnsonJ
WalkerLC
2008 BRCA1 and BRCA2 missense variants of high and low clinical significance influence lymphoblastoid cell line post-irradiation gene expression. PLoS Genet 4 e1000080 doi:10.1371/journal.pgen.1000080
10. CheungVG
ConlinLK
WeberTM
ArcaroM
JenKY
2003 Natural variation in human gene expression assessed in lymphoblastoid cells. Nat Genet 33 422 425
11. CorreaCR
CheungVG
2004 Genetic variation in radiation-induced expression phenotypes. Am J Hum Genet 75 885 890
12. WaddellN
JonnalagaddaJ
MarshA
GristS
JenkinsM
2006 Characterization of the breast cancer associated ATM 7271T>G (V2424G) mutation by gene expression profiling. Genes Chromosomes Cancer 45 1169 1181
13. SmirnovDA
MorleyM
ShinE
SpielmanRS
CheungVG
2009 Genetic analysis of radiation-induced changes in human gene expression. Nature 459 587 591
14. AgrawalD
ChenT
IrbyR
QuackenbushJ
ChambersAF
2002 Osteopontin identified as lead marker of colon cancer progression, using pooled sample expression profiling. J Natl Cancer Inst 94 513 521
15. EnardW
KhaitovichP
KloseJ
ZollnerS
HeissigF
2002 Intra - and interspecific variation in primate gene expression patterns. Science 296 340 343
16. SmithP
McGuffogL
EastonDF
MannGJ
PupoGM
2006 A genome wide linkage search for breast cancer susceptibility genes. Genes Chromosomes Cancer 45 646 655
17. HedenfalkI
RingnerM
Ben-DorA
YakhiniZ
ChenY
2003 Molecular classification of familial non-BRCA1/BRCA2 breast cancer. Proc Natl Acad Sci U S A 100 2532 2537
18. WaddellN
ArnoldJ
CocciardiS
da SilvaL
MarshA
2009 Subtypes of familial breast tumours revealed by expression and copy number profiling. Breast Cancer Res Treat
19. ShihJH
MichalowskaAM
DobbinK
YeY
QiuTH
2004 Effects of pooling mRNA in microarray class comparisons. Bioinformatics 20 3318 3325
20. ZhangW
CarriquiryA
NettletonD
DekkersJC
2007 Pooling mRNA in microarray experiments and its effect on power. Bioinformatics 23 1217 1224
21. KendziorskiCM
ZhangY
LanH
AttieAD
2003 The efficiency of pooling mRNA in microarray experiments. Biostatistics 4 465 477
22. PengX
WoodCL
BlalockEM
ChenKC
LandfieldPW
2003 Statistical implications of pooling RNA samples for microarray experiments. BMC Bioinformatics 4 26
23. KendziorskiC
IrizarryRA
ChenKS
HaagJD
GouldMN
2005 On the utility of pooling biological samples in microarray experiments. Proc Natl Acad Sci U S A 102 4252 4257
24. HowlettNG
TaniguchiT
DurkinSG
D'AndreaAD
GloverTW
2005 The Fanconi anemia pathway is required for the DNA replication stress response and for the regulation of common fragile site stability. Hum Mol Genet 14 693 701
25. GuilloufC
VitJP
RosselliF
2000 Loss of the Fanconi anemia group C protein activity results in an inability to activate caspase-3 after ionizing radiation. Biochimie 82 51 58
26. ManjuK
MuralikrishnaB
ParnaikVK
2006 Expression of disease-causing lamin A mutants impairs the formation of DNA repair foci. J Cell Sci 119 2704 2714
27. WangW
2007 Emergence of a DNA-damage response network consisting of Fanconi anaemia and BRCA proteins. Nat Rev Genet 8 735 748
28. WalkerLC
WaddellN
Ten HaafA
GrimmondS
SpurdleAB
2008 Use of expression data and the CGEMS genome-wide breast cancer association study to identify genes that may modify risk in BRCA1/2 mutation carriers. Breast Cancer Res Treat 112 229 236
29. MelchorL
HonradoE
HuangJ
AlvarezS
NaylorTL
2007 Estrogen receptor status could modulate the genomic pattern in familial and sporadic breast cancer. Clin Cancer Res 13 7305 7313
30. JoosseSA
van BeersEH
TielenIH
HorlingsH
PeterseJL
2009 Prediction of BRCA1-association in hereditary non-BRCA1/2 breast carcinomas with array-CGH. Breast Cancer Res Treat 116 479 489
31. StefanssonOA
JonassonJG
JohannssonOT
OlafsdottirK
SteinarsdottirM
2009 Genomic profiling of breast tumours in relation to BRCA abnormalities and phenotypes. Breast Cancer Res 11 R47
32. MannGJ
ThorneH
BalleineRL
ButowPN
ClarkeCL
2006 Analysis of cancer risk and BRCA1 and BRCA2 mutation prevalence in the kConFab familial breast cancer resource. Breast Cancer Res 8 R12
33. WarrenM
LordCJ
MasabandaJ
GriffinD
AshworthA
2003 Phenotypic effects of heterozygosity for a BRCA2 mutation. Hum Mol Genet 12 2645 2656
34. ArnoldK
KimMK
FrerkK
EdlerL
SavelyevaL
2006 Lower level of BRCA2 protein in heterozygous mutation carriers is correlated with an increase in DNA double strand breaks and an impaired DSB repair. Cancer Lett 243 90 100
35. KornEL
TroendleJF
McShaneLM
SimonR
2004 Controlling the number of false discoveries: Application to high dimensional genomic data. J Stat Plan Infer 124 379 378
36. KornEL
LiMC
McShaneLM
SimonR
2007 An investigation of two multivariate permutation methods for controlling the false discovery proportion. Stat Med 26 4428 4440
37. DudoitS
FridlyandF
SpeedTP
2002 Comparison of discrimination methods for classification of tumors using DNA microarrays. J Am Stat Assoc 97 77 87
38. TibshiraniR
HastieT
NarasimhanB
ChuG
2002 Diagnosis of multiple cancer types by shrunken centroids of gene expression. Proc Natl Acad Sci U S A 99 6567 6572
39. RamaswamyS
TamayoP
RifkinR
MukherjeeS
YeangCH
2001 Multiclass cancer diagnosis using tumor gene expression signatures. Proc Natl Acad Sci U S A 98 15149 15154
40. RadmacherMD
McShaneLM
SimonR
2002 A paradigm for class prediction using gene expression profiles. J Comput Biol 9 505 511
41. LachenbruchPA
MickeyMR
1968 Estimation of error rates in discriminant analysis. Technometrics 10 1 11
Štítky
Genetika Reprodukční medicínaČlánek vyšel v časopise
PLOS Genetics
2010 Číslo 2
- Kazuistika – Perspektivy využití precizované medicíny v rámci personalizované specifické terapie onkologických pacientů
- Nobelova cena za chemii pro genetické nůžky: Objev, který změní naši budoucnost?
- Technologie na bázi RNA v klinické praxi: od přebarvených petúnií k terapii vzácných a dosud jen obtížně léčitelných chorob u lidí
- „Nepředstavovali jsme si, že náš výzkum povede přímo ke vzniku nových léků, dokonce ještě za našeho života“
- Bezplatné služby pro diagnostiku ATTRv amyloidózy pro kardiology
Nejčtenější v tomto čísle
- Genome-Wide Association Study in Asian Populations Identifies Variants in and Associated with Systemic Lupus Erythematosus
- Nucleoporins and Transcription: New Connections, New Questions
- Nuclear Pore Proteins Nup153 and Megator Define Transcriptionally Active Regions in the Genome
- The Genetic Interpretation of Area under the ROC Curve in Genomic Profiling
Zvyšte si kvalifikaci online z pohodlí domova
Mazová zátka a její řešení
nový kurzVšechny kurzy