
Deconvolution-based Physiological Signal Simplification for Periodical Parameter Estimation
The estimation of physiological parameters from raw sensor signals is absolutely crucial in modern clinical applications. A wide variety of these parameters incorporate a periodic nature, such as the heart rate or the respiration rate. This property can be exploited for their estimation. Particularly challenging is the processing of novel, unobtrusive measurement techniques, which are characterized by complex, time-varying waveforms. Simple peak detection algorithms are often not suited for these applications. One way to tackle these challenges is a preprocessing step for the simplification of the physiological signals. A novel deconvolution based approach for this preprocessing is introduced and evaluated in this paper. Two deconvolution methods are regarded, the “Minimum Entropy Deconvolution” (MED) and the “Maximum Correlated Kurtosis Deconvolution” (MCKD). Important parameters are outlined and examined. Finally, the methods are validated using artificial as well as real clinical signals to demonstrate their potential.
Keywords:
deconvolution, preprocessing, pitch estimation, periodical parameter estimation, interbeat interval estimation, ballistocardiogram
Authors:
Stefan Liebich 1; Christoph Brüser 2; Steffen Leonhardt 2
Authors place of work:
Institute of Communication Systems and Data Processing, RWTH Aachen University, Germany
1; Philips Chair for Medical Information Technology, RWTH Aachen University, Germany
2
Published in the journal:
Lékař a technika - Clinician and Technology No. 2, 2014, 44, 18-24
Category:
Původní práce
Summary
The estimation of physiological parameters from raw sensor signals is absolutely crucial in modern clinical applications. A wide variety of these parameters incorporate a periodic nature, such as the heart rate or the respiration rate. This property can be exploited for their estimation. Particularly challenging is the processing of novel, unobtrusive measurement techniques, which are characterized by complex, time-varying waveforms. Simple peak detection algorithms are often not suited for these applications. One way to tackle these challenges is a preprocessing step for the simplification of the physiological signals. A novel deconvolution based approach for this preprocessing is introduced and evaluated in this paper. Two deconvolution methods are regarded, the “Minimum Entropy Deconvolution” (MED) and the “Maximum Correlated Kurtosis Deconvolution” (MCKD). Important parameters are outlined and examined. Finally, the methods are validated using artificial as well as real clinical signals to demonstrate their potential.
Keywords:
deconvolution, preprocessing, pitch estimation, periodical parameter estimation, interbeat interval estimation, ballistocardiogram
Introduction
Nowadays, a wide variety of vital signs are measured in the clinical environment. Various of these are based on periodic physiological processes, such as the heart rate and the respiration rate. A reliable measurement of these periodical parameters is crucial for clinical decisions.
On the other hand, there is a trend towards monitoring of vital signs without supervision of clinical staff in the home environment of patients. Novel, easy to apply measurement systems are required for these conditions. One promising technique is ballistocardio-graphy, which measures the mechanical activity of the heart on the body surface, for example by pressure sensors. It has the capability to unobstructively measure the heart activity. This comes at the cost of a more complex waveform which impedes simple peak detection algorithms for the measurement of the heart rate.
Therefore, more sophisticated techniques are required. Various different approaches have been published in the previous years. Some operate in the frequency domain, e.q. [6], and some are correlation-based methods [3]. These methods also differ whether they solely measure an averaged interbeat interval or determine the individual heart beat locations.
In this paper, a novel approach for periodic parameter estimation using deconvolution techniques is proposed and investigated. The basic idea of their application is illustrated in Fig. 1.

The fundamental assumption is that each heart beat is represented by a Dirac impulse. An FIR filter models the specific measurement setup and the physiological influences. It varies between different techniques (such as ECG, PPG or BCG), between different patients and also between different points in time. The measured signal contains a convolution of the impulse sequence with this FIR filter, depicted as the last block to the right. Hence, the deconvolution technique tries to estimate the inverse of the FIR filter to compensate its influence and regain the impulse sequence. This impulse sequence is then further processed.
Two distinct deconvolution techniques are investigated, the Minimum Entropy Deconvolution (MED) and the Maximum Correlated Kurtosis Deconvolution (MCKD). The MED was introduced by Ralph A. Wiggins in the year 1978 for the analysis of seismic reflection recordings [1]. It is mainly used in the field of geophysics and seismic signal analysis. In 2012, Geoff McDonald published a paper on a novel variant of minimum entropy deconvolution for periodic signals, the Maximum Correlated Kurtosis Decon-volution [2]. It exploits the periodic nature of the input signals and was originally designed for gear tooth chip fault detection.
This paper is structured into a methods section, where the deconvolution techniques are presented, a results section with different experiments on the potential and limitations of the methods, their interpretation in the discussion section, and an overall conclusion in the last section.
Methods
The application of deconvolution techniques for interbeat interval estimation is based on the assumption that the heart beats are represented by an impulse sequence q, which is altered by an FIR filter ω. The measurement signal χ is the convolution of the two signals.

The deconvolution attempts to estimate an inverse filter to reverse this process.

Therefore, the final goal is to regain the assumed impulse sequence q, where each impulse corresponds to one heartbeat. In the ideal case, f is exactly the inverse of ω. The challenge is to estimate a filter f, which creates a good impulse sequence estimate y only based on the knowledge χ of without any further information about q and ω.
In the following, two methods are presented, which are based on the assumption of a simple, impulse-like target signal y.
Minimum Entropy Deconvolution (MED)
Suppose the inputs are labeled by indices i=1...Nc with Nc the number of channels and j=1...NS with NS the number of samples per channel. Nf corresponds to the number of filter samples. The deconvolution in eq. (2) may then be expressed in more detail as follows.

The impulse-like structure and thereby the simplicity of the input can be measured by different norms. Wiggins used the varimax norm given in eq. (4), which is based on the varimax rotation from the field of factor analysis (see [8] for further information). It is the sum of normalized squares of the variances of the samples (see [1]).

In order to find the filter which maximizes this simplicity norm , it is differentiated with respect to the filter coefficients fk and set to zero.

This results in the following eq. (6). For the detailed derivation the reader is referred to [1].

with

or in a compact matrix form as

Φχχ is an autocorrelation matrix in Toeplitz form of the input signal .Φy3χ is a column vector of cross correlations of the input χ and the cubed filter outputs y3.f is a column vector of the filter coefficients. The weighting factors k1 and k2 are scalar values depending on the channel i. They are defined as

and

A closed form solution for f is not possible. However, eq. (7) allows an iterative procedure based on the well-known Levinson-Durbin-Algorithm to calculate the filter f. A convergence towards the optimal impulse sequence is not guaranteed and depends on different parameters, which are addressed later in this paper.
One of the major drawbacks of the MED for the application on periodical signals is the fact that the maximum of the norm is given for one single peak as illustrated in Fig. 2. It may therefore happen that the techniques return a filter which creates an output signal with one large peak rather than the desired periodic impulses. Therefore, we are also considering the following method named MCKD.
![Fig. 2: Six example input signals for demonstrating their effect on the different norms. The corresponding norm values are given in Tab. 1. The image is inspired by [2].](https://pl-master.mdcdn.cz/media/image/d574889e5b2546f8486c710c0a0028d9.jpg?version=1537797103)
Maximum Correlated Kurtosis Deconvolution (MCKD)
The MCKD method is based on the correlated kurtosis (CK) norm shown in eq. (8).

The norm consists of a multiplication of the signal with a shifted version of itself for M=1. For higher orders, the signal is multiplied with M shifted versions. It combines the kurtosis calculation with the idea of correlation and thereby utilizes the periodic character of the input signal. The norm creates higher values in the presence of periodic impulses with a preselected period of interest T. For higher shift orders , the sensitivity for the selected period of interest is increased.
To get an impression of the norm values for different cases, an example is provided in Fig. 2 and Tab. 1. It shows different input signals, which are examined. The corresponding Varimax (V) and Correlated Kurtosis (CK) values for the example signals are given in Tab. 1. The CK was calculated with a period of interest T=200 of and a shift of M=1. One can observe that the V-norm is maximal in case four, when only one large peak is present and the CK-norm reaches its maximum for case five, when the selected period fits the impulse sequences.

Similar to the derivation of the MED algorithm, the CK norm is differentiated with respect to the filter coefficients fk and set to zero. This likewise results in an iterative procedure given by the matrix equation (9). For the detailed derivation the reader is referred to [2].

with


and

The result shown in eq. (9) requires an iterative calculation of the filter f. The first iteration starts with a beforehand specified initial filter f0, a predefined period of interest T and a shift order M. In each iteration k the filter output yk is determined by apply the previous filter fk-1. Then the other variables, namely XT, αM, βM, are calculated in order to determine a new filter fk. This procedure is repeated until the solution converged.
Iterative Procedure
The convergence of the iterative algorithms is illustrated for the MED method in Fig. 3. This also gives an impression of the procedure for the MCKD method, as it is very similar.

Here, the initial filter f0 is simply a Dirac impulse. Therefore, the first output y1 reproduces the input χ. Then a new filter f1 is designed by applying eq. (7) for the MED and eq. (9) for the MCKD method. The resulting output y2 is shown in Fig. 3. It is observable that the neighboring peaks have already been attenuated compared to the input signal χ. The main peaks, on the other hand, were emphasized, which is also reflected by the increasing norm values in Tab. 2.

After convergence, the final result of the MED method, given by yfinal, is quite similar to the ideal impulse sequence. Looking at the norm values the reader can observe that the method tends to maximize these in order to create impulse sequences. This example illustrates the convergence of the algorithm towards a good estimate of the impulse sequence.
Results
The following section addresses the parameter influences on the deconvolution result. Furthermore, two short evaluations are carried out with artificial and real clinical signals to investigate the peak detection and interbeat interval estimation capabilities.
Influences on the Deconvolution
There are some parameters that need to be chosen and several influences to be kept in mind, when using the MED and the MCKD algorithms. These are, namely, the local validity of the filter estimate, the choice of the initial filter f, as well as the filter length. Additionally, the MCKD is influenced by a preassigned period and M-shift parameter. In this paper, only the most significant influences will be outlined.
One important parameter both methods have in common is the filter length. A shorter filter length limits the capabibility of precise modeling of longer wavelets, but decreases the computational effort. With a longer filter length, the procedure tends to misestimate the filter and only reaches relatively poor local maxima. Additionally, it increases the computational effort. The influence is illustrated in Fig. 4 for three different filter lengths. The input signal was a clean sequence with varying pitch period and absence of any noise.

The left column contains the inverse filter estimates f -1 and the right the corresponding output of the MED method. In the first row, the ideal filter estimate of length 100 samples and the ideal impulse sequence are given as a reference. It is easy to observe that an underestimation of the filter length, as shown in the second row, leads to an unsatisfying filter and impulse train estimate. The filter f is too short to adequately adapt to the assumed FIR filter ω. An overestimation, as shown in the bottom row, also leads to insufficient estimates. The algorithm overfits the filter to the given signal and is no longer able to consider individual intervals. Solely an adequately chosen filter length leads to satisfying results as shown in the third row from the top.
Another aspect for the estimation of a longer impulse signal is the local validity of the filter. The waveform is likely to vary during a measurement. Reasons for this are changes is the measurement modalities as well as background noise influences. Therefore it is necessary to perform local blockwise processing. In order to avoid sharp edges at the block borders the use of a window function, which attenuates the borders of each segment, is crucial. The employed window function is illustrated in Fig. 5 with the attenuating area at the borders and the passband in the middle part (according to [7] p. 55).

The attenuated parts are cut off after the processing and need to be considered within an overlap of successive blocks. Furthermore, additional overlapping can lead to better estimates and to an improved robustness.
The MCKD contains additional parameters, of which solely the influence of the period estimate is regarded in this paper. The impact of different period parameters is depicted in Fig. 6. In order to adequately demonstrate the influence, an input signal with a fixed period is used and additive white Gaussian noise (AWGN) with an SNR of 10dB was added.

The Correlated Kurtosis depending on the period T and the MCKD output are shown. The selected period T is marked in the CK plot by a red cross. The cases of T=0 and T=50 do not give any usable results. This is especially remarkable as for M=1 and T=0 the MCKD is equal to the MED. If the period is adequately chosen near the real interval of 100 samples, the output contains emphasized peaks as expected. This small experiment shows that a suitable selection of T is necessary to gain good results. In order to adapt to this additional parameter, for each frame a separate period estimation is performed with the Correlated Kurtosis norm. By this, the period T is automatically adapted.
Quantitative Analysis with Artificial Signals
After introducing the different influences on the deconvolution, a quantitative analysis was performed on how good the methods reconstruct an impulse-like signal and how well the period can be estimated.
To create a controlled environment for examinations, an artificial BCG signal with 10000 samples and 112 simulated heart beats was generated. It is composed by a combination of sine waves and a sawtooth signal based on [5]. Thereafter, different levels of white Gaussian noise were added to the signal to evaluate the robustness of the methods. These levels define the Signal-to-Noise Ratio (SNR).
In order to determine the necessary SNR level for a good estimation, the peak detection rate (PDR) and the peak misdetection rate (PMR) are valuable measures. The PDR indicates how many of the reference peaks have been found by the algorithm and the PMR represents how many of the detected peaks do not correspond to a reference peak and are therefore falsely detected.
Fig. 8 shows how the methods perform regarding these metrics. From an SNR of 4 dB on both methods are able to create an output signal, where 100 % of the reference peaks are found. However, both incorporate a slight fluctuation concerning the PMR. This means that there are some falsely detected peaks. One must keep in mind that the PDR and the PMR strongly depend on the peak detection algorithm and therefore contain an additional influence. Still, it belongs to the process chain and should therefore also be regarded. Further tuning of the parameters of the peak detection algorithms will probably result in more reliable results. For this investigation the findpeaks algorithm of MATLAB 2012a was chosen.

Eventually, the interbeat interval is the parameter of interest. In order to judge when an estimation is satisfying, the mean interbeat interval error (Ē) is regarded. It incorporates all reasonable interbeat intervals and measures the error with respect to the reference. In this case, the reference is given by the perfect knowledge of the artificial signal.
Fig. 9 supports the conclusions already drawn from Fig. 8. The minimum SNR to get appropriate estimations is 4 dB. From this value on, Ē lies consistently below 4 %.

Real Clinical Signals
In the following short evaluation, the capability of the presented deconvolution methods with respect to real signals is regarded. For this purpose, physiological signals are taken from a sleep lab database [4]. The database contains simultaneous recordings of ECG, PPG and BCG sensors. As commonly accepted, the ECG sensor defines the Gold Standard for interbeat interval measurement and is used as the reference. An artifact free segment of T=1000 s with 853 detected heart beats was chosen for the evaluation.
Tab. 3 contains the results after processing the input signals of two different sensors with both methods. The parameterization of the methods was done as follows. For a sampling frequency of 200 Hz, a reasonable heart rate between 40 and 160 bpm would result in a period length between 75 and 300 samples. Therefore, the MED and the MCKD filter length were chosen to be 100 samples. The overlapping of neighboring frames of the size of 1500 samples is 75 % for the MED, which corresponds to a feed rate of 375 samples, and 50 % for the MCKD, which corresponds to a feedrate of 750 samples. The framesize is chosen to guarantee the coverage of five full periods with the maximum period length of 300 samples. Consequently, the M-shift of the MCKD is set to 4. To avoid sharp edges, the earlier presented window function with an 80 % plateau of unattenuated signal part is used.
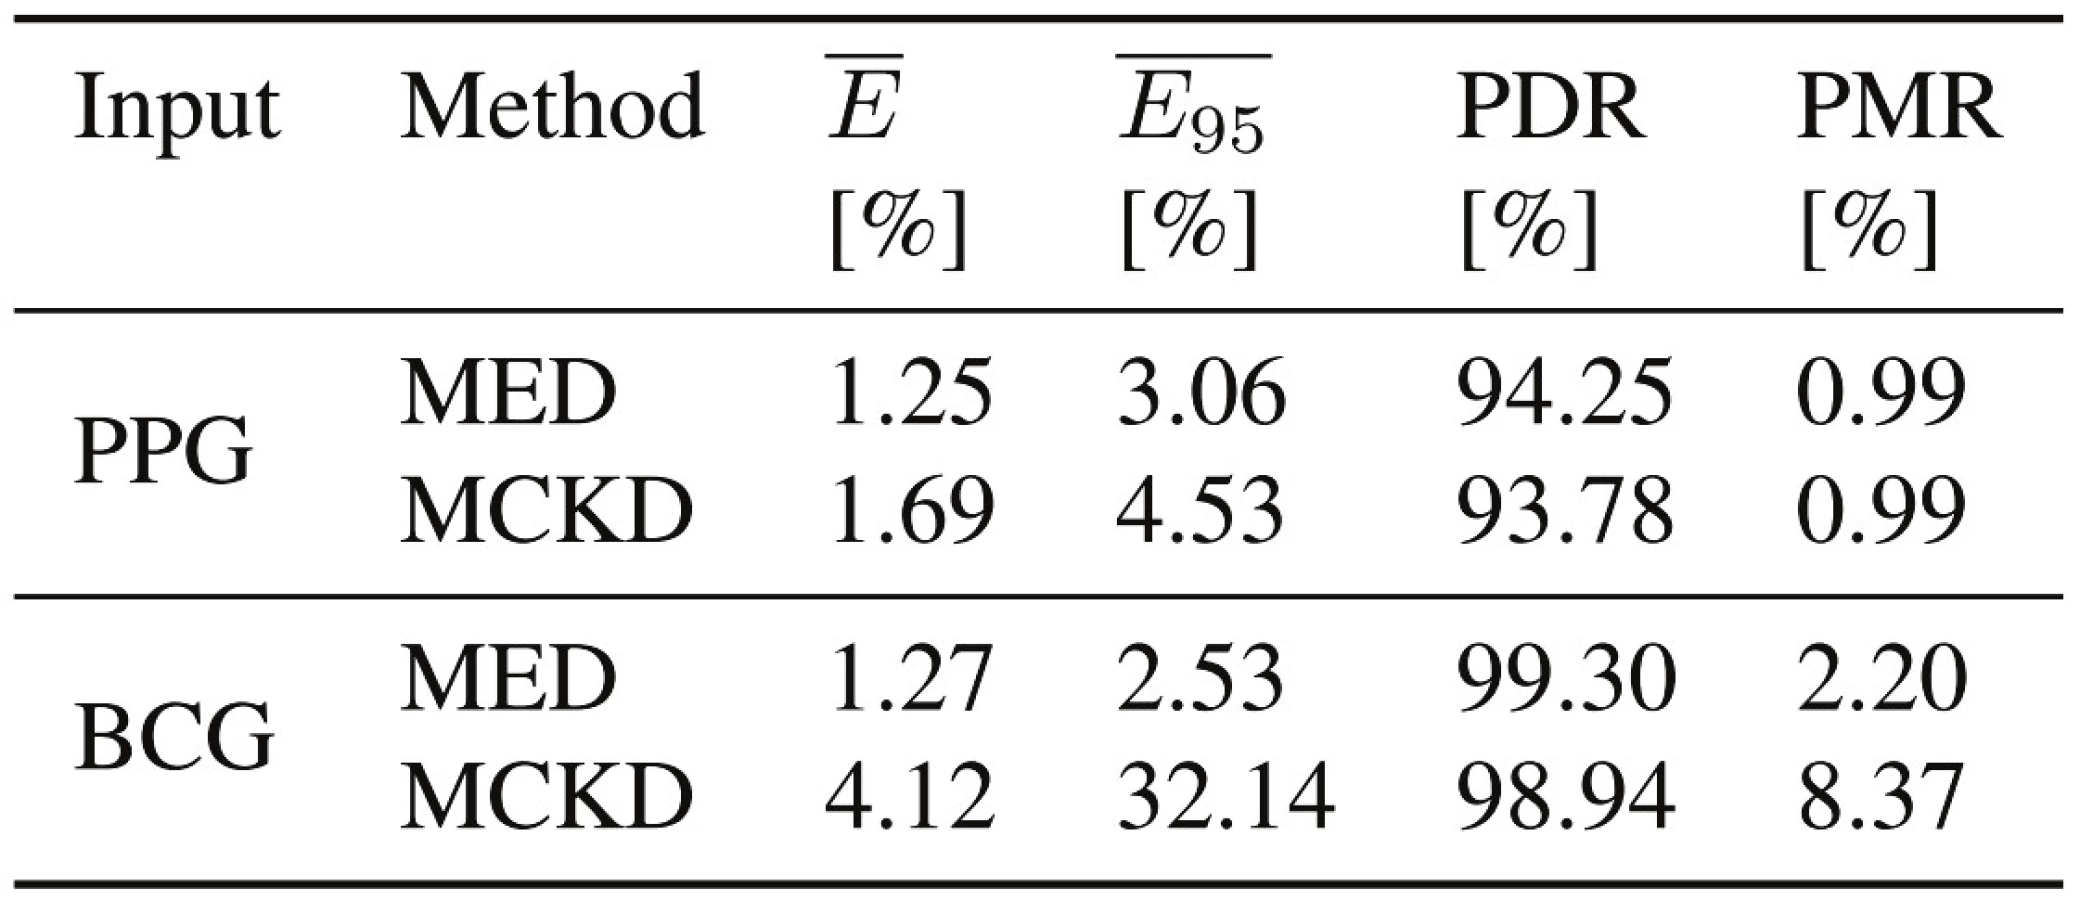
The evaluation parameters are grouped into interval-based and peak-based measures. The mean beat-to-beat interval error (), which describes the mean deviation from the interbeat interval reference, and the 95th error percentile (), which represents the spread of the error, embody the interval-based measures. Only reasonable interbeat intervals are considered for this metric, described by a period length between 75 and 300 samples for this example. On the other hand, the Peak Detection Rate (PDR) and the Peak Misdetection Rate (PMR) characterize how succesful the peaks are detected.
The PDR is over 93 % for all cases and at the same time, the PMR is less than 2.5 % for all but one case. This indicates that most of the heart beats and the corresponding peaks have been found and only little misdetections happened. At the same time, the interval-based parameters are all below 2 %, except for the BCG sensor in combination with the MCKD method. Overall, most of the results are well within very good boundaries and indicate the applicability of these methods for physiological signals.
Discussion
The results of the evaluation with real clinical data depict good estimation performance with regard to the reference. Consequently, they demonstrate the appropriateness of deconvolution methods for physiological signal simplification in order to obtain interbeat interval estimates.
However, adequate selection of the presented method’s parameters is crucial in order to obtain usable impulse sequences. As the deconvolution methods are not guaranteed to converge to the absolute maximum, the parameters must define a suitable initial state. If, for example, the filter length is estimated poorly, the method is likely deteriorating the signal rather than improving it. The applicability is therefore limited for cases in which a careful selection of the parameters is difficult. This is the case if large variations in reasonable interval values complicate an adequate parameter selection.
The overall goal of the MED and the MCKD method is to create an output signal, which maximizes the corresponding norm. Both norms are taking high values for impulse sequences with sharp spikes and therefore lead to the desired output signal. However, the estimated filter f solely has the purpose to create these output signals. This is revealed especially in the case of noise interfering with the input signals. The estimated filter f will then have an arbitrary and no meaningful shape, as the goal of the method is to achieve large spikes. Therefore an interpretation of this output is not useful.
In general, the presented methods provide precise heart beat positions connected with the interbeat intervals rather than averaged estimations. Therefore they establish the possibility to identify individual irregular periods or can be used for long term heart rate variability measurements.
Another advantage is the independence of the method of the given signal morphology.
Conclusion
We presented a novel deconvolution-based approach for the preprocessing of physiological signals in order to estimate periodic vital signs.
Two iterative deconvolution methods, which are based on the maximization of a simplicity norm, are introduced; the Minimum Entropy Deconvolution (MED) based on the varimax norm and the Maximum Correlated Kurtosis Deconvolution (MCKD) based on the correlated kurtosis norm.
Both methods have been evaluated with respect to the influence of their parameters and the necessity for a careful choice of these was motivated. A short investigation on artificial BCG signals with additive white Gaussian noise indicated a good peak detection rate for SNRs higher than 4 dB. Furthermore, an evaluation with real clinical signals from one PPG and one BCG sensor, depicted a high peak detection performance and a precise interbeat interval estimation with less than 2 % mean error for almost all regarded cases. In general, the deconvolution methods have shown promising results for signal simplification to estimate periodic parameters.
Stefan Liebich, M.Sc.
Institute of Communication Systems
and Data Processing (IND)
RWTH Aachen University
Muffeter Weg 3a
52074 Aachen, Germany
E-mail: liebich@ind.rwth-aachen.de
Phone: +49 241 80 26982
Zdroje
[1] Wiggins R. A. Minimum entropy deconvolution. Geoexploration, 1978, 16 : 21–35.
[2] McDonald G. L., Zhao Q., and Zuo M. J. Maximum correlated Kurtosis deconvolution and application on gear tooth chip fault detection. Mechanical Systems and Signal Processing, 2012, 33 : 237–255.
[3] Brüser C., Winter S., and Leonhardt S. Robust inter-beat interval estimation in cardiac vibration signals. Physiological Measurement, 2013, 34(2):123–38.
[4] Brüser C., Kortelainen J. M., Winter S., Tenhunen M., Pärkkä J., Leonhardt S. Multi-channel data fusion for heart rate estimation utilizing infrasonic cardiac signals. IEEE Journal of Biomedical and Health Informatics, (accepted for publication / in print), 2014.
[5] Hansen N. Artefaktbehandlung in pervasiv gemessenen kardiographischen Signalen (German). Master thesis, RWTH Aachen University, 2013.
[6] Kortelainen J. M., Gils M. V., and Pärkkä J. Multichannel Bed Pressure Sensor for Sleep Monitoring. Computing in Cardiology, 2012, pages 313–316.
[7] Nickerson W. A. Developments in minimum entropy deconvolution. Master thesis, University of British Columbia, 1986.
[8] Ooe M. and Ulrych T. J. Minimum Entropy Deconvolution with an Exponential Transformation. Geophysical Prospecting, 1979, 27 : 458–473.
Štítky
BiomedicínaČlánek vyšel v časopise
Lékař a technika

2014 Číslo 2
Nejčtenější v tomto čísle
- Liposomy, jejich charakterizace, příprava a inkorporace do nanovlákenných nosičů
- Neparametrické statistické testy a jejich softwarová podpora
- Analýza povrchu magnetických mikročástic prostřednictvím mikroskopie atomárních sil
- Technical solutions of semi-closed circuits for heliox administration in spontaneously breathing patients with severe airway obstruction
Zvyšte si kvalifikaci online z pohodlí domova
Mazová zátka a její řešení
nový kurzVšechny kurzy