
THE TIME DELAY OF AIR/OXYGEN MIXTURE DELIVERY AFTER THE CHANGE OF SET FIO2: AN IMPROVEMENT OF A NEONATAL MATHEMATICAL MODEL
Authors:
Leoš Tejkl; Jakub Ráfl; Petr Kudrna
Authors place of work:
Department of Biomedical Technology, Faculty of Biomedical Engineering, Czech Technical University in Prague, Kladno, Czech Republic
Published in the journal:
Lékař a technika - Clinician and Technology No. 3, 2019, 49, 77-82
Category:
Original research
doi:
https://doi.org/10.14311
Summary
Oxygen therapy is an essential treatment of premature infants suffering from hypoxemia. Normoxemia is maintained by an adjustment of the fraction of oxygen (FiO2) in the inhaled gas mixture that is set manually or automatically based on peripheral oxygen saturation (SpO2). Automatic closed-loop systems could be more successful in controlling SpO2 than traditional manual approaches. Computer models of neonatal oxygen transport have been developed as a tool for design, validation, and comparison of the automatic control algorithms. The aim of this study was to investigate and implement the time delay of oxygen delivery after a change of set FiO2 during noninvasive ventilation support to enhance an available mathematical model of neonatal oxygen transport. The time delay of oxygen delivery after the change of FiO2 during the noninvasive nasal Continuous Positive Airway Pressure (nCPAP) ventilation support and during the High Flow High Humidity Nasal Cannula (HFHHNC) ventilation support was experimentally measured using an electromechanical gas blender and a physical model of neonatal lungs. Results show the overall time delay of the change in the oxygen fraction can be divided into the baseline of delay, with a typical time delay 5.5 s for nCPAP and 6.5 s for HFHHNC s, and an exponential rising phase with a time constant about 2–3 s. A delay subsystem was implemented into the mathematical model for a more realistic performance when simulating closed-loop control of oxygenation.
Keywords:
Respiratory system – computer model – oxygen support – neonatal oxygen transport – time delay
Introduction
Oxygen therapy is an essential treatment of premature infants suffering from hypoxemia due to the underde-velopment of the nervous, respiratory or cardiovascular system [1, 2]. Apart from the invasive mechanical ventilation, the inhaled gas mixture with an increased fraction of oxygen (FiO2) can be delivered by the noninvasive nasal Continuous Positive Airway Pressure (nCPAP) ventilation support or by the High Flow High Humidity Nasal Cannula (HFHHNC) [3]. Hypoxemia leads to insufficient oxygenation of tissues, hypoxia, and consequent slow development of vital organs. The oxygen therapy, on the other hand, brings the risk of hyperoxemia, which can negatively impact especially the eye retina and the lungs [1]. Traditionally, FiO2 is adjusted manually based on peripheral oxygen satu-ration (SpO2) measured by pulse oximetry. Not only is the manual control of oxygenation time consuming, but several studies documented that clinical staff often fails to keep SpO2 within the required range, sometimes even more than 50% of the time [4, 5]. On the contrary, automatic closed-loop systems that adjust FiO2 continu-ously could be more successful in controlling SpO2 and thus assuring required levels of oxygenation in prema-ture infants [6–8].
Mathematical models of the FiO2–SpO2 relation in a premature infant are used during the development of the automatic control algorithms [7, 9–11]. Morozoff et al. presented a computer model that was implemented in the Matlab–Simulink programming environment (Math-works, USA) and included four subsystems: air/oxygen blender, neonate, pulse oximeter, and controller [7, 9]. In the model, the time delay between the change of settings of the air/oxygen blender and an actual change of FiO2 in the airways was not included [7, 9, 10]. In an effort to enhance the available mathematical model of neonatal oxygen transport, the aim of this study was to investigate and implement the time delay of oxygen delivery after the change of set FiO2 during the non-invasive ventilation support.
Laboratory experiment
A laboratory experiment was performed to measure the time delay of oxygen delivery into the airways after the set fraction of oxygen (sFiO2) was changed in a gas blender of a ventilator. The experiment was conducted in laboratories of the Faculty of Biomedical Engineering in Kladno under standard laboratory conditions. The experiment did not require any live subjects.
Material and methods
The experiment consisted of measurements in two configurations: with the nCPAP ventilator MedinCNO (Medical Innovations GmbH, Germany) and with the HFHHNC ventilator Precision Flow Plus (Vapotherm Inc., USA). The ventilators were used as adjustable sources of the desired gas mixture due to their internal electromechanical gas blenders and digital user inter-face.
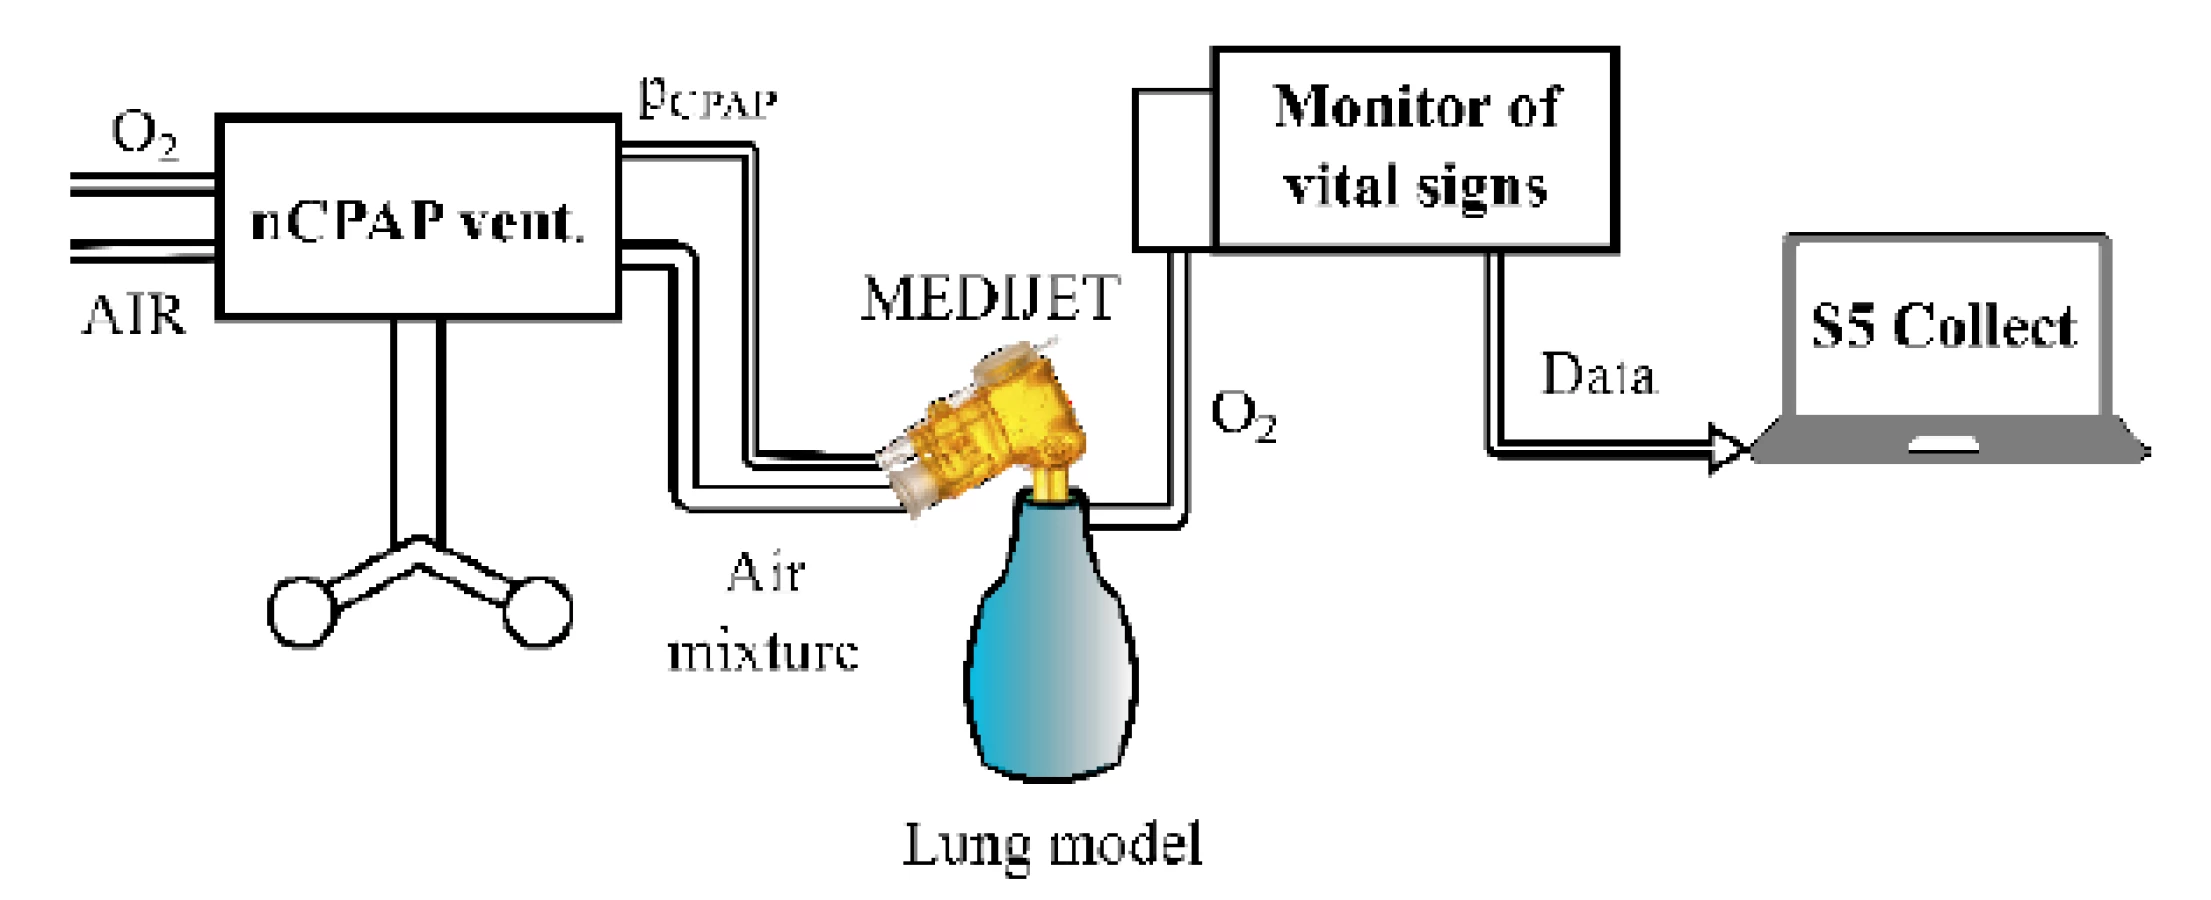
The setup of the experimental configuration with the nCPAP ventilator and the Medijet (Medical Innovations GmbH, Germany) nostril system is presented in Fig. 1. In the second experimental configuration, the HFHHNC ventilator with a system of nasal cannulas replaced the nCPAP ventilator and the nostril system. A small glass bottle was used as a physical model of the lungs due to the similarity of its mechanical properties—resistance and compliance—with the neonatal respiratory system. The volume of the glass bottle was 80 mL. The con-necting tubes for the ventilators and the monitor of vital signs, used in the experiment, were original equipment supplied by manufacturers of the devices. The measured fraction of oxygen (mFiO2) in the physical model was measured by E-COVX module of a patient monitor Carescape Monitor B650 (GE Healthcare, Finland). The overall delay of the response of the oxygen analyzer module was 2.9 s and consisted of the sampling delay 2.5 s and the rise time delay 0.4 s as specified by the operator’s manual. Data from the patient monitor were collected by the Datex-Ohmeda S/5 Collect software (GE Healthcare, Finland) and analyzed in Matlab R2018a (Mathworks, USA).
At the beginning of a measurement, the ventilator was connected to the oxygen and air outlets and all devices were switched on. Initially, sFiO2 was set to 21%. After mFiO2 was stable, sFiO2 was increased to 31% (the set fraction change: ∆sFiO2 = +10%). The time of the step change command was referred to as the zero time. After a new steady state of mFiO2 was reached, sFiO2 was set back to the original value of 21% (∆sFiO2 = −10%). The same procedure with the step change of sFiO2 from 21% to 51% (∆sFiO2 = +30%) and back to 21% (∆sFiO2 = −30%) followed. The measurements were repeated with the nCPAP and HFHHNC ventilators for various volumetric flow rates of the gas mixture in the ventilator circuit. The gas flow rates were 2–12 L/min with an increment of 2 L/min in case of the nCPAP system and 1–8 L/min with an increment of 1 L/min in case of the HFHHNC system.
The evaluated overall time delay of the change in the oxygen fraction was divided into two parts, Time 1 and Time 2, as shows an example in Fig. 2. Time 1 repre-sents the baseline of delay, where mFiO2 does not change, and it was measured from the zero time to the point where mFiO2 started to rise. Measured Time 1 was reduced by 2.5 s of the sampling delay of E-COVX module. Time 1 was evaluated for each ∆sFiO2 and gas flow rate.

The raising part of the mFiO2 signal was fitted with a modified exponential function

where t represents time (s). Values of the time constant τ and the parameters a and b were found by a curve fitting algorithm (Curve Fitting Toolbox, Matlab) to provide the best fit of the function to the measured mFiO2 waveform in the least-square sense. For each ∆sFiO2, the mean exponential curve was calculated as an average of exponential curves fitted to waveforms measured at individual gas flow rates. Time 2 that was used in consequent calculations was estimated as τ of the mean exponential curve. Calculated Time 2 was reduced by 0.4 s of the rise time delay of E-COVX module.
Time 1 and Time 2 were processed separately for the nCPAP ventilator system and for the HFHHNC ventilator system. The overall time delay of oxygen delivery after the change in the set oxygen fraction is the sum of Time 1 for the respective gas flow rate and ∆sFiO2 and of Time 2 for the respective ∆sFiO2.
Results
Table 1 summarizes Time 1 that represents the baseline of delay of the mFiO2 signal for various step changes of sFiO2 and various levels of gas flow rate. The sampling delay of the patient monitor was subtracted from the data before they were reported in the table. Median Time 1 was 5.5 s (IQR 4.5–7.5) for nCPAP and 6.5 s (IQR 2.5–8.5) for HFHHNC.

Table 2 reports parameters of the mean exponential curves calculated from the raising part of the mFiO2 signal for each ∆sFiO2, including the time constant τ used as an estimate of Time 2. The quality of the fit of the mean exponential curve to all the mFiO2 data related to the same ∆sFiO2 was estimated by the coefficient of determination R2. In all fits R2 was higher than 0.90 which indicates a good agreement between the model and the data. Generally, τ is similar for the positive and for the negative ∆sFiO2 in the case of the nCPAP system and for the positive ∆sFiO2 in the case of HFHHNC. An estimated τ for negative ∆sFiO2 in the case of HFHHNC is smaller. The range of parameters a and τ is consider-ably wider for HFHHNC data than for nCPAP data.
Implementation of the delay sub-system in the computer model
Based on the measured time delay of oxygen delivery into the airways, a delay subsystem was implemented in Simulink and integrated into the mathematical model of neonatal oxygen transport. A principal scheme of the delay subsystem is presented in Fig. 3.

The inputs to the delay subsystem are the current values of sFiO2 and gas flow rate in the model gas blender. The output of the delay subsystem is the current FiO2 of the inhaled gas mixture. The delay subsystem compares input sFiO2 in every step of the simulation with its previous value and, if a change in sFiO2 is detected, it calculates the length of the delay. The delay subsystem combines the baseline of delay (based on Time 1) and the rising delay (based on Time 2) of the FiO2 signal. We utilized the values of Time 1 and Time 2 that were calculated for the nCPAP ventilator.
An example of the function of the FiO2 delay subsystem is given in Fig. 5 which compares the set FiO2 and delayed FiO2 in the computer simulation.The baseline of delay is implemented using a time delay block available in Simulink. Six third-order polynomial functions were constructed that express the time delay as a function of gas flow rate and approximates the measured values of Time 1 in Table 1. For simulated ∆sFiO2 < 15%, the polynomial function applies that is constructed from values measured for ∆sFiO2 = 10%. For simulated ∆sFiO2 > 25%, the polynomial function applies that is constructed from values measured for ∆sFiO2 = 30%. For simulated 15% ≤ ∆sFiO2 ≤ 25%, the respective polynomial function was constructed from averaged values measured for ∆sFiO2 = 10% and ∆sFiO2 = 30%. An analogous procedure applies for negative values of ∆sFiO2. Outliers were excluded from the approximations. The polynomial functions used for 15% ≤ ∆sFiO2 ≤ 25% and −25% ≤ ∆sFiO2 ≤ −15% are shown in Fig. 4.
The rising delay is implemented using a dynamic rate limiter block that simplifies the exponential growth or decrease in FiO2 by a linear trend with its slope set as the magnitude of the simulated ∆sFiO2 divided by the time constant derived as an average of measured values that were presented in Table 2. In other words, the overall simulated rising delay equals the time constant. The differences among measured values of the time constant in Table 2 are smaller than the used sampling rate of 1 Hz, which allows averaging. The averaged time constant value is 2.5 s for the positive ∆sFiO2 and 2.6 s for the negative ∆sFiO2. Thus, the rising delay approximates the upper boundary of the measured rate of change of FiO2 and—as implemented—it does not depend on the current gas flow rate. The chosen approach is illustrated in Fig. 2, which shows the major part of the FiO2 increase within Time 2, i.e. the time constant.

Discussion
In this work we focused on the time delay of oxygen delivery after the change of set FiO2 in respiratory support systems with internal electronic gas blenders. Our laboratory experiment showed that the time delay should not be neglected in the developed mathematical model of neonatal oxygen transport as it is comparable with the time constants of the physiological processes simulated by the model. This is especially important when the model is used for testing of a closed-loop configuration where the oxygen fraction is auto-matically adjusted according to how the current SpO2 agrees with the desired SpO2 range.
In Table 1 we can see that with an increased gas flow rate the time delay decreases. Also, at lower gas flow rates the FiO2 increase takes longer time than the FiO2 decrease. At high flow rates, the time delay is similar for both the FiO2 increase and decrease. Table 2 shows τ smaller for negative ∆sFiO2 in the case of HFHHNC when compared to the positive and the negative ∆sFiO2 in case of the nCPAP ventilation support and to the positive ∆sFiO2 in case of HFHHNC. An actual difference was perhaps overemphasized due to the com-bination of a low sampling rate (1 Hz) and the sub-traction of the measurement delay (0.4 s). Wider ranges of a and τ in the case of HFHHNC measurements suggests lower accuracy of HFHHNC settings during the experiment and less reliable data. Nevertheless, it still seems that the HFHHNC system reacts a little faster to the decrease of FiO2 than the nCPAP system. That should be considered when designing precise simulation models or control systems.
The time delay we measured can be compared with patient data published by Fathabadi et al. [12] and in Krone’s master thesis [11]. Fathabadi et al. reported the median of the time delay 22 s (IQR 8–40 s) during the FiO2 increase and 34 s (IQR 17–67 s) during the FiO2 decrease for various gas flow rates and variable magnitude of FiO2 change. Krone reported the time delay for the rising phase 25–105 s. In our mathematical model a simulation run in the nCPAP mode with the gas flow rate 5 L/min showed the overall delay 19.5 s of a FiO2 increase from 28% to 32%. However, Fathabadi’s and Krone’s delays include the delay of oxygen distribution to the lungs and the physiological delay of oxygen transport in the blood. Our measure-ment involves only the time delay in the mechanical part of oxygen delivery systems and does not include the variability of a neonatal organism.
The time delay presented in Table 1 and demonstrated in Figure 4 shows irregularities in the decreasing trend. The result could reflect a limited sensitivity of the oxygen sensor in low gas flow rates. Another limitation of the experiment is the sampling frequency 1 Hz of the Datex Ohmeda S/5 Collect software, which causes sharp step changes in the recorded mFiO2 signal.


The implementation of the delay subsystem in the mathematical model is based on the measurements taken for the nCPAP system. The time delay is divided into the baseline of delay and the rising phase. The rising phase is simplified based on the finding that after the baseline of delay the major changes in the actual FiO2 level occurred within the interval of 2–3 s, regardless of the magnitude of the change.
Conclusion
In this work we presented the laboratory experiment to measure the time delay of oxygen delivery after the change of set FiO2 during the nCPAP or HFHHNC respiratory support. The experimentally measured data allowed an improvement of the mathematical model of neonatal oxygen transport by implementing the delay subsystem. Our enhancement of the existing model should increase its accuracy and usability as a tool for testing different approaches to oxygenation control of premature neonates.
Acknowledgement
The authors thank Thomas E. Bachman and Karel Roubik for their help with the project of the mathematical model of neonatal oxygen transport. The research was supported by the Czech Technical University in Prague, grant SGS17/203/OHK4/3T/17 and grant SGS19/202/OHK4/3T/17.
Ing. Leoš Tejkl
Department of Biomedical Technology
Faculty of Biomedical Engineering
Czech Technical University in Prague
nám. Sítná 3105, CZ-272 01 Kladno
E-mail: tejklleo@fbmi.cvut.cz
Phone: +420 734 508 096
Zdroje
-
Polin R, Fox WW. Fetal and neonatal physiology. Philadelphia: Saunders, 1992. ISBN 0-7216-3514-8.
-
Tin W, Gupta S. Optimum oxygen therapy in preterm babies. Arch Dis Child Fetal Neonatal Ed. 2007;92(2):F143-F147. DOI: 10.1136/adc.2005.092726
-
Hasan A. Understanding mechanical ventilation: A practical handbook. 2nd ed. New York: Springer, 2010. ISBN 978-184-8828-681.
-
Hagadorn JI, Furey AM, Nghiem TH, Schmid CH, Phelps DL, Cole CH. Achieved versus intended pulse oximeter saturation in infants born less than 28 weeks' gestation: The AVIOx study. Pediatrics. 2006;118(4):1574-1582. DOI: 10.1542/peds.2005-0413
-
Clarke A, Yeomans E, Elsayed K, Medhurst. A randomised crossover trial of clinical algorithm for oxygen saturation targeting in preterm infants with frequent desaturation episodes. Neonatology. 2015;107(2):130-136. DOI: 10.1159/000368295
-
Mitra S, Singh B, El-Naggar W, McMillan DD. Automated versus manual control of inspired oxygen to target oxygen saturation in preterm infants: A systematic review and meta-analysis. J Perinatol. 2018;38(4):351-360. DOI: 10.1038/s41372-017-0037-z
-
Morozoff EP, Saif M. Oxygen therapy control of neonates: Part II – Evaluating manual, PID and fuzzy logic controller designs. Control Intell Syst. 2008;36(3):238-249.
-
Claure N, Gerhardt T, Everett R, Musante G, Herrera C, Bancalari E. Closed-loop controlled inspired oxygen concen-tration for mechanically ventilated very low birth weight infants with frequent episodes of hypoxemia. Pediatrics. 2001;107(5): 1120-1124. DOI: 10.1542/peds.107.5.1120
-
Morozoff EP, Saif M. Oxygen Therapy Control of Neonates – Part I: A Model of Neonatal Oxygen Transport. Control Intell Syst. 2008;36(3):227-237.
-
Morozoff EP. Modelling and fuzzy logic control of neonatal oxygen therapy [master’s thesis]. Burnaby: Simon Fraser University, Department of Engineering Science; 1996.
-
Krone B. Modelling and control of arterial oxygen saturation in premature infants [master’s thesis]. Columbia: University of Missouri; 2011.
-
Fathabadi OS, Gale TJ, Lim K, Salmon P, Dawson JA, Wheeler KI, Olivier JC, Dargaville PA. Characterisation of the oxy-genation response to inspired oxygen adjustments in preterm infants. Neonatology. 2015;109(1):37-43. DOI: 10.1159/000440642
Štítky
BiomedicínaČlánek vyšel v časopise
Lékař a technika

2019 Číslo 3
Nejčtenější v tomto čísle
- THE TIME DELAY OF AIR/OXYGEN MIXTURE DELIVERY AFTER THE CHANGE OF SET FIO2: AN IMPROVEMENT OF A NEONATAL MATHEMATICAL MODEL
- GOLF SWING VARIABILITY IN ELITE FEMALE JUNIOR GOLFERS
- EFFECT OF AGE AND GENDER ON ARTICULATION OF VOICED AND VOICELESS STOP CONSONANTS IN CZECH
- APPLICATION OF THE ARTEC EVA SCANNER FOR ORTHOTICS IN PRACTICE
Zvyšte si kvalifikaci online z pohodlí domova
Mazová zátka a její řešení
nový kurzVšechny kurzy