
Microhomology-Mediated Mechanisms Underlie Non-Recurrent Disease-Causing Microdeletions of the Gene or Its Regulatory Domain
Genomic disorders are often caused by recurrent copy number variations (CNVs), with nonallelic homologous recombination (NAHR) as the underlying mechanism. Recently, several microhomology-mediated repair mechanisms—such as microhomology-mediated end-joining (MMEJ), fork stalling and template switching (FoSTeS), microhomology-mediated break-induced replication (MMBIR), serial replication slippage (SRS), and break-induced SRS (BISRS)—were described in the etiology of non-recurrent CNVs in human disease. In addition, their formation may be stimulated by genomic architectural features. It is, however, largely unexplored to what extent these mechanisms contribute to rare, locus-specific pathogenic CNVs. Here, fine-mapping of 42 microdeletions of the FOXL2 locus, encompassing FOXL2 (32) or its regulatory domain (10), serves as a model for rare, locus-specific CNVs implicated in genetic disease. These deletions lead to blepharophimosis syndrome (BPES), a developmental condition affecting the eyelids and the ovary. For breakpoint mapping we used targeted array-based comparative genomic hybridization (aCGH), quantitative PCR (qPCR), long-range PCR, and Sanger sequencing of the junction products. Microhomology, ranging from 1 bp to 66 bp, was found in 91.7% of 24 characterized breakpoint junctions, being significantly enriched in comparison with a random control sample. Our results show that microhomology-mediated repair mechanisms underlie at least 50% of these microdeletions. Moreover, genomic architectural features, like sequence motifs, non-B DNA conformations, and repetitive elements, were found in all breakpoint regions. In conclusion, the majority of these microdeletions result from microhomology-mediated mechanisms like MMEJ, FoSTeS, MMBIR, SRS, or BISRS. Moreover, we hypothesize that the genomic architecture might drive their formation by increasing the susceptibility for DNA breakage or promote replication fork stalling. Finally, our locus-centered study, elucidating the etiology of a large set of rare microdeletions involved in a monogenic disorder, can serve as a model for other clustered, non-recurrent microdeletions in genetic disease.
Published in the journal:
. PLoS Genet 9(3): e32767. doi:10.1371/journal.pgen.1003358
Category:
Research Article
doi:
https://doi.org/10.1371/journal.pgen.1003358
Summary
Genomic disorders are often caused by recurrent copy number variations (CNVs), with nonallelic homologous recombination (NAHR) as the underlying mechanism. Recently, several microhomology-mediated repair mechanisms—such as microhomology-mediated end-joining (MMEJ), fork stalling and template switching (FoSTeS), microhomology-mediated break-induced replication (MMBIR), serial replication slippage (SRS), and break-induced SRS (BISRS)—were described in the etiology of non-recurrent CNVs in human disease. In addition, their formation may be stimulated by genomic architectural features. It is, however, largely unexplored to what extent these mechanisms contribute to rare, locus-specific pathogenic CNVs. Here, fine-mapping of 42 microdeletions of the FOXL2 locus, encompassing FOXL2 (32) or its regulatory domain (10), serves as a model for rare, locus-specific CNVs implicated in genetic disease. These deletions lead to blepharophimosis syndrome (BPES), a developmental condition affecting the eyelids and the ovary. For breakpoint mapping we used targeted array-based comparative genomic hybridization (aCGH), quantitative PCR (qPCR), long-range PCR, and Sanger sequencing of the junction products. Microhomology, ranging from 1 bp to 66 bp, was found in 91.7% of 24 characterized breakpoint junctions, being significantly enriched in comparison with a random control sample. Our results show that microhomology-mediated repair mechanisms underlie at least 50% of these microdeletions. Moreover, genomic architectural features, like sequence motifs, non-B DNA conformations, and repetitive elements, were found in all breakpoint regions. In conclusion, the majority of these microdeletions result from microhomology-mediated mechanisms like MMEJ, FoSTeS, MMBIR, SRS, or BISRS. Moreover, we hypothesize that the genomic architecture might drive their formation by increasing the susceptibility for DNA breakage or promote replication fork stalling. Finally, our locus-centered study, elucidating the etiology of a large set of rare microdeletions involved in a monogenic disorder, can serve as a model for other clustered, non-recurrent microdeletions in genetic disease.
Introduction
Copy number variations (CNVs) are defined as DNA segments that are present at a variable copy number in comparison with a reference genome such as a deletions, duplications or insertions [1], [2]. In recent years it has become clear that CNVs are a major source of genetic diversity, competing with the single nucleotide variants (SNVs) as the main source of genetic variation between individuals. With the use of several technologies such as array-based comparative genomic hybridization (aCGH), single nucleotide polymorphism (SNP) genotyping and next-generation sequencing, numerous CNVs have been identified during the last decade [3]–[11]. Many of the identified CNVs represent benign polymorphic variants; however, CNVs can lead to a genetic disease when for instance a dosage-sensitive gene is affected. Such genetic diseases caused by genomic rearrangements are defined as genomic disorders [12]–[15]. The genomic rearrangements causing these disorders can be recurrent sharing a common interval and size, and having clustered breakpoints in multiple different subjects. These rearrangements are mostly the result of nonallelic homologous recombination (NAHR) between low-copy repeats (LCRs) or segmental duplications (SDs), a recombination-based mechanism [16]. In contrast, non-recurrent, locus-specific rearrangements can vary in size and have scattered breakpoints, thus suggesting the absence of a recombination hotspot. Only recently, several mechanisms causing non-recurrent genomic rearrangements have been proposed such as (i) non-replicative repair mechanisms: non-homologous end-joining (NHEJ) [17], microhomology mediated end-joining (MMEJ) [18] and NAHR between repetitive elements (for example, Alu or L1) [19], [20]; and (ii) replicative-based repair mechanisms: fork stalling and template switching (FoSTeS) [21], microhomology-mediated break-induced replication (MMBIR) [22], serial replication slippage (SRS) [23] and break-induced SRS (BISRS) [24]. Interestingly, as genomic rearrangements are assumed not to be random events, it has been proposed that the local genomic architecture other than LCRs or SDs stimulates these mechanisms by predisposing to CNV formation [25]. Indeed, several studies have revealed repetitive elements, sequence motifs or non-B DNA conformations overlapping with or located in the vicinity of CNV breakpoints. Another genomic characteristic frequently observed at the junctions is microhomology. These studies confirm that the majority of non-recurrent, locus-specific, pathogenic CNVs are not caused by NAHR, but rather by a diverse range of mechanisms [26]–[35]. The conclusions of these studies are however mostly based on a small number of sequenced junctions. Therefore, it was our aim to investigate which mechanisms underlie a large, unique set of locus-specific non-recurrent genomic rearrangements causing the rare developmental disorder blepharophimosis-ptosis-epicanthus inversus syndrome (BPES) [MIM #110100]. This disorder is characterized by a complex eyelid malformation with or without ovarian dysfunction [36], [37]. BPES is an autosomal dominant disorder caused by genetic defects of the FOXL2 locus [38]–[44]. Even though intragenic mutations are most prevalent (81%), an important fraction of BPES cases is caused by heterozygous deletions. These deletions can encompass the FOXL2 gene (12%) or can be located outside the FOXL2 transcription unit removing potential regulatory elements such as conserved non-coding sequences (CNCs) and the long non-coding RNA (lncRNA) PISRT1, necessary for the correct transcription of FOXL2 (5%) [41]–[44]. Here, we study 32 FOXL2 encompassing and 10 regulatory deletions, respectively. As the observed deletions range from 1.4 kb to 5.51 Mb and the breakpoint locations are heterogeneous, a common deletion mechanism such as NAHR mediated by LCRs can be excluded. In order to unravel the underlying deletion mechanisms, we analyzed the extent of microhomology at the characterized breakpoints and explored the presence of repetitive elements, non-B DNA conformations and sequence motifs as well. We found that microhomology was present in 91.7% of 24 delineated breakpoint junctions. Moreover, particular genomic architectural features were found in all breakpoint regions. In conclusion, we propose that the majority of these deletions are caused by microhomology-mediated mechanisms such as MMEJ or the replicative-based repair mechanisms FoSTeS, MMBIR, SRS and BISRS. Finally, the genomic architecture might stimulate the formation of these rare deletions by increasing the susceptibility for DNA breakage or promote replication fork stalling.
Results
Delineation of the deletions
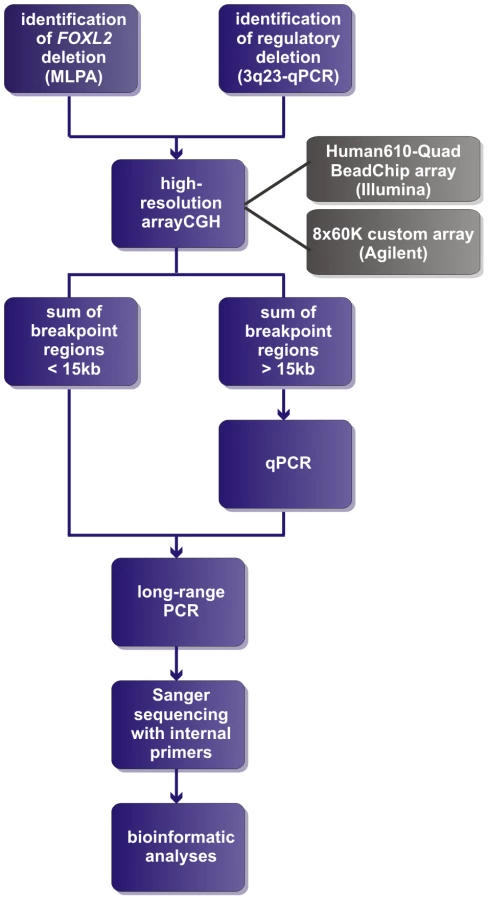
Two of the 42 deletions were already delineated at base-pair resolution in previous studies [42], [43]. For the delineation of the remaining 40 deletions a strategy was followed as described in Figure 1. In short, a combination of aCGH, qPCR, long-range PCR and Sanger sequencing was applied. Based on the aCGH and qPCR analyses, long-range PCR was performed for 35 deletions of which 22 resulted in a specific junction product. The inability to obtain a product for the remaining 13 deletions may relate to the complexity of the genomic sequence at these junctions. To overcome this, several primer combinations were used however this was without success. The 22 specific junction products underwent Sanger sequencing to determine the exact physical location of the breakpoints. The FOXL2 encompassing deletions ranged from 1.4 kb to 5.51 Mb while the regulatory deletions ranged from 7.4 kb to 3.02 Mb, including one complex deletion consisting of two deletions interspersed with a segment without copy number variation (namely deletion F, Figure S1). Overall, we were able to characterize the exact breakpoints of 16 FOXL2 encompassing (1–16) and 8 regulatory deletions (A–H) using this strategy (Figure 2).

Bioinformatic analyses
The breakpoints of the locus-specific, non-recurrent deletions were subjected to an extensive bioinformatic analysis to explore underlying mechanisms and to assess the contribution of the genomic architecture. To this end, we analyzed the extent of microhomology at the breakpoints and investigated the presence of repetitive elements, sequence motifs and non-B DNA conformations. An overview of the output of the different bioinformatic analyses can be found in Table 1. Visual representations of the breakpoint regions with the observed local genomic architecture of 5 selected deletions are shown in Figure 3 and of the remaining deletions in Figure S2.


Microhomology
Microhomology is defined as one or more base pairs (bp) of perfectly matching sequence shared between the proximal and distal reference sequences surrounding the breakpoints. Also, it is an important hallmark of several mechanisms [14]. The extent of microhomology was evaluated using multiple sequence alignments (Figure 4, Figure S3). Of the 24 deletion junctions analyzed, 22 (91.7%) displayed microhomology between their breakpoints, ranging from 1 bp up to 66 bp. Only two deletions (deletion A and 6) showed a perfect transition at their junction of which one (deletion 6) was accompanied by a deletion of one bp. To exclude whether the observed microhomology at the breakpoints did just occur by chance, we compared our results against a random control population of 500 human genomic sequences representing artificial breakpoint regions. Using a Fisher's exact test we observed that microhomology is significantly enriched (p = 2.28×10−08) at our studied breakpoints. In addition, using a Wilcoxon rank sum test we observed that the distribution of microhomology in our breakpoints significantly differed (p = 2.21×10⁻¹²) from the random control population (Figure 5). This distribution pattern is in accordance with the ones observed by previous studies [45], [46].


Repetitive elements
The Repeat Masker track in the UCSC genome browser was used to analyze the presence of known repetitive elements intersecting the breakpoints. A repetitive element was found at 31 of 48 breakpoints (64.6%) (Table 1). In the random control population a repetitive element was observed to intersect with 236 of 500 breakpoints (47.2%). Using a Fisher's exact test, we could conclude that our breakpoints are indeed significantly enriched with repetitive elements (p = 2.4×10⁻²). Interestingly, Alu elements were observed about three times more at our breakpoints in comparison with the control population (29.2% versus 10.6%). Indeed, when performing a Fisher's exact test with Bonferroni correction, we observed a significant enrichment of Alu elements at our breakpoints (p = 0.001). The frequency of L1-elements does not significantly differ from the control population (25% versus 16.2%; p = 0.156). In 13 of 24 deletions (54.2%), a repetitive element was observed at both breakpoints. Of these, 9 had repetitive elements belonging to the same class consisting of 6 Alu-Alu and 3 L1PA-L1PA combinations. In these cases, a Blast2 analysis was performed to determine the percentage of sequence identity between the repetitive elements. The highest percentage of sequence identity was observed between two L1PA3 elements in deletion 16 (96%). The lowest percentage of sequence identity was observed between an AluSx3 and an AluSz6 in deletion 14 (77%). The percentages for the other 7 deletions can be found in Table 1.
Sequence motifs
The well-known capacity of sequence motifs to predispose to DNA breakage led us to analyze the nucleotide context of the breakpoint regions for the presence of 40 known sequence motifs [47]. An overview of the results can be found in Table S2. This analysis was also performed for the random control population. In total, 26 of 40 sequence motifs were present in one or more breakpoint regions. Only the proximal breakpoint region of deletion 4 did not contain a sequence motif. In comparison with the random control population, we observed that none of the motifs was significantly overrepresented in our breakpoint regions. In addition to individual motifs, we also analyzed if the overall density of sequence motifs might be increased. For this purpose, we counted the number of motifs present in each breakpoint region for the studied deletions and the random control population. In our deletions we observed a mean of 9.69 motifs per breakpoint region while a mean of 7.86 was observed for the random control population. However, the overall density of sequence motifs does not differ significantly (Wilcoxon rank sum test, p = 0.207). No new sequence motifs could be found in our deletion cohort.
Non-B DNA conformations
Different bioinformatic tools were applied to determine the presence of sequences capable of forming non-B DNA conformations. Of note, genomic architecture resulting from DNA conformational changes, but not the primary sequence information, is crucial in these processes [48]. In total, a sequence capable of forming a non-B DNA structure could be identified in 14 of the 48 breakpoints (29.2%). Such sequences were identified in 107 of the 500 (21.4%) breakpoint regions of the random control population indicating that the frequency of sequences capable of forming a non-B DNA structure does not differ significantly between both populations (Fisher's exact test, p = 0.208). The comparison with the random control population was made for the individual non-B DNA conformations as well. The frequency of slipped hairpin structures and left-handed Z-DNA does not differ significantly from those observed in the control population (Fisher's exact test, p>0.05). However, for the tetraplex structures a significant overrepresentation could be observed (Fisher's exact test, p = 0.006).
Notably, four deletions have sequences capable of forming non-B DNA conformations present in both breakpoint regions (Table S3). Even more remarkable is that the non-B DNA conformations are from the same class in these deletions. Deletion 14 has a direct repeat in both breakpoint regions, while an oligo(G)n tract is observed in both breakpoint regions of deletions 1, 2 and 7 respectively.
Interestingly, of the 14 breakpoint regions harboring a sequence capable of forming non-B DNA conformations, only 1 breakpoint region belonged to a regulatory deletion (deletion H). This means that such sequences are significantly overrepresented in the breakpoint regions of the FOXL2 encompassing deletions (Fisher's exact test, p = 0.018).
Discussion
Microhomology-mediated mechanisms cause deletions of the FOXL2 locus
Non-recurrent CNVs can be caused by a large spectrum of different mechanisms which can be grossly classified as non-replicative - (NAHR, NHEJ and MMEJ) or replicative-based repair mechanisms (FoSTeS, SRS, BISRS and MMBIR). If successful, the only reminder of a rearrangement is a unique breakpoint signature which can be used as the key to unraveling the underlying mechanism. NAHR causes rearrangements by misalignment and subsequent unequal cross-over between nonallelic sequences in meiosis or mitosis. For NAHR to occur, segments of a minimal length sharing extremely high similarity or sequence identity - named minimal efficient processing segments (MEPS) - between the homologous recombination substrates are required. These are mostly LCRs but can also be L1s, Alu elements or pseudogenes [49]. Breakpoints of rearrangements inferred by NAHR should therefore be intersected by these elements. NHEJ is utilized by human cells to repair two-ended, double stranded DNA breaks. NHEJ is characterized by two main features. First, NHEJ does not require the presence of substrates with extended homology but can be facilitated by the presence of microhomology (1–4 bp). Second, NHEJ can leave an ‘information scar’ at the joint point comprising of the loss or insertion of several random nucleotides [17]. An alternative pathway of NHEJ is called MMEJ. The difference between these two is that while the presence of microhomology is optional in NHEJ, it is a requirement for MMEJ to occur. Also, MMEJ uses longer stretches of microhomology (5–25 bp) than those used in NHEJ [50]. Two similar models, FoSTeS and SRS, were proposed to explain the sequence complexity sometimes seen at breakpoints. According to these models, the DNA replication fork can stall; the lagging strand consequently disengages from the original template, switches to another replication fork and then restarts DNA synthesis on the new fork by priming it via the microhomology between the switched template site and the original fork. Switching to a downstream replication fork would therefore result in a deletion, while upstream switching results in a duplication [21], [23]. Although both models share the same hypothesis of fork template switching, a difference can be observed. While the SRS model assumes that replication slippage occurs on closely adjacent sites and causes DNA rearrangements of small sizes, the FoSTeS model emphasizes that the template switch can occur over long distances (even 100 kb or megabase size) and therefore cause DNA rearrangements on a much larger scale [49]. Further molecular details of FoSTeS and SRS were extended in two more generalized models, namely MMBIR and BISRS. The major feature distinguishing these generalized models is that they are initiated by a single-end, double strand DNA break generated by a collapsed fork to expose a 3′ end that can be used to prime synthesis at a distant fork [22], [24]. All of these replicative-based repair mechanisms do not only cause complex rearrangements but can also form simple rearrangements where the evidence for sequence complexity has been removed during the rearrangement process. In addition, these mechanisms may be stimulated by the local genomic architecture. Consequently, the only option to elucidate the mechanism behind a CNV, is to delineate it at base-pair resolution and examine the sequence context of the breakpoints. Of our deletions of the FOXL2 locus, 24 could be delineated at the base-pair level. Using several bioinformatics tools, we could examine the sequence context of these deletions, define their breakpoint signature and deduce the most likely underlying mechanism. Remarkably, no major differences were observed between the mechanisms underlying FOXL2 encompassing and regulatory deletions. Based on the observed breakpoint signatures, the deletions could be classified in three different groups. The first small group contains only two deletions (deletion A and 6) both of which have a perfect transition at the junction. Additionally, the loss of a T nucleotide at the junction of deletion 6 represents an information scar pointing to NHEJ as potential mechanism. The 9 deletions of the second group are characterized by the presence of repetitive elements of the same family at both breakpoints (deletion G, H, 7, 8, 9, 11, 13, 14 and 16) which could indicate that NAHR has caused these deletions like observed in other studies [28], [30], [32], [34], [35]. An Alu-Alu-mediated NAHR might have resulted in 6 deletions while the other three deletions probably result from a L1-L1-mediated NAHR. However, the level of sequence identity is probably too low in most deletions for NAHR to occur. Three deletions do have a high percentage of sequence identity over a long length between L1 elements (Table 1). These L1 elements could therefore provide the MEPS required for efficient NAHR. On the other hand, microhomology ranging from 5 bp to 66 bp is observed at the junctions of these 9 deletions, suggesting that a replicative-based repair mechanism may have formed these deletions instead of NAHR [51]. It has also been suggested that repetitive elements may represent more difficult sequences to replicate leading to an increased chance of replication fork stalling or collapsing [46]. Alternatively, formation of secondary structures within or between repetitive elements may contribute to generate DSBs and further contribute to genomic instability involving those elements. So the presence of a repetitive element may initiate a replicative-based repair mechanism while the observed microhomology then facilitates the template switching and serves as the priming site in the second replication fork. The above assumptions are purely speculative though and further experimental evidence is needed to substantiate them. Another possible mechanism underlying these deletions is MMEJ which requires microhomology of 5 bp or more. It is however currently impossible to distinguish between replicative-based repair mechanisms and MMEJ, as they all share the breakpoint signature, namely microhomology at the junction. Nonetheless, because none of the junctions have an information scar, replicative-based repair mechanisms are favored. The 13 deletions of the third group (deletion B, C, D, E, F, 1, 2, 3, 4, 5, 10, 12 and 15) also have microhomology at their junction but as opposed to the second group they only have a repetitive element at one of their breakpoints or in case both breakpoints intersect with a repetitive element, the elements are from a different family. The microhomology in this third group ranges from 1 bp to 5 bp. Like the deletions of the second group, these 13 deletions also could have resulted from NHEJ, MMEJ or replicative-based repair mechanisms but again favoring the latter because no information scar was present at the junctions. Nonetheless, NHEJ or MMEJ could still have occurred, where a distinction can be made between both based on the length of microhomology. Microhomology of 1–4 bp may facilitate NHEJ (deletions C, D, E, F, 2, 3, 4, 5, 10, 12 and 15) [17] while longer microhomology stretches of 5 bp or more are used by MMEJ (deletions B and 1) [50]. Interestingly, a substitution of one and two nucleotides was observed near the junctions of deletion 3 and E respectively. None of these substitutions are described as a known SNP and they originate most likely as a side-effect of the underlying mechanism. The majority of these mechanisms are based on the occurrence of DSBs and the subsequent repair of these breaks for the formation of genomic rearrangements. It has been described that the repair polymerases recruited for these processes, are more prone to errors and thus may incorporate wrong bases during DNA synthesis [52], [53]. These mutations are referred to as break-repair-induced mutations [54].
In conclusion, in this set of junctions of non-recurrent, locus-specific deletions involving the FOXL2 locus, we propose that the majority of deletions are caused by the microhomology-mediated mechanisms MMEJ, FoSTeS, MMBIR, SRS or BISRS. This conclusion is in accordance with the observations of the most recent similar locus-specific studies [31]–[35]. Moreover, microhomology is observed at the majority of sequenced junctions in both locus-specific and genome-wide benign or pathological CNVs supporting the role of replicative-based repair mechanisms in CNV formation [55]. Less recent studies conversely suggest NHEJ to be the major mechanism in causing non-recurrent deletions. These studies were however performed before replicative-based repair mechanisms were reported [26]–[30]. Interestingly, when revisiting the data of these studies, microhomology is observed at more than half of these junctions indicating that replicative-based repair mechanisms could potentially also occur (Table S4). Furthermore, based on our results we hypothesize that other unique, non-recurrent, clustered microdeletion cohorts [56]–[60] are potentially also caused by a variety of microhomology-mediated mechanisms such as MMEJ, FoSTeS, MMBIR, SRS and BISRS.
Local genomic architecture stimulates formation of non-recurrent deletions
The role of genomic architectural features in the formation of recurrent CNVs is well established as flanking LCRs or SDs act as homologous recombination substrates for an NAHR or ectopic recombination event mediated by these homologous sequence substrates. However, the role of genome architecture in non-recurrent rearrangements is currently still unclear. Studies like ours therefore contribute to the elucidation of a potential role of the genomic architecture and help delineate what those potential features may be. The presence of repetitive elements, sequences forming non-B DNA conformations and sequence motifs may lead to genomic instability and subsequently genomic rearrangements by promoting the formation of DSBs or by stalling the replication [48], [61]–[64]. Such genomic architectural features were observed in all breakpoint regions but only repetitive elements within particular Alu elements were found to be significantly enriched. To investigate whether this enrichment was not a bias, we compared the fraction of Alu elements in the CNV region with that in chromosome 3 and in the entire genome. Indeed, the fraction of sequence length occupied by Alu elements in the region containing the deletions (chr3 : 129230494–148645311, hg19) is only 8.32% which is comparable to the fraction found for chromosome 3 (8.84%) and the human genome 10.6% [65]. Overall, this indicates that Alu elements do occur more frequently at the breakpoints compared to the genome average. Although this observation is in accordance with a similar study by Vissers et al. [46], the mechanistic significance of this is currently unknown. Oligo(G)n tracts capable of forming tetraplex structures also displayed a significant overrepresentation in the breakpoint regions. Interestingly, both breakpoint regions of deletions 1, 2 and 7 display an oligo(G)n tract while deletion 14 has direct repeats in both breakpoint regions which could indicate that 2 DSBs have occurred in these deletions, favoring NHEJ or MMEJ. Conversely, the presence of the non-B DNA conformations in these and the other deletions can cause collapsing of the replication fork. Replicative-based repair mechanisms can therefore not be ruled out. Interestingly, sequences capable of forming non-B DNA conformations were observed more frequently in the breakpoints of the FOXL2 encompassing deletions than in those of the regulatory deletions suggesting that the genomic architecture differs between both types of deletions. This might explain the higher prevalence of deletions encompassing FOXL2.
General conclusion
We propose that the majority of non-recurrent deletions of the FOXL2 locus are caused by microhomology-mediated mechanisms like MMEJ, FoSTeS, MMBIR, SRS or BISRS. Finally, the genomic architecture might drive the formation of these rare, locus-specific deletions by increasing the susceptibility for DNA breakage or promote DNA replication fork stalling. The insights from our locus-centered study investigating a large set of breakpoint sequences from non-recurrent, gene encompassing and regulatory microdeletions causing monogenic disease, can therefore serve as a paradigm for other clustered, non-recurrent microdeletions involved in genetic disease.
Methods
Ethics statement
This study was conducted following the tenets of Helsinki and approved by the institutional review board (99/250).
Patients
Forty-two consenting BPES patients with a FOXL2 encompassing (32) or regulatory deletion (10) were enrolled in this study. All patients were clinically diagnosed with BPES based on the presence of minimal three out of the four typical BPES features. Patients can be subdivided based on the genetic center where they were molecularly diagnosed. The largest group of deletions was diagnosed at the Center for Medical Genetics at Ghent University (CMGG) in Belgium. This group contains 25 FOXL2 encompassing deletions and 10 regulatory deletions. The second group of 7 FOX2 encompassing deletions was diagnosed at the Instituto de Genética Médica y Molecular (INGEMM) at the Hospital Universitario La Paz in Spain. Molecular diagnosis of all FOXL2 encompassing deletions was performed using a commercially available multiplex ligation-dependent probe amplification (MLPA) mix (P054, MRC-Holland, Amsterdam, the Netherlands) according to the manufacturer's instructions. The regulatory deletions located outside the FOXL2 transcription unit were identified using a combined approach of microsatellite analysis and a custom-made quantitative PCR assay in the FOXL2 region (qPCR-3q23) as previously described [42], [43].
High-resolution aCGH
Two different array-based methods were used: (i) custom high-resolution 8×60 K Agilent microarrays at the CMGG, and (ii) genome-wide Illumina Human610-Quad BeadChip arrays at the INGEMM. The custom high-resolution 8×60 K Agilent microarray was designed using the online design tool eArray (Agilent Technologies), targeting a region of 10 Mb around FOXL2 (chr3 : 133517310–143517310; UCSC, Human Genome Browser, hg19) consisting of 52,800 probes spaced at an average density of 200 bp. Hybridizations were performed according to manufacturer's instructions with minor modifications [66]. The results were subsequently visualized in arrayCGHbase [67]. The genome-wide Illumina Human610-Quad BeadChip arrays contain 620,901 tag SNPs and have an average resolution of 4.7 kb. Hybridization and subsequent data-analysis was performed as previously described [44]. The proximal and distal breakpoint regions were defined as the regions between the last proximal normal and first deleted probe proximally, and the last deleted and first distal normal probe, respectively.
Quantitative PCR (qPCR)
If the sum of the breakpoint regions outsized the predefined, arbitrary threshold of 15 kb, qPCR was used to reduce the breakpoint regions, resulting in more suitable fragments for long-range PCR. Primers were designed equally throughout the breakpoint regions and subjected to a stringent in silico and in vitro validation according to previously described parameters. The qPCR primers that qualified were used in a qPCR-based copy number analysis as previously described [68]. In short, 7.5 µl qPCR reactions contained 3.75 µl 2× master mix (qPCR core kit for SYBR Green I, Eurogentec), 0.375 µl of each primer (5 µM working solution), 1 µl nuclease-free water and 2 µl template (10 ng/µl). The reactions were carried out on the LightCycler 480 Instrument II (Roche) using the following qPCR protocol: 10 min pre-incubation at 95°C followed by 45 cycles of 95°C for 10 s, 60°C for 45 s and 72°C for 1 s, next a dissociation run from 60 to 95°C and ending with a cooling step. Data-analysis was performed with qBasePlus software [69]. Two reference genes were used for normalization of the relative quantities and two positives controls with known copy number were used as a reference to calculate the copy numbers [68].
Long-range PCR and sequencing of junction products
For the delineation of the deletions at nucleotide level, specific junction products need to be obtained. Therefore, inward-facing PCR primers were designed in the normal regions flanking the breakpoint regions. Long-range PCR reactions were performed in a total volume of 20 µl containing 1× iProof HF buffer, 200 µM of each dNTP, 0.5 µM of each primer, 0.4 units of iProof DNA-polymerase (Bio-Rad) and 100 ng of template DNA. The standard PCR protocol is defined as follows: 94°C for 2 min, 35 cycles of (94°C for 30 sec, Ta for 30 sec, 68°C for 1 min/kb), and a final extension of 72°C for 10 min with an optimized annealing temperature and extension time for each junction product. To evaluate the specificity of a junction product, a control sample of a healthy individual accompanied the deletion samples. After amplification, the PCR products were visualized using the LabChip GX with the DNA 5K assay kit (Caliper Life Sciences) if junction products are assumed to be smaller than 5 kb or using gel electrophoresis. Next, specific junction products were sequenced using internal primers with the BigDye Terminator v. 3.1 Cycle Sequencing Kit (Applied Biosystems). Sequencing reactions were then loaded on an Applied Biosystems Prism 3130 or 3730 genetic Analyzer.
Bioinformatic analyses
The sequences generated from the internal primers were first aligned to the reference sequence (obtained from UCSC, hg19) with SeqScape v1.1 (Applied Biosystems) to visualize the junction. To determine the exact genomic location of the breakpoints, the proximal and distal sequences flanking the junction were loaded into the Blat tool provided by the UCSC browser [70]. If microhomology was present at the junction, the genomic location of the proximal breakpoint was defined as the last nucleotide adjacent to the microhomology-stretch and the genomic location of the distal breakpoint was defined as the first nucleotide adjacent to the microhomology-stretch. Breakpoints, breakpoint regions and junction fragments were subjected to an extensive bioinformatic analysis, with breakpoint region defined as a 150 bp fragment surrounding a breakpoint and junction fragment as a 150 bp fragment surrounding the junction, to assess the involvement of the genomic architecture in the origin of the deletions. First, the presence of microhomology at the breakpoints was analyzed with a multiple sequence alignment between the proximal and distal breakpoint regions, and the junction fragment using ClustalW [71]. Second, the presence of known repetitive elements intersecting the breakpoints was investigated using the Repeat Masker track in the UCSC genome browser [72]. In cases where both breakpoints of a deletion overlap with a repetitive element, BLAST2 was used to determine the percentage of sequence identity between the elements [73]. Third, the presence of DNA sequences leading to non-B DNA conformations in the breakpoint regions was examined with several different tools: GT-repeats (forming left-handed Z-DNA) with Zhunt online [74]; direct, inverted and mirror repeats capable (forming slipped hairpin, cruciform and triplex structures, respectively) with RepeatAround [75]; oligo(G)n tracts (forming tetraplex structures) with QGRS [76]. Non-B DNA conformations were only included if both counterparts flanked the breakpoint. And fourth, the presence of previously described sequence motifs [47] was analyzed with Fuzznuc [77]. These results were compared against a random control population representing the human genome as described by Vissers et al. [46] and Hannes et al. [78], to assess the statistical significance of the presence of genomic architecture. This random control population consists of 500 human genomic sequences of 150 bp each, randomly extracted from Ensembl using an in-house developed script. These sequences represent artificial breakpoint regions with the breakpoint between nucleotides 75 and 76. The same bioinformatic analyses were performed on these 500 sequences. The nucleotides surrounding the artificial breakpoint were evaluated for the presence of microhomology and the artificial breakpoints were analyzed for the possible presence of intersecting repetitive elements. Finally, the entire breakpoint regions were evaluated for the presence of motifs or sequences capable of forming non-B DNA conformations. Fisher's exact tests were performed to verify if the presence of a genomic element in the deletion population differed significantly in comparison with the control population.
Supporting Information
Zdroje
1. FeukL, CarsonAR, SchererSW (2006) Structural variation in the human genome. Nat Rev Genet 7 : 85–97.
2. ZhangF, GuW, HurlesME, LupskiJR (2009) Copy number variation in human health, disease, and evolution. Annu Rev Genomics Hum Genet 10 : 451–481.
3. CooperGM, ZerrT, KiddJM, EichlerEE, NickersonDA (2008) Systematic assessment of copy number variant detection via genome-wide SNP genotyping. Nat Genet 40 : 1199–1203.
4. IafrateAJ, FeukL, RiveraMN, ListewnikML, DonahoePK, et al. (2004) Detection of large-scale variation in the human genome. Nat Genet 36 : 949–951.
5. KiddJM, CooperGM, DonahueWF, HaydenHS, SampasN, et al. (2008) Mapping and sequencing of structural variation from eight human genomes. Nature 453 : 56–64.
6. KorbelJO, UrbanAE, AffourtitJP, GodwinB, GrubertF, et al. (2007) Paired-end mapping reveals extensive structural variation in the human genome. Science 318 : 420–426.
7. McCarrollSA, HadnottTN, PerryGH, SabetiPC, ZodyMC, et al. (2006) Common deletion polymorphisms in the human genome. Nat Genet 38 : 86–92.
8. McCarrollSA, KuruvillaFG, KornJM, CawleyS, NemeshJ, et al. (2008) Integrated detection and population-genetic analysis of SNPs and copy number variation. Nat Genet 40 : 1166–1174.
9. RedonR, IshikawaS, FitchKR, FeukL, PerryGH, et al. (2006) Global variation in copy number in the human genome. Nature 444 : 444–454.
10. SebatJ, LakshmiB, TrogeJ, AlexanderJ, YoungJ, et al. (2004) Large-scale copy number polymorphism in the human genome. Science 305 : 525–528.
11. TuzunE, SharpAJ, BaileyJA, KaulR, MorrisonVA, et al. (2005) Fine-scale structural variation of the human genome. Nat Genet 37 : 727–732.
12. LupskiJR (1998) Genomic disorders: structural features of the genome can lead to DNA rearrangements and human disease traits. Trends Genet 14 : 417–422.
13. CarvalhoCM, ZhangF, LupskiJR (2010) Evolution in health and medicine Sackler colloquium: Genomic disorders: a window into human gene and genome evolution. Proc Natl Acad Sci U S A 107 Suppl 1 : 1765–1771.
14. LiuP, CarvalhoCM, HastingsP, LupskiJR (2012) Mechanisms for recurrent and complex human genomic rearrangements. Curr Opin Genet Dev 22 : 211–220.
15. LupskiJR (2009) Genomic disorders ten years on. Genome Med 1 : 42.
16. StankiewiczP, LupskiJR (2002) Genome architecture, rearrangements and genomic disorders. Trends Genet 18 : 74–82.
17. LieberMR (2008) The mechanism of human nonhomologous DNA end joining. J Biol Chem 283 : 1–5.
18. McVeyM, LeeSE (2008) MMEJ repair of double-strand breaks (director's cut): deleted sequences and alternative endings. Trends Genet 24 : 529–538.
19. HanK, LeeJ, MeyerTJ, RemediosP, GoodwinL, et al. (2008) L1 recombination-associated deletions generate human genomic variation. Proc Natl Acad Sci U S A 105 : 19366–19371.
20. SenSK, HanK, WangJ, LeeJ, WangH, et al. (2006) Human genomic deletions mediated by recombination between Alu elements. Am J Hum Genet 79 : 41–53.
21. LeeJA, CarvalhoCM, LupskiJR (2007) A DNA replication mechanism for generating nonrecurrent rearrangements associated with genomic disorders. Cell 131 : 1235–1247.
22. HastingsPJ, IraG, LupskiJR (2009) A microhomology-mediated break-induced replication model for the origin of human copy number variation. PLoS Genet 5: e1000327 doi:10.1371/journal.pgen.1000327.
23. ChenJM, ChuzhanovaN, StensonPD, FerecC, CooperDN (2005) Complex gene rearrangements caused by serial replication slippage. Hum Mutat 26 : 125–134.
24. SheenCR, JewellUR, MorrisCM, BrennanSO, FerecC, et al. (2007) Double complex mutations involving F8 and FUNDC2 caused by distinct break-induced replication. Hum Mutat 28 : 1198–1206.
25. ShawCJ, LupskiJR (2004) Implications of human genome architecture for rearrangement-based disorders: the genomic basis of disease. Hum Mol Genet 13 Spec No 1: R57–64.
26. NobileC, ToffolattiL, RizziF, SimionatiB, NigroV, et al. (2002) Analysis of 22 deletion breakpoints in dystrophin intron 49. Hum Genet 110 : 418–421.
27. ToffolattiL, CardazzoB, NobileC, DanieliGA, GualandiF, et al. (2002) Investigating the mechanism of chromosomal deletion: characterization of 39 deletion breakpoints in introns 47 and 48 of the human dystrophin gene. Genomics 80 : 523–530.
28. InoueK, OsakaH, ThurstonVC, ClarkeJT, YoneyamaA, et al. (2002) Genomic rearrangements resulting in PLP1 deletion occur by nonhomologous end joining and cause different dysmyelinating phenotypes in males and females. Am J Hum Genet 71 : 838–853.
29. VenturinM, GervasiniC, OrzanF, BentivegnaA, CorradoL, et al. (2004) Evidence for non-homologous end joining and non-allelic homologous recombination in atypical NF1 microdeletions. Hum Genet 115 : 69–80.
30. ShawCJ, LupskiJR (2005) Non-recurrent 17p11.2 deletions are generated by homologous and non-homologous mechanisms. Hum Genet 116 : 1–7.
31. ChandaB, Asai-CoakwellM, YeM, MungallAJ, BarrowM, et al. (2008) A novel mechanistic spectrum underlies glaucoma-associated chromosome 6p25 copy number variation. Hum Mol Genet 17 : 3446–3458.
32. NagamaniSC, ZhangF, ShchelochkovOA, BiW, OuZ, et al. (2009) Microdeletions including YWHAE in the Miller-Dieker syndrome region on chromosome 17p13.3 result in facial dysmorphisms, growth restriction, and cognitive impairment. J Med Genet 46 : 825–833.
33. YatsenkoSA, BrundageEK, RoneyEK, CheungSW, ChinaultAC, et al. (2009) Molecular mechanisms for subtelomeric rearrangements associated with the 9q34.3 microdeletion syndrome. Hum Mol Genet 18 : 1924–1936.
34. ZhangF, SeemanP, LiuP, WetermanMA, Gonzaga-JaureguiC, et al. (2010) Mechanisms for nonrecurrent genomic rearrangements associated with CMT1A or HNPP: rare CNVs as a cause for missing heritability. Am J Hum Genet 86 : 892–903.
35. JennesI, de JongD, MeesK, HogendoornPC, SzuhaiK, et al. (2011) Breakpoint characterization of large deletions in EXT1 or EXT2 in 10 multiple osteochondromas families. BMC Med Genet 12 : 85.
36. OleyC, BaraitserM (1988) Blepharophimosis, ptosis, epicanthus inversus syndrome (BPES syndrome). J Med Genet 25 : 47–51.
37. ZlotogoraJ, SagiM, CohenT (1983) The blepharophimosis, ptosis, and epicanthus inversus syndrome: delineation of two types. Am J Hum Genet 35 : 1020–1027.
38. CrisponiL, DeianaM, LoiA, ChiappeF, UdaM, et al. (2001) The putative forkhead transcription factor FOXL2 is mutated in blepharophimosis/ptosis/epicanthus inversus syndrome. Nat Genet 27 : 159–166.
39. De BaereE, DixonMJ, SmallKW, JabsEW, LeroyBP, et al. (2001) Spectrum of FOXL2 gene mutations in blepharophimosis-ptosis-epicanthus inversus (BPES) families demonstrates a genotype–phenotype correlation. Hum Mol Genet 10 : 1591–1600.
40. De BaereE, BeysenD, OleyC, LorenzB, CocquetJ, et al. (2003) FOXL2 and BPES: mutational hotspots, phenotypic variability, and revision of the genotype-phenotype correlation. Am J Hum Genet 72 : 478–487.
41. BeysenD, De PaepeA, BaereED (2008) FOXL2 mutations and genomic rearrangements in BPES. Hum Mutat
42. BeysenD, RaesJ, LeroyBP, LucassenA, YatesJR, et al. (2005) Deletions involving long-range conserved nongenic sequences upstream and downstream of FOXL2 as a novel disease-causing mechanism in blepharophimosis syndrome. Am J Hum Genet 77 : 205–218.
43. D'HaeneB, AttanasioC, BeysenD, DostieJ, LemireE, et al. (2009) Disease-causing 7.4 kb cis-regulatory deletion disrupting conserved non-coding sequences and their interaction with the FOXL2 promotor: implications for mutation screening. PLoS Genet 5: e1000522 doi:10.1371/journal.pgen.1000522.
44. D'HaeneB, NevadoJ, PugeatM, PierquinG, LowryRB, et al. (2010) FOXL2 copy number changes in the molecular pathogenesis of BPES: unique cohort of 17 deletions. Hum Mutat 31 (5)
E1332–47 doi:10.1002/humu.21233.
45. ConradDF, BirdC, BlackburneB, LindsayS, MamanovaL, et al. (2010) Mutation spectrum revealed by breakpoint sequencing of human germline CNVs. Nat Genet 42 : 385–391.
46. VissersLE, BhattSS, JanssenIM, XiaZ, LalaniSR, et al. (2009) Rare pathogenic microdeletions and tandem duplications are microhomology-mediated and stimulated by local genomic architecture. Hum Mol Genet 18 : 3579–3593.
47. AbeysingheSS, ChuzhanovaN, KrawczakM, BallEV, CooperDN (2003) Translocation and gross deletion breakpoints in human inherited disease and cancer I: Nucleotide composition and recombination-associated motifs. Hum Mutat 22 : 229–244.
48. WellsRD (2007) Non-B DNA conformations, mutagenesis and disease. Trends Biochem Sci 32 : 271–278.
49. GuW, ZhangF, LupskiJR (2008) Mechanisms for human genomic rearrangements. Pathogenetics 1 : 4.
50. MaJL, KimEM, HaberJE, LeeSE (2003) Yeast Mre11 and Rad1 proteins define a Ku-independent mechanism to repair double-strand breaks lacking overlapping end sequences. Mol Cell Biol 23 : 8820–8828.
51. BoonePM, LiuP, ZhangF, CarvalhoCM, TowneCF, et al. (2011) Alu-specific microhomology-mediated deletion of the final exon of SPAST in three unrelated subjects with hereditary spastic paraplegia. Genet Med 13 : 582–592.
52. PavlovYI, ShcherbakovaPV, RogozinIB (2006) Roles of DNA polymerases in replication, repair, and recombination in eukaryotes. Int Rev Cytol 255 : 41–132.
53. RattrayAJ, StrathernJN (2003) Error-prone DNA polymerases: when making a mistake is the only way to get ahead. Annu Rev Genet 37 : 31–66.
54. DeS, BabuMM (2010) A time-invariant principle of genome evolution. Proc Natl Acad Sci U S A 107 : 13004–13009.
55. LiuP, CarvalhoCM, HastingsPJ, LupskiJR (2012) Mechanisms for recurrent and complex human genomic rearrangements. Curr Opin Genet Dev 22 : 211–220.
56. BallifBC, RosenfeldJA, TraylorR, TheisenA, BaderPI, et al. (2012) High-resolution array CGH defines critical regions and candidate genes for microcephaly, abnormalities of the corpus callosum, and seizure phenotypes in patients with microdeletions of 1q43q44. Hum Genet 131 : 145–156.
57. KuechlerA, BuysseK, Clayton-SmithJ, Le CaignecC, DavidA, et al. (2011) Five patients with novel overlapping interstitial deletions in 8q22.2q22.3. Am J Med Genet A 155A: 1857–1864.
58. PalomaresM, DelicadoA, MansillaE, de TorresML, VallespinE, et al. (2011) Characterization of a 8q21.11 microdeletion syndrome associated with intellectual disability and a recognizable phenotype. Am J Hum Genet 89 : 295–301.
59. TalkowskiME, MullegamaSV, RosenfeldJA, van BonBW, ShenY, et al. (2011) Assessment of 2q23.1 microdeletion syndrome implicates MBD5 as a single causal locus of intellectual disability, epilepsy, and autism spectrum disorder. Am J Hum Genet 89 : 551–563.
60. VergultS, DauberA, Delle ChiaieB, Van OudenhoveE, SimonM, et al. (2012) 17q24.2 microdeletions: a new syndromal entity with intellectual disability, truncal obesity, mood swings and hallucinations. Eur J Hum Genet 20 : 534–539.
61. ArguesoJL, WestmorelandJ, MieczkowskiPA, GawelM, PetesTD, et al. (2008) Double-strand breaks associated with repetitive DNA can reshape the genome. Proc Natl Acad Sci U S A 105 : 11845–11850.
62. VoineaguI, NarayananV, LobachevKS, MirkinSM (2008) Replication stalling at unstable inverted repeats: interplay between DNA hairpins and fork stabilizing proteins. Proc Natl Acad Sci U S A 105 : 9936–9941.
63. WangG, VasquezKM (2006) Non-B DNA structure-induced genetic instability. Mutation research 598 : 103–119.
64. BacollaA, WellsRD (2004) Non-B DNA conformations, genomic rearrangements, and human disease. J Biol Chem 279 : 47411–47414.
65. LanderES, LintonLM, BirrenB, NusbaumC, ZodyMC, et al. (2001) Initial sequencing and analysis of the human genome. Nature 409 : 860–921.
66. BuysseK, Delle ChiaieB, Van CosterR, LoeysB, De PaepeA, et al. (2009) Challenges for CNV interpretation in clinical molecular karyotyping: lessons learned from a 1001 sample experience. Eur J Med Genet 52 : 398–403.
67. MentenB, PattynF, De PreterK, RobbrechtP, MichelsE, et al. (2005) arrayCGHbase: an analysis platform for comparative genomic hybridization microarrays. BMC Bioinformatics 6 : 124.
68. D'HaeneB, VandesompeleJ, HellemansJ (2010) Accurate and objective copy number profiling using real-time quantitative PCR. Methods 50 : 262–270.
69. HellemansJ, MortierG, De PaepeA, SpelemanF, VandesompeleJ (2007) qBase relative quantification framework and software for management and automated analysis of real-time quantitative PCR data. Genome Biol 8: R19.
70. KentWJ (2002) BLAT–the BLAST-like alignment tool. Genome Res 12 : 656–664.
71. LarkinMA, BlackshieldsG, BrownNP, ChennaR, McGettiganPA, et al. (2007) Clustal W and Clustal X version 2.0. Bioinformatics 23 : 2947–2948.
72. JurkaJ, KapitonovVV, PavlicekA, KlonowskiP, KohanyO, et al. (2005) Repbase Update, a database of eukaryotic repetitive elements. Cytogenet Genome Res 110 : 462–467.
73. AltschulSF, GishW, MillerW, MyersEW, LipmanDJ (1990) Basic local alignment search tool. J Mol Biol 215 : 403–410.
74. ChampPC, MauriceS, VargasonJM, CampT, HoPS (2004) Distributions of Z-DNA and nuclear factor I in human chromosome 22: a model for coupled transcriptional regulation. Nucleic Acids Res 32 : 6501–6510.
75. GoiosA, MeirinhosJ, RochaR, LopesR, AmorimA, et al. (2006) RepeatAround: a software tool for finding and visualizing repeats in circular genomes and its application to a human mtDNA database. Mitochondrion 6 : 218–224.
76. KikinO, D'AntonioL, BaggaPS (2006) QGRS Mapper: a web-based server for predicting G-quadruplexes in nucleotide sequences. Nucleic Acids Res 34: W676–682.
77. RiceP, LongdenI, BleasbyA (2000) EMBOSS: the European Molecular Biology Open Software Suite. Trends Genet 16 : 276–277.
78. HannesF, Van HoudtJ, QuarrellOW, PootM, HochstenbachR, et al. (2010) Telomere healing following DNA polymerase arrest-induced breakages is likely the main mechanism generating chromosome 4p terminal deletions. Hum Mutat 31 : 1343–1351.
Štítky
Genetika Reprodukční medicínaČlánek vyšel v časopise
PLOS Genetics
2013 Číslo 3
- Kazuistika – Perspektivy využití precizované medicíny v rámci personalizované specifické terapie onkologických pacientů
- Nobelova cena za chemii pro genetické nůžky: Objev, který změní naši budoucnost?
- Technologie na bázi RNA v klinické praxi: od přebarvených petúnií k terapii vzácných a dosud jen obtížně léčitelných chorob u lidí
- „Nepředstavovali jsme si, že náš výzkum povede přímo ke vzniku nových léků, dokonce ještě za našeho života“
- Bezplatné služby pro diagnostiku ATTRv amyloidózy pro kardiology
Nejčtenější v tomto čísle
- Fine Characterisation of a Recombination Hotspot at the Locus and Resolution of the Paradoxical Excess of Duplications over Deletions in the General Population
- Molecular Networks of Human Muscle Adaptation to Exercise and Age
- Recurrent Rearrangement during Adaptive Evolution in an Interspecific Yeast Hybrid Suggests a Model for Rapid Introgression
- Genome-Wide Association Study and Gene Expression Analysis Identifies as a Predictor of Response to Etanercept Therapy in Rheumatoid Arthritis
Zvyšte si kvalifikaci online z pohodlí domova
Mazová zátka a její řešení
nový kurzVšechny kurzy