
Ongoing Phenotypic and Genomic Changes in Experimental Coevolution of RNA Bacteriophage Qβ and
According to the Red Queen hypothesis or arms race dynamics, coevolution drives continuous adaptation and counter-adaptation. Experimental models under simplified environments consisting of bacteria and bacteriophages have been used to analyze the ongoing process of coevolution, but the analysis of both parasites and their hosts in ongoing adaptation and counter-adaptation remained to be performed at the levels of population dynamics and molecular evolution to understand how the phenotypes and genotypes of coevolving parasite–host pairs change through the arms race. Copropagation experiments with Escherichia coli and the lytic RNA bacteriophage Qβ in a spatially unstructured environment revealed coexistence for 54 days (equivalent to 163–165 replication generations of Qβ) and fitness analysis indicated that they were in an arms race. E. coli first adapted by developing partial resistance to infection and later increasing specific growth rate. The phage counter-adapted by improving release efficiency with a change in host specificity and decrease in virulence. Whole-genome analysis indicated that the phage accumulated 7.5 mutations, mainly in the A2 gene, 3.4-fold faster than in Qβ propagated alone. E. coli showed fixation of two mutations (in traQ and csdA) faster than in sole E. coli experimental evolution. These observations suggest that the virus and its host can coexist in an evolutionary arms race, despite a difference in genome mutability (i.e., mutations per genome per replication) of approximately one to three orders of magnitude.
Published in the journal:
. PLoS Genet 7(8): e32767. doi:10.1371/journal.pgen.1002188
Category:
Research Article
doi:
https://doi.org/10.1371/journal.pgen.1002188
Summary
According to the Red Queen hypothesis or arms race dynamics, coevolution drives continuous adaptation and counter-adaptation. Experimental models under simplified environments consisting of bacteria and bacteriophages have been used to analyze the ongoing process of coevolution, but the analysis of both parasites and their hosts in ongoing adaptation and counter-adaptation remained to be performed at the levels of population dynamics and molecular evolution to understand how the phenotypes and genotypes of coevolving parasite–host pairs change through the arms race. Copropagation experiments with Escherichia coli and the lytic RNA bacteriophage Qβ in a spatially unstructured environment revealed coexistence for 54 days (equivalent to 163–165 replication generations of Qβ) and fitness analysis indicated that they were in an arms race. E. coli first adapted by developing partial resistance to infection and later increasing specific growth rate. The phage counter-adapted by improving release efficiency with a change in host specificity and decrease in virulence. Whole-genome analysis indicated that the phage accumulated 7.5 mutations, mainly in the A2 gene, 3.4-fold faster than in Qβ propagated alone. E. coli showed fixation of two mutations (in traQ and csdA) faster than in sole E. coli experimental evolution. These observations suggest that the virus and its host can coexist in an evolutionary arms race, despite a difference in genome mutability (i.e., mutations per genome per replication) of approximately one to three orders of magnitude.
Introduction
Host–parasite coevolution has been a topic of intense research interest in various fields from basic science of molecular evolution to agricultural and medical applications [1]–[5]. According to the Red Queen hypothesis or arms race dynamics, coevolution leads to complex but continuous change, adaptation, and counter-adaptation of the phenotypes of interacting organisms [2], [6], [7]. Futuyma and Slatkin suggested that investigation of coevolution could raise and help provide answers to many questions regarding the history of evolution, e.g., whether parasites tend toward specialization or toward benign or even mutualistic relationships with their hosts [8].
There have been many previous observational and theoretical studies on natural host–parasite dynamics. With regard to the relationships between bacteria and phages, Rodríguez-Valera et al. proposed the constant-diversity dynamics model in which the diversity of prokaryotic populations is maintained by phage predation [9]. Moreover, an observational study supported the model by analyzing the dynamics of bacteria and phages in four aquatic environments using a metagenomics method and showed that microbial strains and viral genotypes changed rapidly [10]. In addition, experimental models in simplified environments have been employed to analyze the ongoing process of coevolution. Various pairwise combinations of bacteria and phages and one with Caenorhabditis elegans and bacteria have been subjected to long-term laboratory cultivation [11]–[15]. These studies indicated that coevolution proceeded on a laboratory time scale [11]–[14], accelerated molecular evolution of parasites [16], [17], and broadened the host range of parasites [14]. However, the changes in genetic information and phenotype of parasites and their hosts through coevolution remain to be elucidated, and the changes in host specificity and virulence of the parasites through the arms race have not been determined in sufficient detail because ongoing adaptation and counter-adaptation in simplified experimental model systems have not been analyzed at the levels of population dynamics and molecular evolution.
To examine the ongoing changes driven by host–parasite interactions, we have constructed a coevolution model consisting of Escherichia coli and the lytic RNA bacteriophage Qβ (Qβ) in a spatially unstructured environment. Qβ is a simple RNA bacteriophage that infects and lyses E. coli cells, taking about 1 h for its burst without escaping into a lysogenic state. It has a single-stranded RNA genome of 4,217 bases encoding four genes for A2, A1 (read-through), coat protein, and RNA replicase β subunit [18]. Due to a high misinsertion rate and lack of a proofreading mechanism, ribovirus RNA replicase (including that of Qβ) has a high mutation rate [18]–[22], which allows us to monitor the evolutionary changes on a laboratory time scale.
Here, we report that in coevolution through 54 daily copropagations of the parasite and its host, E. coli first evolved partial resistance to infection and later showed acceleration of its specific growth rate, while the phage counter-adapted by improving release efficiency with a change in host specificity and a decrease in virulence. Fitness analysis indicated that these phenotypic changes occurred within an arms race, i.e., accompanied with a monotonic fitness increase of either the parasite or its host. Whole-genome analysis indicated that the phage accumulated 7.5 mutations mainly in the A2 gene 3.4-fold faster than in Qβ propagation evolution where the phage was transferred daily to freshly prepared E. coli cultures, while E. coli showed fixation of two mutations (in traQ and csdA) faster than in sole E. coli experimental evolution. The results indicated ongoing adaptation and counter-adaptation through a host–parasite arms race.
Results
Experimental evolution system
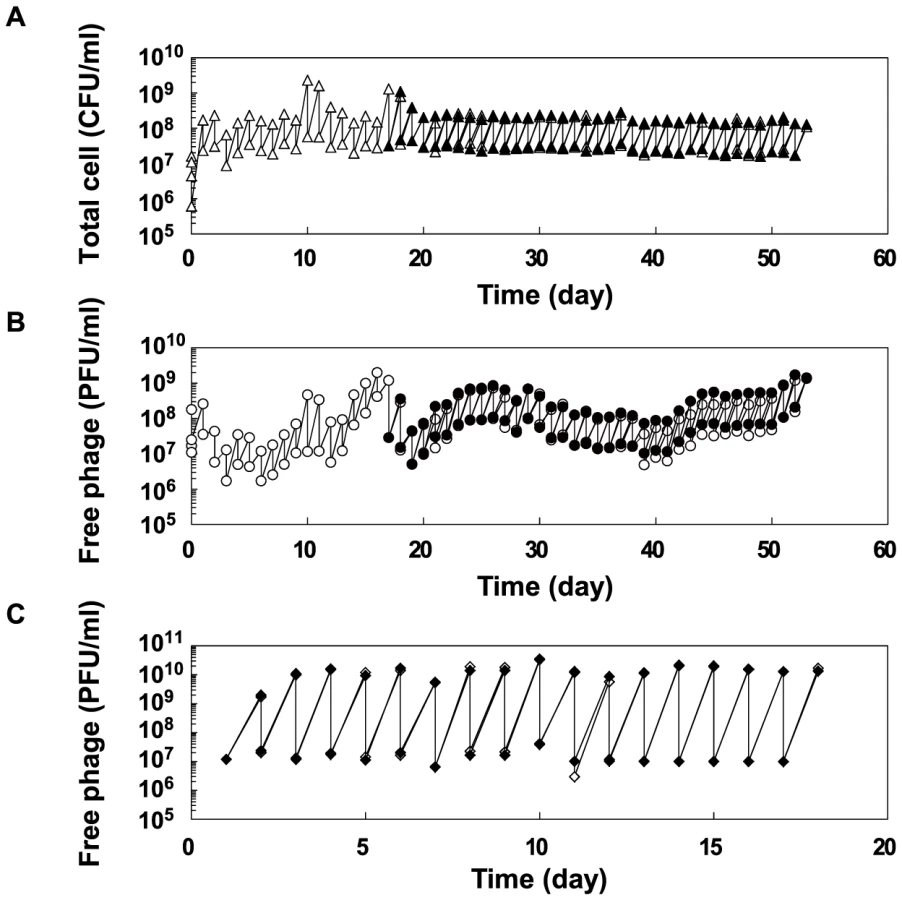
Evolution experiments were carried out with copropagation of E. coli and Qβ and with propagation of Qβ only (Figure 1A). In the copropagation experiment, the ancestral E. coli strain HL2 (Anc(C)) and Qβ derived from cloned Qβ cDNA [23] (Anc(P)) were mixed, cultivated, and diluted so that the next daily culture was initiated at approximately 1×10⁷ E. coli cells/ml. We calculated the replication generations of Qβ genome as the cumulative generations of each passage, (Nfinal/Ninitial) = 2g, where Nfinal and Ninitial represent final and initial free phage density of each passage in plaque forming units (PFU/ml), respectively, and g represents replication generation. We also calculated E. coli cell generations as the cumulative generations of each passage, (Nf/Ni) = 2n, where Nf and Ni represent the final and initial colony forming units (CFU/ml) of each passage, respectively, and n represents cell generation. In the very early phase of the copropagation experiment, the cell generation was underestimated due to cell lysis by infection. The copropagation experimental population was divided into two on day 18, equivalent to 59 replication generations and 62 cell generations. Culture was continued to a total of 54 days (lines 1 and 2), equivalent to 163 replication generations and 163 cell generations for line 1, and 165 replication generations and 164 cell generations for line 2 (Figure 1B). Two Qβ propagation experiments, lines 3 and 4, were conducted in parallel for 18 days, equivalent to 169 and 168 replication generations where the phage population was separated daily by centrifugation from the host and transferred into fresh logarithmic cultures of the host Anc(C) (Figure 1B).

The population dynamics of the copropagation experiment demonstrated the coexistence of E. coli and Qβ (Figure 2), although Qβ is lytic and has no lysogenic state. The daily Qβ population density fluctuated over the course of the copropagation experiment, while the E. coli population density was stable probably due to the constant initial density of the host at each daily coculture. The degree of phage amplification in the copropagation experiment (2–20-fold per single coculture) was substantially lower than that in the Qβ propagation experiment (approximately 1,000-fold), even though the initial multiplicity of infection (MOI) in each passage was approximately 0.5 (approximately 107 phages/ml over 2×10⁷ E. coli cells/ml) for the Qβ propagation experiment and was not higher than that for the copropagation experiment (Figure 2B and 2C). These observations suggested that the biotic environment for phage amplification, i.e., the cellular state of the host E. coli, changed during the copropagation experiment.
Fitness analysis of the parasites and hosts evolved in the copropagation experiment
Cross-cocultures were conducted to determine the changes in fitness of E. coli and Qβ in the copropagation experiment. Four hosts (Anc(C), M54(C), M163(C), and M165_2(C)), and the four corresponding phages (Anc(P), M54(P), M163(P), and M165_2(P)) at the 1st, 54th, 163rd, and 165th replication generations in the copropagation experiments of lines 1 and 2 were cocultured to measure fitness in each pairwise combination. Here, the fitness of E. coli is defined as the ratio of the initial to the stationary optical density at 600 nm (OD600), while the fitness of the phage is the ratio of the initial to the stationary free phage density (PFU/ml) (Table 1, Table 2 and Figure S1).
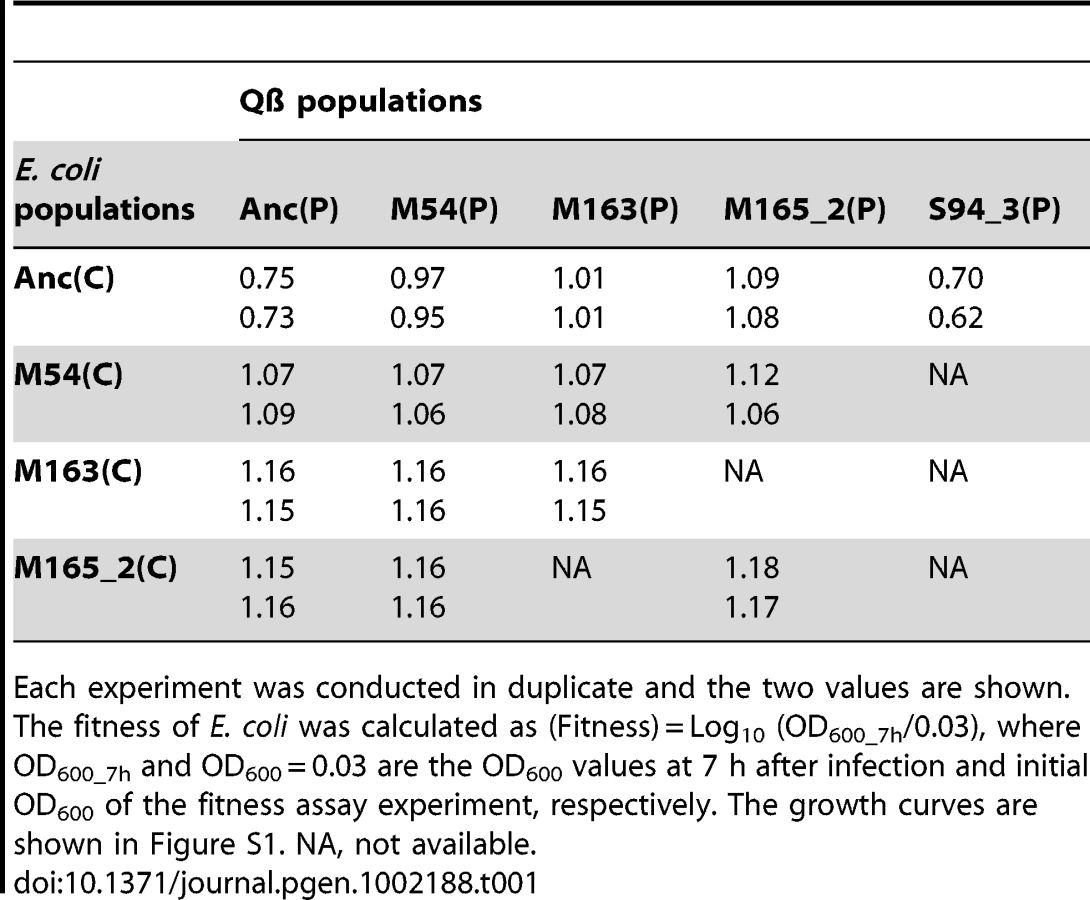

The host E. coli evolved partial resistance along with its increase in fitness (Table 1). The evolved hosts M54(C), M163(C), and M165_2(C) showed phage amplification ratios two to three orders of magnitude lower than Anc(C), regardless of whether the ancestral or evolved phage was used (host: Anc(C), M54(C), M163(C), and M165_2(C), parasite: Anc(P), M54(P), M163(P), and M165_2(P): one-way ANOVA F3,24 = 213, P<0.01; post hoc Tukey–Kramer test, P<0.01; Table 2). The resistance was only partial, allowing phage amplification of only approximately one order of magnitude. On the other hand, the host E. coli infected with Anc(P) gradually showed an increase in amplification ratio along with host evolution (one-way ANOVA F2,3 = 469, P<0.01; post hoc Tukey test detected significant differences between all combinations: Anc(C) vs. M54(C) and Anc(C) vs. M163(C), P<0.01; M54(C) vs. M163(C), P<0.05; Table 1). The growth curve of M163(C) inoculated with the phages became similar to that of the uninfected host (Figure S1A, third from left), suggesting that the host population evolved, increasing its fitness, to become almost oblivious to the phages.
Despite the development of partial resistance by the host, the phage also increased its fitness through changes in host specificity (Table 2). The evolved phage M54(P) and M163(P) showed higher fitness on the evolved host M54(C) with partial resistance than Anc(P) on the same host (one-way ANOVA F2,3 = 19.7, P<0.05; post hoc Tukey test, P<0.05; Table 2). In line 1 and line 2, the most evolved Qβ, M163(P) or M165_2(P) showed the highest fitness on corresponding E. coli, M163(C) or M165_2(C), respectively. Briefly, there was a significant difference in fitness among the host–parasite combinations (host: M163(C) or M165_2(C), parasite: Anc(P), M54(P), M163(P), or M165_2(P), one-way ANOVA F2,3 = 60.8, P<0.01; post hoc Tukey test, P<0.05 for M163(C); F2,3 = 37, P<0.01; post hoc Tukey test, P<0.05 for M165_2(C); Table 2). The phage evolved through natural selection to show greater amplification on the corresponding host, although the amplification ratio itself decreased from approximately 104 to 101.
The phage, while responding adaptively to the evolutionary changes of its host, showed a decrease in amplification ratio on the ancestral host strain, leading to a decrease in virulence. The amplification ratios of the phage on the host Anc(C) gradually decreased over the course of the copropagation experiment (host: Anc(C), parasite: Anc(P), M54(P), M163(P), and M165_2(P), one-way ANOVA F3,4 = 17.4, P<0.01; post hoc Tukey test, P<0.05; Table 2). A decline in phage amplification was also observed as a reduction in plaque size (Figure 3). Consequently, the evolved phage showed less cell killing effect against the ancestral strain Anc(C), resulting in better growth of the ancestral bacterial strain (host: Anc(C), parasite: Anc(P), M54(P), M163(P), and M165_2(P), one-way ANOVA, F3,4 = 340, P<0.01; post hoc Tukey test, P<0.01; Table 1 and Figure S1A, left), i.e., the phage showed a decrease in virulence. In addition, the phage evolved in the Qβ propagation experiment (S94_3(P)) showed the greatest amplification ratio (host: Anc(C), parasite: Anc(P), M54(P), M163(P), M165_2(P), and S94_3(P), one-way ANOVA F4,5 = 37.8, P<0.01; post hoc Tukey test, P<0.05; Table 2 and Figure S1B, left) and similar virulence against Anc(C) with Anc(P) (host: Anc(C), parasite: Anc(P) and S94_3(P), Welch's t test, t = 12.7, P = 0.45; Table 1 and Figure S1A, left). These results suggest that the decrease in virulence was not due to simple degeneration through the long-term passage experiment, but was probably at the expense of increasing the fitness of the phage in the arms race with its host.

Mechanism of fitness improvement
To examine how E. coli and Qβ improved their fitness during coevolution, free phages, infected E. coli cells, and total E. coli cells from the copropagation of line 1 were monitored hourly by determining the numbers of PFUs in the supernatant and pellet after centrifugation and CFU, respectively (see Materials and Methods).
E. coli was found to first evolve partial resistance to Qβ, which was followed by a later increase in the specific growth rate. After 3 hours of incubation with Anc(P), almost all of the ancestral host Anc(C) cells were infected, while infection ratios of the evolved hosts M54(C) and M163(C) were only 0.03% and 0.08%, respectively (Figure 4A, 4B, and 4D, left). The observed partial resistance was likely due to a very low adsorption rate of E. coli cells to the phage (Figure 5). As most of the evolved host cells remained uninfected, they were able to proliferate, while the ancestral cells could not. In addition, the uninfected cells of the most evolved hosts, M163(C) and M165_2(C) for lines 1 and 2, respectively, showed higher specific growth rates than those of M54(C) (see legend of Figure 6 for specific growth rates, ANCOVA, F2,24 = 18.0, P<0.001; post hoc Tukey test, P<0.001). Although the OD600/CFU seemed to have changed over the copropagation experiments (Figure 6), the same conclusion was obtained using specific growth rates based on CFU values (data not shown). Briefly, M54(C) eliminated Anc(C) from the population by developing partial resistance to phage infection, and M163(C) and M165_2(C) finally took over the population due to acceleration of specific growth rate.
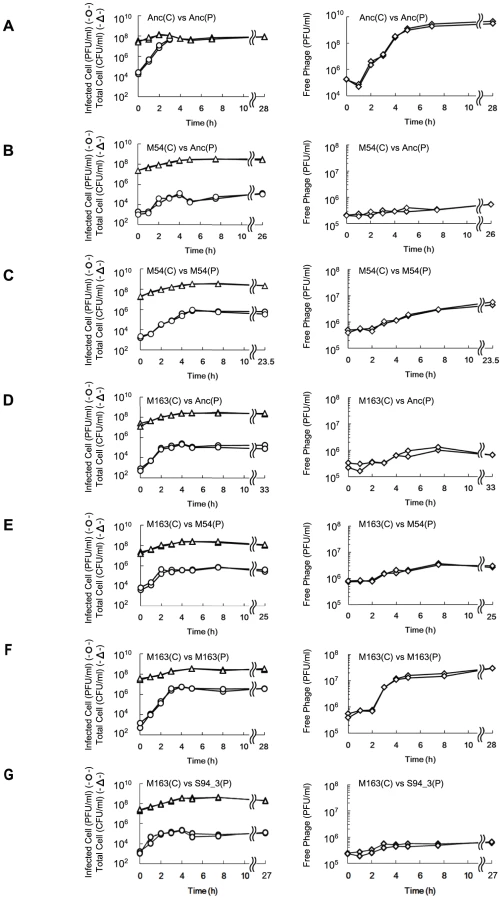


The phages evolved to show increased release efficiency, i.e., the number of phages released from a single infected cell per unit time. As the phage evolved, the speed of free phage amplification for either M54(C) or M163(C) increased (the amplification rates of free phage density of Anc(P) and M54(P) on M54(C) were 0.11 h−1 (r2 = 0.43) and 0.31 h−1 (r2 = 0.93), respectively, two-tailed t test t = 3.24, P<0.01; Figure 4B and 4C, right, and those of Anc(P), M54(P), and M163(P) on M163(C) were 0.25 h−1 (r2 = 0.79), 0.24 h−1 (r2 = 0.89), and 1.38 h−1 (r2 = 0.93), respectively, ANCOVA; F2,18 = 35.3 P<0.01; post hoc Tukey test, P<0.01; Figure 4D, 4E, and 4F, right), while the infection efficiency, i.e., the rate of increase in infected cells, did not change significantly for the same hosts (the rates of increase in infected cells of M54(C) infected with Anc(P) or M54(P) were 1.21 h−1 (r2 = 0.89) and 1.26 h−1 (r2 = 0.98), respectively, two-tailed t test, t = 0.39, P = 0.70; Figure 4B and 4C, left, and those of M163(C) infected with Anc(P), M54(P), or M163(P) were 2.40 h−1 (r2 = 0.98), 2.80 h−1 (r2 = 0.92), and 2.72 h−1 (r2 = 0.99), respectively, ANCOVA, F2,12 = 0.95, P = 0.41; Figure 4D, 4E, and 4F, left). The acceleration of free phage amplification rate could be attributed to either an increase in burst frequency per unit time or burst size. There was no significant difference in burst size between M163(P) and Anc(P) on M163(C) determined by the method of analysis of burst sizes in single cell [24] (data not shown). Therefore, the phage seems to have evolved to burst more frequently from infected cells per unit time. It is noteworthy that the most evolved phage, M163(P), inoculated onto M163(C) showed a marked increase in number of free phage at 3 h, probably leading to further infection of surrounding uninfected hosts and an increase in proportion of infected cells beyond the inoculated free phage concentration (4.8×10⁵ PFU/ml) (Figure 4F). Other phages stopped increasing the number of infected cells at around the inoculated free phage concentration (Figure 4D, 4E, and 4G).
Molecular evolution of host and parasite
We performed whole genome sequence analyzes of all of the Qβ populations indicated in Figure 1B to determine how molecular evolution of the phage proceeded in response to the adaptation of the hosts. First, mutations were shown to be accumulated in a biased manner in the A2 gene, which encodes a multifunctional protein related to infection and cell lysis (Figure 1B and Table 3). The A2 gene, accounting for 30% of the whole genome, accumulated 65.5% of all mutations, and this bias was shown to be statistically significant (P<0.05, two-tailed binomial test). A similar substantial accumulation of mutations in genes related to host infection was demonstrated previously in an evolution experiment using the DNA bacteriophage Φ2 [16]. The mutation fixation rate in phage was higher in the copropagation experiment (1.0×10⁻⁵±6.0×10⁻⁷ per base per generation) than that in the Qβ propagation experiment (3.2×10⁻⁶±5.1×10⁻⁷ per base per generation) (two-tailed Welch's t test t = 4.3, P<0.01), suggesting that the phage showed accelerated molecular evolution through coevolution with its host (Figure 7).


Whole-genome analysis of E. coli revealed the process of molecular evolution in the host cells. We analyzed the whole genome sequence of M163(C) using an Illumina Genome Analyzer IIx (GAIIx; Illumina, San Diego, CA) and confirmed the mutations in M163(C) together with Anc(C) and M54(C) by the dideoxynucleotide chain termination sequencing method [25]. A single mutation in traQ (S21P) encoded on the F plasmid was detected in M54(C) and an additional mutation was detected in csdA (D340N) in M163(C) (Table S1, Table S2). As discussed below, the protein products from these genes may contribute to resistance to phage infection and the increase in fitness of E. coli.
Discussion
Phenotypic and genetic changes of Qβ and E. coli
In the copropagation experiment, E. coli adopted a simple strategy with only two mutations, while the phage accumulated more mutations within its small genome as counter-adaptation against the evolutionary changes in the host. The host first developed resistance to phage infection via a non-synonymous mutation in traQ. This gene encodes TraQ, the conjugal transfer pilin, which is a component of the F pilus, and is a chaperone for inserting propilin into the inner membrane. Propilin was reported to be unstable in traQ− cells [26], and amino acid 21 of TraQ where the mutation was detected in this study interacts with propilin [27]. F pilus assembly from membrane F-pilin requires many Tra proteins [28]. As no mutations were detected in other Tra protein genes in the copropagation experiment, the mutation on TraQ may result in a decrease in the amount of inserted propilin, leading to the partial resistance observed in this study. E. coli then showed further mutation in csdA, which encodes CsdA, an enzyme related to Fe/S biogenesis and a new sulfur transfer pathway that is related to the fitness of these cells, especially in stationary phase [29]. Therefore, this mutation could be beneficial as the host was passaged daily at the stationary phase in the evolutionary experiment.
On the other hand, the phage evolved to increase release efficiency by accumulating mutations mostly in the gene encoding the A2 protein. A2 is a multifunctional protein with roles in host cell lysis, adsorption to the F pilus of E. coli, RNA binding during capsid assembly, protection of the 3′ terminus, penetration into the cytoplasm of the host, and blockage of cell wall biosynthesis by inhibiting the catalytic step from UDP-GlcNAc to UDP-GlcNAc-EP catalyzed by MurA [18], [30]–[32]. Due to the cell lytic activity of A2, it is unsurprising that these mutations might have resulted in an increased burst frequency and release efficiency. In fact, the experimental lag period between infection and detection of the increase in free phage became shorter by approximately 1 hour in the cross-culture experiment (e.g., 3 h for Anc(P) and 2 h for M163(P) on M163(C), Figure 4D and 4F, right, respectively). It should be noted that the uninfected M163(C) reached the stationary phase, which was not susceptible to phage infection, approximately 1 hour earlier than the other hosts (see legend of Figure 6 for the time to reach the stationary phase, one-way ANOVA, F2,3 = 693.8, P<0.001; post hoc Tukey test, P<0.001). Thus, it is possible that the increased burst frequency of M163(P) for the earlier phage release evolved as a counter-adaptation on the evolved host M163(C) due to the shorter period available for infection. Previous experiments using DNA bacteriophages indicated that shorter latent periods were favored in the presence of a high density of highly susceptible host cells [33], [34].
It is of interest that Qβ evolved to show reduced virulence toward the ancestral host. Many studies have indicated that phages with low or moderate virulence were favored in vertical transmission or in structured environments [35]–[37], while Qβ has no lysogenic state and evolved reduced virulence in this experiment. The decrease in virulence observed in this study may have been a side effect of the increase in burst frequency. If fact, the evolved phage M163(P) with increased burst frequency on the evolved host M163(C) showed lower virulence and lower fitness on Anc(C) than Anc(P) on Anc(C) (Figure 4 and Figure S1 left), suggesting that Qβ may have co-evolved to increase the burst frequency in reducing some benefits that can be gained if the host reverts to the Anc(C)-like phenotype.
The single non-synonymous mutation at position 221 of the A2 gene found in M54(P) seems to have resulted in reduced virulence and a change in host specificity. As the non-synonymous mutation was only observed in the copropagation experiment and two others were also observed in Qβ propagation and the deposited sequence (NCBI accession no. AY099114), the mutation at 221 and/or the combinations with the mutation and two other mutations may have resulted in the decrease in virulence and the change in host specificity observed in M54(P).
Accelerated molecular evolution rates of Qβ and E. coli
In coevolution between Qβ and its host, E. coli, the phage showed accelerated molecular evolution (Figure 7). In the Qβ propagation experiment, the molecular evolution of the phage proceeded but seemed to slow down after the 94th generation. On the other hand, the phage coevolving with E. coli retained a 3.4-fold faster molecular evolution rate throughout the copropagation experiment. The higher evolution rate may be attributable to the changes occurring in the host E. coli. If the host had stopped evolving, e.g., at the 54th generation, the M163(P) or M165_2(P) phage would not have been fixed into the population as it had fitness similar to or less than that of M54(P), leading to deceleration of evolutionary rate. It should be noted that neutral mutations cannot be fixed in the copropagation experiment because 163 replication generations is too short for them to become fixed. The fixation of neutral mutations is known to require generations approximately as long as the effective population size (Ne) [38]. The effective population size in the copropagation experiment was roughly estimated as the bottleneck size of the population (approximately 103 phages) assuming that 1% of the minimum initial 106 phages infect and burst to release approximately 107 phages. Thus, even synonymous mutations observed here were positively selected [38], consistent with the influence of the RNA secondary structure on Qβ genome replication reported previously [39]–[42]. Some synonymous mutations may have physiological impacts on phage growth because of genomic secondary structure; it has been reported that some synonymous mutations or mutations in intergenic regions show lethal effects in Qβ [42].
It is noteworthy that the fixation rate of the E. coli genome in the copropagation regime (2.6×10⁻⁹ per bp per generation) calculated as 2 mutations in 4.73 Mbp per 163 generations was one order of magnitude higher than that under conditions of E. coli sole passage, maintaining log phase at 37°C (1.7×10⁻¹⁰ per bp per generation) [43] or 20,000 generations (1.6×10⁻¹⁰ per bp per generation) (Poisson distribution, P<0.01) [44]. In summary, these observations indicated that molecular evolution rates of both the parasite and its host were accelerated through adaptation and counter-adaptation.
The arms race in the evolution experiment
Based on the observed fitness changes in the host E. coli and in the Qβ phage, we propose a plausible coevolution path to depict the arms race between Qβ and the host E. coli. As the order of phage fitness on the ancestral E. coli Anc(C) was Anc(P)>M54(P)>M163(P), the population in the coculture seemed to first take a route not in the direction of phage evolution (upward) but in the direction of host evolution (right), increasing host fitness by increasing its resistance to Qβ (Figure 8). The arrows in Figure 8 reflect the experimentally determined finesses changes (Table 1 and Table 2). Arriving around the pair position of M54(C) vs. Anc(P), the population could take either the upward or rightward direction, but happened to take the direction of phage evolution due to the occasional appearance of a single non-synonymous mutation at position 221 in the phage genome that was detected only under copropagation conditions (Table 3). The population of M54(P) and M54(C) could not fix a phage mutant like M163(P) with the same fitness as M54(P), but fixed the E. coli mutant M163(C) with fitness higher than that of M54(C). Due to the host change from M54(C) to M163(C) accompanied with an additional single non-synonymous mutation in csdA, the phage mutant M163(P) was fitter than M54(P) and was therefore fixed in the final population. Taken together, these findings indicated that the evolutionary path seemed to be an arms race involving adaptation of E. coli and counter-adaptation of the phage.

We showed that parasites, such as RNA viruses, and hosts, such as E. coli, have the potential to coexist even in an arms race. When a parasite encounters its host, the host may become extinct through the evolution of high parasite virulence, or the parasite may become extinct through the evolution of host resistance. However, both may also change their phenotypes by genomic mutation in a synchronized manner and thus coexist. The results of the present study indicated that a host with a larger genome size (4.6 Mbp) with a low spontaneous mutation rate (5.4×10⁻¹⁰ per bp per replication) [45] and a parasite with a smaller genome size (4,217 bases) and a higher spontaneous mutation rate (1.5×10⁻³–10−5 per base per replication) [18]–[22], despite the large difference in mutability of their genomes (approximately one to three orders of magnitude difference), were capable of changing their phenotypes to coexist in an arms race. Further studies linking the phenotype mutability and genome complexity will help to elucidate the dynamic host–parasite relationship.
Materials and Methods
Strains and media
The E. coli HL2 strain was used as the coculture host strain and A/λ [46] was used as an indicator strain for the titer assay. The E. coli HL2 strain was constructed by conjugation with DH1ΔleuB::(gfpuv5-Kmr) [43] and HB2151 [47]. We mixed log-phase DH1ΔleuB::(gfpuv5-Kmr) and HB2151 for 2.5 hours and screened for kanamycin-resistant clones on LB agar medium supplemented with 25 µg/ml kanamycin. F′ retention of HL2 was checked by PCR with the primers TraU_f (5′-ATGAAGCGAAGGCTGTGGCT-3′) and TraU_r (5′-GCAGCTTGAACGCCATGCGT-3′) and the ability of HL2 to amplify Qβ was confirmed. Before the evolution experiments, HL2 was grown in mM63gl (62 mM K2HPO4, 39 mM KH2PO4, 15 mM ammonium sulfate, 1.8 µM FeSO4·7H2O, 15 µM thiamine hydrochloride, 2.5 mM MgSO4·7H2O, 0.04% glucose, and 1 mM l-Leu) for several passages until the specific growth rate had become stable, and the strain with stable growth rate was used as the ancestor strain (Anc(C)). The OD600 of stationary-phase Anc(C) cultured in mM63gl medium was approximately 0.4 (approximately 3×10⁸ CFU/ml) because of glucose limitation. Qβ was kindly provided by Dr. Koji Tsukada (Osaka University, Japan), which was generated from Qβ genomic cDNA [23]. Qβ particles were diluted with LB medium and plaque assay was performed according to the standard method [48]. Polypropylene centrifuge tubes (15 ml, No. 430791; Corning Incorporated, Corning, NY) treated with 0.1% BSA for at least 15 minutes to prevent attachment of phages to the tube walls were used for all the experiments as culture tubes.
Experimental evolution system
Copropagation experiment: 4.8×10⁷ cells Anc(C) and 5.1×10⁷ PFU Anc(P) were mixed and copropagation was started in a culture volume of 3 ml at 37°C with shaking at 160 rpm. Mixed cultures were divided into 2 lines on the 18th day, equivalent to 59 replication generations, and propagated independently for a further 36 days (line 1 and line 2 in Figure 1B). Serial transfer was conducted by daily transfer of the cultures with cells and phages. The portion of cultures calculated based on the final OD600 were transferred into fresh medium with dilution to an initial OD600 of 0.05. Daily culture samples were divided into thirds: one for preparing −80°C frozen stocks with 15% glycerol, one for CFU determination by dilution and spreading on low divalent cation mM63gl agar medium with 0.2 mM MgSO4·7H2O, and the other for PFU analysis using the supernatant after centrifugation. Qβ propagation experiment: Two lines (line 3 and line 4 in Figure 1B) were independently propagated from Anc(P) for 18 days, equivalent to 168–169 replication generations, at 37°C with shaking at 160 rpm. Serial passages consisted of infection of a host culture, followed by about 6 h of phage growth, and extraction of the phage from the culture. Each serial passage was performed as follows: uninfected Anc(C) cultures were grown at 37°C overnight and transferred into new medium with dilution to OD600 of 0.03. When OD600 became 0.06–0.07 (approximately 1×10⁷ CFU/ml) after 2–2.5 h, cells were infected with phage to approximately 1.0–2.0×10⁷ PFU/ml from the previous passage. The cultures were grown for about 6 h. E. coli cells were removed by centrifugation, and the supernatant was subjected to filtration with 0.2 µm syringe filters (Minisart RC15 filters; Sartorius Stedim Biotech, Goettingen, Germany), and phage solution was stored at 4°C for infection on the next serial passage. The replication generation number of the phage population (n) was calculated as n = ln2 (Nf/Ni), where Ni and Nf are the phage density (PFU/ml) at the initial and final time points of each passage, respectively. The initial value (Ni) was calculated by dividing the Nf of the previous passage by the dilution rate.
Purification of E. coli and Qβ phage from mixed cultures
The evolved E. coli populations (M54(C), M163M(C), and M165_2(C)) and Qβ phage populations (M54(P), 163(P), and M165_2(P)) were purified from mixed cultures to analyze the phage genome sequence and to determine their fitness. To purify the evolved E. coli population, cultures stocked at −80°C including evolved E. coli and phage were streaked on mM63gl agar medium and then passaged several times in low divalent cation medium, 0.2 mM MgSO4·7H2O mM63gl, to prevent further phage adsorption to E. coli. We checked the purity of evolved E. coli by confirming that no plaques were observed in the passaged and chloroform-treated cultures. To purify the evolved phage population, cultures stocked at −80°C including evolved E. coli and phage were cultured in mM63gl at 37°C with shaking at 160 rpm for 1 day and filtrated with 0.2 µm syringe filters (Minisart RC15 filters; Sartorius Stedim Biotech). These particles were used for RNA genome sequencing analysis as described below. For analysis of phage fitness, these filtrated particles and Anc(P) were dialyzed to remove carry-over glycerol from the −80°C stock using Microcon centrifugal filter devices with 10,000 nominal molecular weight limit membranes (Millipore, Billerica, MA). We confirmed that the dialysis step did not affect plaque forming ability.
Genome sequencing of Qβ
The RNA genomes of the Qβ population noted in Figure 1B, i.e., 8 kinds of genome derived from approximately 108 PFU particles of the Anc(P), M54(P), M109(P), M163(P), M165_2(P), S94_3(P), S169_3(P), and S168_4(P) phage populations, were extracted using a QIAamp Viral RNA mini kit (Qiagen, Hilden, Germany) according to the manufacturer's instructions. To analyze the full-length RNA genome sequence, samples were prepared as follows. Poly(A) was added at the 3′ end using poly(A) polymerase (Applied Biosystems/Ambion, CA). cDNA was synthesized using the primer Qt (5′-CCAGTGAGCAGAGTGACGAGGACTCGAGCTCAAGCTTTTTTTTTTTTTTTTT-3′) with SuperScript™ III Reverse Transcriptase (Invitrogen, Carlsbad, CA), and then RNA was degraded with RNaseH. The first-strand cDNA was purified and poly(A) was added at the 3′ termini of the cDNA with terminal deoxynucleotidyl transferase (Roche Diagnostics, Basel, Switzerland) and dATP. The cDNA with poly(T) at the 5′ terminus and poly(A) at the 3′ terminus was purified. To obtain the 5′ end of the Qβ phage genome sequence, second-strand DNA was prepared using Qt primer and PfuUltra II Fusion HS DNA Polymerase (Stratagene, La Jolla, CA). PCR was performed separately with high fidelity DNA polymerases for the whole Qβ genome divided into 5 regions as shown in Table S3. In total, PCR products were obtained from cDNA template derived from approximately 106 PFU particles. The templates, primers, and polymerase used for PCR and the primers used for sequencing are listed in Table S3. Sequencing was performed by the dideoxynucleotide chain termination method [25] on both strands, but we conducted direct sequencing in one direction using 2 sets of primers only for the 5′ end of the genome (Table S3). When a double peak appeared in the sequencing chart, positions where the height of the smaller peak was over half that of the larger peak were defined as polymorphic sites.
Genome sequencing of E. coli
Genomic DNA was extracted from over 109 cells of Anc(C), M54(C), and M163(C) using a DNeasy Blood & Tissue Kit (Qiagen) according to the manufacturer's instructions. The genomic DNA of M163(C) was sequenced with an Illumina GAIIx (Illumina) using 51-bp of single-read format by Hokkaido System Science Co., Ltd. (Sapporo, Hokkaido, Japan). The GAIIx produced 18,718,549 reads and 954,646 kb. All reads were aligned to the reference sequence of E. coli DH1 genome sequence (GenBank accession number, CP001637.1; genome size, 4,630,707 bp) and F plasmid sequence (GenBank accession number, NC_002483.1; size, 99,159 bp) using MAQ [49] guaranteed to find alignments with up to 2 mismatches in the first 24 bp of the reads and 5 mismatches in 51 bp. Mean depth was 196 dividing 927,788 kb mapped bases by 4,730 kb of total reference sequences. After mapping and consensus base calling, SNPs were filtered with the same threshold values as reported previously [49]. The alignment view was also confirmed with Mapview [50], and SNPs were also scored with the following parameters: Phred quality score ≥20, variant frequency ≥0.40, coverage sum ≥5. In addition, Tablet [51] also has the ability to align short reads to the reference sequence, thus allowing us to score sites with a deletion, insertion, and/or regions with large insertions or deletions. SNPs, insertions, and deletions were scored for the F plasmid and for the M163(C) genome, and they were confirmed by sequencing using the dideoxynucleotide chain termination method for the genomes derived from over 107 cells of Anc(C) and M163(C) using the primers listed in Table S1. Two different positions observed in Anc(C) and M163(C) were sequenced for M54(C) by the dideoxynucleotide chain termination method.
Fitness assay
The cross-coculture experiment, time course analysis after infection, and adsorption rate constant analysis were conducted according to the methods described in Text S1.
Statistical analysis
Fitness and the time to reach the stationary phase were compared by one-way ANOVA with the post hoc Tukey test [52]. The virulence of Anc(P) and S94_3(P) to Anc(C) was compared with Welch's t test. The differences in growth rates calculated from semi-logarithmic plots of E. coli or phage densities were tested by two-tailed t test and ANCOVA with the post hoc Tukey test [53].
Supporting Information
Zdroje
1. MayRMAndersonRM 1983 Epidemiology and genetics in the coevolution of parasites and hosts. Proc R Soc Lond B Biol Sci 219 281 313
2. WoolhouseMEWebsterJPDomingoECharlesworthBLevinBR 2002 Biological and biomedical implications of the co-evolution of pathogens and their hosts. Nat Genet 32 569 577
3. LittleTJ 2002 The evolutionary significance of parasitism: do parasite-driven genetic dynamics occur ex silico? J Evol Biol 15 1 9
4. FennerF 1959 Myxomatosis. Br Med Bull 15 240 245
5. DecaesteckerEGabaSRaeymaekersJAStoksRVan KerckhovenL 2007 Host-parasite ‘Red Queen’ dynamics archived in pond sediment. Nature 450 870 873
6. Van ValenL 1973 A new evolutionary law. Evol Theory 1 1 30
7. DawkinsRKrebsJR 1979 Arms races between and within species. Proc R Soc Lond B Biol Sci 205 489 511
8. FutuymaDJSlatkinM 1983 Introduction. FutuymaDJSlatkinM Coevolution Sunderland, MA Sinauer Associates, Inc 7
9. Rodriguez-ValeraFMartin-CuadradoABRodriguez-BritoBPasicLThingstadTF 2009 Explaining microbial population genomics through phage predation. Nat Rev Microbiol 7 828 836
10. Rodriguez-BritoBLiLWegleyLFurlanMAnglyF 2010 Viral and microbial community dynamics in four aquatic environments. ISME J 4 739 751
11. HorneMT 1970 Coevolution of Escherichia coli and bacteriophages in chemostat culture. Science 168 992 993
12. ChaoLLevinBR 1977 A complex community in a simple habitat: an experimental study with bacteria and phage. Ecology 58 369 378
13. BohannanBJMLenskiRE 2000 Linking genetic change to community evolution: insights from studies of bacteria and bacteriophage. Ecology Letters 3 362 377
14. BucklingARaineyPB 2002 Antagonistic coevolution between a bacterium and a bacteriophage. Proc Biol Sci 269 931 936
15. SchulteRDMakusCHasertBMichielsNKSchulenburgH 2010 Multiple reciprocal adaptations and rapid genetic change upon experimental coevolution of an animal host and its microbial parasite. Proc Natl Acad Sci U S A 107 7359 7364
16. PatersonSVogwillTBucklingABenmayorRSpiersAJ 2010 Antagonistic coevolution accelerates molecular evolution. Nature 464 275 278
17. ScanlanPDHallARLopez-PascuaLDBucklingA 2011 Genetic basis of infectivity evolution in a bacteriophage. Mol Ecol 20 981 989
18. DuinJ 1988 Single-stranded RNA bacteriophages. CalendarR The Bacteriophage NY Plenum Press 117 167
19. DrakeJW 1993 Rates of spontaneous mutation among RNA viruses. Proc Natl Acad Sci U S A 90 4171 4175
20. DomingoEHollandJJ 1997 RNA virus mutations and fitness for survival. Annu Rev Microbiol 51 151 178
21. DuffySShackeltonLAHolmesEC 2008 Rates of evolutionary change in viruses: patterns and determinants. Nat Rev Genet 9 267 276
22. MoyaAHolmesECGonzalez-CandelasF 2004 The population genetics and evolutionary epidemiology of RNA viruses. Nat Rev Microbiol 2 279 288
23. TsukadaKOkazakiMKitaHInokuchiYUrabeI 2009 Quantitative analysis of the bacteriophage Qβ infection cycle. Biochim Biophys Acta 1790 65 70
24. EisenstarkA 1967 Bacteriophage Techniques. MaramoroschKKoprowskiH Methods in virology New York Academic Press 449 524
25. SangerFNicklenSCoulsonAR 1977 DNA sequencing with chain-terminating inhibitors. Proc Natl Acad Sci U S A 74 5463 5467
26. ManeewannakulKManeewannakulSIppen-IhlerK 1993 Synthesis of F pilin. J Bacteriol 175 1384 1391
27. HarrisRLShollKAConradMNDresserMESilvermanPM 1999 Interaction between the F plasmid TraA (F-pilin) and TraQ proteins. Mol Microbiol 34 780 791
28. AnthonyKGKlimkeWAManchakJFrostLS 1999 Comparison of proteins involved in pilus synthesis and mating pair stabilization from the related plasmids F and R100-1: insights into the mechanism of conjugation. J Bacteriol 181 5149 5159
29. TrotterVVinellaDLoiseauLOllagnier de ChoudensSFontecaveM 2009 The CsdA cysteine desulphurase promotes Fe/S biogenesis by recruiting Suf components and participates to a new sulphur transfer pathway by recruiting CsdL (ex-YgdL), a ubiquitin-modifying-like protein. Mol Microbiol 74 1527 1542
30. BernhardtTGWangINStruckDKYoungR 2001 A protein antibiotic in the phage Qβ virion: diversity in lysis targets. Science 292 2326 2329
31. BernhardtTGWangINStruckDKYoungR 2002 Breaking free: “protein antibiotics” and phage lysis. Res Microbiol 153 493 501
32. KarnikSBilleterM 1983 The lysis function of RNA bacteriophage Qβ is mediated by the maturation (A2) protein. EMBO J 2 1521 1526
33. AbedonSTHymanPThomasC 2003 Experimental examination of bacteriophage latent-period evolution as a response to bacterial availability. Appl Environ Microbiol 69 7499 7506
34. HeinemanRHBullJJ 2007 Testing optimality with experimental evolution: lysis time in a bacteriophage. Evolution 61 1695 1709
35. MessengerSLMolineuxIJBullJJ 1999 Virulence evolution in a virus obeys a trade-off. Proc R Soc Lond B 266 397 404
36. BootsMSasakiA 1999 ‘Small worlds’ and the evolution of virulence: infection occurs locally and at a distance. Proc Biol Sci 266 1933 1938
37. BootsMMealorM 2007 Local interactions select for lower pathogen infectivity. Science 315 1284 1286
38. KimuraM 1983 Neutral and nearly neutral mutations. The neutral theory of molecular evolution Cambridge, UK Cambridge University Press 43 46
39. AroraRPrianoCJacobsonABMillsDR 1996 cis-acting elements within an RNA coliphage genome: fold as you please, but fold you must!! J Mol Biol 258 433 446
40. KlovinsJBerzinsVvan DuinJ 1998 A long-range interaction in Qβ RNA that bridges the thousand nucleotides between the M-site and the 3′ end is required for replication. RNA 4 948 957
41. KlovinsJvan DuinJ 1999 A long-range pseudoknot in Qβ RNA is essential for replication. J Mol Biol 294 875 884
42. Domingo-CalapPCuevasJMSanjuanR 2009 The fitness effects of random mutations in single-stranded DNA and RNA bacteriophages. PLoS Genet 5 e1000742 doi:10.1371/journal.pgen.1000742
43. KishimotoTIijimaLTatsumiMOnoNOyakeA 2010 Transition from positive to neutral in mutation fixation along with continuing rising fitness in thermal adaptive evolution. PLoS Genet 6 e1001164 doi:10.1371/journal.pgen.1001164
44. BarrickJEYuDSYoonSHJeongHOhTK 2009 Genome evolution and adaptation in a long-term experiment with Escherichia coli. Nature 461 1243 1247
45. DrakeJWCharlesworthBCharlesworthDCrowJF 1998 Rates of spontaneous mutation. Genetics 148 1667 1686
46. WatanabeISakuraiTFuruseKAndoA 1979 “Pseudolysogenization” by RNA phage Qβ. Microbiol Immunol 23 1077 1083
47. CarterPBedouelleHWinterG 1985 Improved oligonucleotide site-directed mutagenesis using M13 vectors. Nucleic Acids Res 13 4431 4443
48. CarlsonK 2005 Appendix: Working with Bacteriophages: Common Techniques and Methodological Approaches. KutterESulakvelidzeA BACTERIOPHAGES Biology and Applications Boca Raton CRC Press 437 494
49. LiHRuanJDurbinR 2008 Mapping short DNA sequencing reads and calling variants using mapping quality scores. Genome Res 18 1851 1858
50. BaoHGuoHWangJZhouRLuX 2009 MapView: visualization of short reads alignment on a desktop computer. Bioinformatics 25 1554 1555
51. MilneIBayerMCardleLShawPStephenG 2009 Tablet–next generation sequence assembly visualization. Bioinformatics 26 401 402
52. ZarJH 2010 Multiple Comparisons. Biostatistical Analysis fifth edition Upper Saddle River Pearson educaion Inc 226 248
53. ZarJH 2010 Comparing simple linear regression equations. Biostatistical Analysis fifth edition Upper Saddle River Pearson educaion Inc 363 378
Štítky
Genetika Reprodukční medicínaČlánek vyšel v časopise
PLOS Genetics
2011 Číslo 8
- Kazuistika – Perspektivy využití precizované medicíny v rámci personalizované specifické terapie onkologických pacientů
- Nobelova cena za chemii pro genetické nůžky: Objev, který změní naši budoucnost?
- Technologie na bázi RNA v klinické praxi: od přebarvených petúnií k terapii vzácných a dosud jen obtížně léčitelných chorob u lidí
- „Nepředstavovali jsme si, že náš výzkum povede přímo ke vzniku nových léků, dokonce ještě za našeho života“
- Bezplatné služby pro diagnostiku ATTRv amyloidózy pro kardiology
Nejčtenější v tomto čísle
- An EMT–Driven Alternative Splicing Program Occurs in Human Breast Cancer and Modulates Cellular Phenotype
- Chromosome Painting Reveals Asynaptic Full Alignment of Homologs and HIM-8–Dependent Remodeling of Chromosome Territories during Meiosis
- A Pre-mRNA–Associating Factor Links Endogenous siRNAs to Chromatin Regulation
- Discovery of Sexual Dimorphisms in Metabolic and Genetic Biomarkers
Zvyšte si kvalifikaci online z pohodlí domova
Mazová zátka a její řešení
nový kurzVšechny kurzy