
A Variant in the Neuropeptide Receptor is a Major Determinant of Growth and Physiology
The mechanistic basis for how genetic variants cause differences in phenotypic traits is often elusive. We identified a quantitative trait locus in Caenorhabditis elegans that affects three seemingly unrelated phenotypic traits: lifetime fecundity, adult body size, and susceptibility to the human pathogen Staphyloccus aureus. We found a QTL for all three traits arises from variation in the neuropeptide receptor gene npr-1. Moreover, we found that variation in npr-1 is also responsible for differences in 247 gene expression traits. Variation in npr-1 is known to determine whether animals disperse throughout a bacterial lawn or aggregate at the edges of the lawn. We found that the allele that leads to aggregation is associated with reduced growth and reproductive output. The altered gene expression pattern caused by this allele suggests that the aggregation behavior might cause a weak starvation state, which is known to reduce growth rate and fecundity. Importantly, we show that variation in npr-1 causes each of these phenotypic differences through behavioral avoidance of ambient oxygen concentrations. These results suggest that variation in npr-1 has broad pleiotropic effects mediated by altered exposure to bacterial food.
Published in the journal:
. PLoS Genet 10(2): e32767. doi:10.1371/journal.pgen.1004156
Category:
Research Article
doi:
https://doi.org/10.1371/journal.pgen.1004156
Summary
The mechanistic basis for how genetic variants cause differences in phenotypic traits is often elusive. We identified a quantitative trait locus in Caenorhabditis elegans that affects three seemingly unrelated phenotypic traits: lifetime fecundity, adult body size, and susceptibility to the human pathogen Staphyloccus aureus. We found a QTL for all three traits arises from variation in the neuropeptide receptor gene npr-1. Moreover, we found that variation in npr-1 is also responsible for differences in 247 gene expression traits. Variation in npr-1 is known to determine whether animals disperse throughout a bacterial lawn or aggregate at the edges of the lawn. We found that the allele that leads to aggregation is associated with reduced growth and reproductive output. The altered gene expression pattern caused by this allele suggests that the aggregation behavior might cause a weak starvation state, which is known to reduce growth rate and fecundity. Importantly, we show that variation in npr-1 causes each of these phenotypic differences through behavioral avoidance of ambient oxygen concentrations. These results suggest that variation in npr-1 has broad pleiotropic effects mediated by altered exposure to bacterial food.
Introduction
In recent years, quantitative genetic approaches in the nematode Caenorhabditis elegans have identified quantitative trait genes (QTGs) for a diverse set of phenotypes [1]–[13]. While a few studies have employed genome-wide association mapping in wild isolates [4], [14], [15], most have relied on linkage mapping in recombinant inbred lines from crosses between the common laboratory strain, N2, and a wild strain from Hawaii [16]. N2, also called “Bristol” after the site of its original collection from the wild, was isolated around 1951. For the next 18 years, this strain was propagated in the laboratory for hundreds of generations, which likely led to adaptation to the laboratory environment [7]. Therefore, the use of the Bristol strain as a parent in recombinant inbred line panels may be expected to result in the identification of variants selected during laboratory adaptation. Indeed, the use of a laboratory-adapted strain in mapping panels has led to the identification of pleiotropic laboratory-derived variants in the classic model organisms S. cerevisiae [17], [18] and A. thaliana [19]. Variants specific to laboratory strains may be expected to show large and widespread phenotypic effects when traits related to fitness are measured in the same laboratory environment in which they were selected.
Here, we take advantage of an advanced intercross recombinant inbred line (RIAIL) panel from a cross between N2 and the Hawaii strain CB4856 [15] to identify the genetic basis of differences in lifetime fecundity, adult body size, susceptibility to an opportunistic human pathogen, and hundreds of gene expression traits. We use nearly isogenic lines (NILs) and loss-of-function alleles to show that the causative gene underlying a major QTL for all these traits is the neuropeptide receptor npr-1, which harbors a laboratory-derived variant in the Bristol strain [7], [15].
The version of the neuropeptide receptor NPR-1 found in the Hawaii strain responds to a single neuropeptide named FLP-21 [20]. By contrast, the variant in NPR-1 found in the Bristol strain causes an abnormal gain-of-function phenotype in which NPR-1 responds to FLP-21 and an additional unrelated neuropeptide FLP-18. McGrath and colleagues found that the variant of npr-1 found in the Bristol strain was selected sometime during laboratory propagation of the Bristol strain before long-term storage in 1969 [7]. All known wild nematode species, including all bone fide wild C. elegans strains, have the Hawaii version of NPR-1 that responds to FLP-21 [15], [21]. The abnormal response to the unrelated neuropeptide found only in the Bristol strain creates a hyperactive neural circuit through the RMG interneuron [22]. This abnormal circuit alters a wide variety of behaviors, including aggregation, aerotaxis, ethanol tolerance, hermaphrodite leaving, responses to nematode pheromones, sleep-like states, and avoidance of carbon dioxide, heat, and pathogen [5], [7], [9], [21]–[28]. We show that the physiological consequences of npr-1 variation are mediated by alteration of aerotaxis behavior. In this behavior, Bristol animals no longer seek lower oxygen levels when consuming bacterial food [24]. By contrast, normal wild-type C. elegans strains (like Hawaii) aggregate in the low oxygen regions at the edge of the bacterial lawn. This differential exposure to food during growth and development ultimately leads to differences in adult body size, fecundity, and physiology of C. elegans. These results illustrate the wide-ranging consequences of some laboratory-derived alleles and expand our understanding of the molecular basis and mechanism of pleiotropy.
Results
The Bristol and Hawaii strains differ in lifetime fecundity, adult body size, and response to pathogens
The N2 strain from Bristol, England and the CB4856 strain from Hawaii, U.S.A. differ significantly in many traits [16]. We phenotyped these two strains for lifetime fecundity and adult body size. The Bristol strain had more offspring and grew larger than the Hawaii strain when grown in standard laboratory conditions (Figures 1A and B). Additionally, we found that the growth difference between the Bristol and Hawaii strains is present from the first larval stage through adulthood (Figure S1). We previously identified a difference in susceptibilities to the opportunistic human pathogen Pseudomonas aeruginosa between the Bristol and Hawaii strains [8]. We extended this study to measure susceptibility to another human pathogen, the gram positive bacterium Staphylococcus aureus. Notably, the Bristol strain survived longer than the Hawaii strain when exposed to S. aureus, much like we had observed with P. aeruginosa (Figures 1C and S2). These phenotypic differences between the Bristol and Hawaii parents gave us the opportunity to identify the genetic variants that alter lifetime fecundity, adult body size, and resistance to S. aureus.

Linkage mapping defines a single QTL controlling diverse phenotypic traits
To identify these genetic variants, we scored a collection of advanced intercross recombinant inbred lines (RIAILs) that are mixtures of the Bristol and Hawaii genomes [15]. For all three traits, the phenotypic distributions of the RIAILs were closer to the mean parent phenotype of the Hawaii strain (Figure 1). Broad-sense heritability was 52% for adult fecundity, 57% for adult body size, and 72% for S. aureus sensitivity (see Methods). Next, we used linkage analysis to identify quantitative trait loci (QTL) that underlie the observed phenotypic differences. One or two significant QTL were detected for each trait (Figure 2). Remarkably, each of the three traits was influenced by a QTL in a shared region on chromosome X (QTLX). The confidence intervals for the location of these QTLX overlapped substantially (Table 1). Lifetime fecundity and adult body size also mapped to other QTL, respectively on chromosomes II and V. No other significant QTL were detected (see Methods). Statistical power calculations using 150 RIAILs show that 80% of QTL that account for 20% of phenotypic variance should have been detected. The detected QTL explained 18% to 33% of broad-sense heritability (adult fecundity: QTLX = 28%, QTLII = 18%; adult body size QTLX = 23%, QTLV = 23%; S. aureus sensitivity: QTLX = 33%). Therefore, the detected QTL likely represent most, if not all, of the large-effect QTL controlling these quantitative traits.


npr-1 is the causal gene underlying differences in the three traits
The overlapping confidence intervals of the QTL on the X chromosome contain the gene npr-1. Given that variation in npr-1 is known to cause phenotypic differences in multiple other traits [5], [7], [9], [21]–[28], we sought to determine whether variation in npr-1 also caused differences in the three traits described here. To narrow each QTL on the X chromosome, we took advantage of two nearly isogenic lines (NILs or congenics) in which the genome is derived from one strain background, except for a small region of the X chromosome that is derived from the other strain. The qgIR1 NIL is Bristol throughout its genome and Hawaii for a portion of the QTLX confidence interval. The kyIR9 NIL is Hawaii throughout its genome and Bristol for a portion of the QTLX confidence interval. We did two comparisons that test the npr-1 interval for causality in each of the three traits: we compared the Bristol parent to qgIR1 and the Hawaii parent to kyIR9 (Figure 3).

For lifetime fecundity, the Bristol parent had a mean brood size of 236 offspring compared to 177 offspring in the qgIR1 NIL that contains the Hawaii version of npr-1. This comparison shows that the Hawaii version of the introgressed region causes a 25% decrease in fecundity. The Hawaii parent had a mean brood size of 160 offspring, compared to 206 offspring in the kyIR9 NIL that contains the Bristol version of npr-1. This comparison shows that the Bristol version of the introgressed region causes a 29% increase in fecundity. Both of these comparisons were significant using Tukey's HSD test, with p = 0.0003 and p = 0.0059, respectively. The RIAILs with the Bristol allele at the most significantly linked marker had a mean brood size of 195 offspring, compared to 146 offspring for the RIAILs with the Hawaii allele, indicating that in the linkage mapping experiment the Hawaii allele caused a 25% decrease in fecundity. Thus, the fecundity differences between the NILs closely matched the phenotypic effect observed in the RIAILs.
For adult body size, the Bristol parent had a mean body length of 654 µm, compared to 604 µm in the qgIR1 NIL. This comparison shows that the Hawaii version of the introgressed region causes an 8% decrease in adult body size. The Hawaii parent had a mean body length of 587 µm, compared to 646 µm in the kyIR9 NIL. This comparison shows that the Bristol version of the introgressed region causes a 10% increase in adult body length. Both of these comparisons were significant using Tukey's HSD test, with p = 0.00148 and p = 6E-5, respectively. The RIAILs with the Bristol allele at the most significantly linked marker had a mean body length of 619 µm, compared to 578 µm for the RIAILs with the Hawaii allele, indicating that in the linkage mapping experiment the Hawaii allele caused a 7% decrease in mean body length. Just as with lifetime fecundity, the mean body length differences between the NILs closely matched the phenotypic effect observed in the RIAILs.
For susceptibility to S. aureus, the Bristol parent had a mean LT50 of 47 hours, compared to 34 hours in the qgIR1 NIL. This comparison shows that the Hawaii version of the introgressed region causes a 28% reduction in survival after exposure to S. aureus. The Hawaii parent had a mean LT50 of 30 hours, compared to 26 hours in the kyIR9 NIL. Unexpectedly, this comparison shows that the Bristol version of the introgressed region causes a 13% reduction in survival after exposure to S. aureus. We expected that the kyIR9 NIL with the QTL region derived from the Bristol strain would be more resistant than the Hawaii strain. We believe that we observed this difference for two reasons: (1) the kyIR9 NIL is slower and more uncoordinated than the qgIR1 NIL (R. Ghosh and L. Kruglyak, unpublished results) and spends more time on the deadly pathogen lawn, and (2) Hawaii alleles at other loci may interact with Bristol alleles of genes in this NIL region to make the animals more susceptible to S. aureus. The RIAILs with the Bristol allele at the most significantly linked marker had a mean LT50 of 41 hours, compared to 18 hours for the RIAILs with the Hawaii allele, indicating that in the linkage mapping experiment the Hawaii allele caused a 56% decrease in the mean LT50. This effect was much larger than observed using the NILs, consistent with a putative genetic interaction between this locus and the Hawaii background.
The NIL results indicate that the smallest region covered by the two NILs likely contains the gene with a causal role in the three phenotypic differences. The qgIR1 NIL has the smallest introgressed region, with seven genes from the Hawaii strain in an otherwise Bristol genetic background. Of these seven genes, only npr-1 and R08E3.3 have non-synonymous changes (comparison to WS210 sequence), and only R08E3.3 has a local gene expression QTL [1]. We focused our analyses on these two genes. RNAi knockdown or deletion of R08E3.3 does not affect fecundity, body size, and movement, nor cause any other obvious phenotypic effect [29], [30]. For this reason, we tested the role of npr-1 in lifetime fecundity, adult body size, and susceptibility to S. aureus.
To determine whether variation in the gene npr-1 causes these phenotypic differences, we used two independent loss-of-function alleles of npr-1, ad609 and ky13, derived in the Bristol genetic background. These two putative null alleles remove the dominant novel activity of npr-1 from the Bristol strain, and each strain behaves like the Hawaii strain by aggregating in regions of low oxygen at the edge of bacterial lawn [21]. For each of the three traits, the npr-1 loss-of-function alleles had similar phenotypes to the Hawaii parent, with effect sizes nearly matching those observed in the NILs (Figure 3). Therefore, variation in npr-1 is the cause of these large phenotypic differences observed between the Bristol and Hawaii strains.
npr-1-mediated aggregation causes drastic effects on the growth and physiology of C. elegans
The laboratory-derived allele of npr-1 present in Bristol causes animals to disperse across the E. coli bacterial lawn, whereas wild C. elegans strains aggregate at the edges of the bacterial lawn. This aggregation behavior is caused by a preference for low oxygen found in natural strains of C. elegans, and the edge of the bacterial lawn has a low oxygen concentration of approximately 10% [24]. By contrast, the rest of the agar plate and bacterial lawn have an oxygen concentration of approximately 21% oxygen. When the Hawaii strain is reared at 10% oxygen, it behaves like the Bristol strain and spreads out across the bacterial lawn because there is no longer a difference in oxygen concentration across the plate environment [8]. Previously, we showed that this oxygen preference behavior mediates differences in survival after exposure to P. aeruginosa [8]. We hypothesized that this “isolation” behavior also mediates the trait differences observed in this study.
In order to determine whether the oxygen preference behavior also controlled lifetime fecundity, adult body size, and susceptibility to S. aureus, we needed to reliably assay these traits at both 21% and 10% oxygen concentrations. The oxygen chamber had different humidity and temperature conditions than the standard S. aureus assay conditions, which altered the experimental results. Thus, we did not assay susceptibility to S. aureus at low oxygen concentration. For lifetime fecundity and adult body size assays, we raised the Bristol and Hawaii parent strains along with the npr-1 loss-of-function strain npr-1(ad609) in either ambient (21%) or low (10%) oxygen while consuming E. coli bacteria (see Methods). The reductions in lifetime fecundity observed in the Hawaii and npr-1(ad609) strains as compared to the Bristol strain were completely abrogated by rearing the animals at 10% oxygen (Figure 4A). Shifting the oxygen concentration was sufficient to increase the Hawaii brood size by 20% and the npr-1(ad609) brood size by 32%. The effect of npr-1 on this trait was thus eliminated by lowering the oxygen concentration and making animals disperse across the bacterial lawn. For adult body size, animals reared at 10% oxygen were significantly longer, and the reductions in mean body length observed in the Hawaii and npr-1(ad609) strains as compared to the Bristol strain were completely eliminated (Figure 4B). The Hawaii and npr-1(ad609) strains increase mean body length 18% and 19%, respectively, when compared to growth at 21% oxygen. To further test whether these differences in fecundity and body size are mediated by oxygen concentration differences, we tested whether loss of the oxygen-sensing gene gcy-35, which can suppress the aggregation behavior of npr-1(ad609) mutants [31], [32], can suppress the fecundity and body size defects as well. We observed that gcy-35(ok769); npr-1(ad609) double mutants had significantly more offspring (p = 0.005) and grew significantly larger (p = 0.0001) than npr-1(ad609) single mutants (Figures 4C and D).

The results of the oxygen experiments described above suggest that aggregation causes significant reductions in growth and offspring production. Aggregation is dependent on the density of animals grown on agar plate cultures [21], [22]. At low culture density of 125 animals per 10 cm agar plate, the Hawaii strain does not aggregate. By contrast, at high culture density of 400 animals per 10 cm agar plate, that strain readily aggregates at the edge of the bacterial lawn. To test whether differences in lifetime fecundity and adult body size between the Bristol and Hawaii strains depend on aggregation, we cultured animals at low (125), normal (1500), and high (4000) density (Figure 5). At low density, the Hawaii strain has more offspring and grows 7% larger than when reared at normal density. At high density, the Hawaii strain has approximately the same number of offspring and grows only 3% smaller than when grown at normal density. These results suggest that strains consuming standard E. coli bacterial food in large aggregates grow smaller and are less fecund than strains that do not grow in such aggregates.

Aggregation likely causes chronic underfeeding, which affects expression of signaling pathways and animal growth
One promising approach to connect DNA sequence variation to phenotypic variation is analysis of gene expression QTL (eQTL) [33]. Expression traits can implicate a known pathway in the physiological process that is altered by the variant and provide insight into how the variant causes phenotypic differences. Previously, we mapped thousands of eQTL between the Bristol and Hawaii strains [1]. A reanalysis of these data (see Methods) detected significant eQTL (false discovery rate = 5%) for 247 gene expression traits with confidence intervals that overlapped npr-1 (Figure 6A and Table S1). To determine whether differences in the function of npr-1 cause these gene expression differences, we profiled gene expression in the Bristol parent strain, the qgIR1 NIL (with the Hawaii version of npr-1 in a Bristol genetic background), and the predicted npr-1 loss-of-function allele ad609. The gene expression differences between the Bristol strain and the NIL or the Bristol strain and the predicted null allele should largely depend on npr-1. We estimated the npr-1 effects by fitting a linear model to the gene expression traits of these three strains (see Methods). Then, we compared the effect of the altered npr-1 function to the effect observed in the RIAILs (Figure 6B). We observed high correlations between the gene expression effects from altered npr-1 function (observed in the NIL or the loss-of-function allele) and the RIAIL effects for transcripts linked to the npr-1 locus. The regression slope was 1.82 (rho = 0.83), indicating a strong positive relationship. Thus, polymorphism in npr-1 is the major contributor to the gene expression differences observed for these 247 genes. These genes are significantly enriched for several gene ontology (GO) classes: neuropeptide and insulin signaling, transferring hexosyl groups (central carbon metabolism), and metabolic process (Table S1), suggesting that growth rate is one of the major physiological effects of altered npr-1 function and aggregation behaviors.
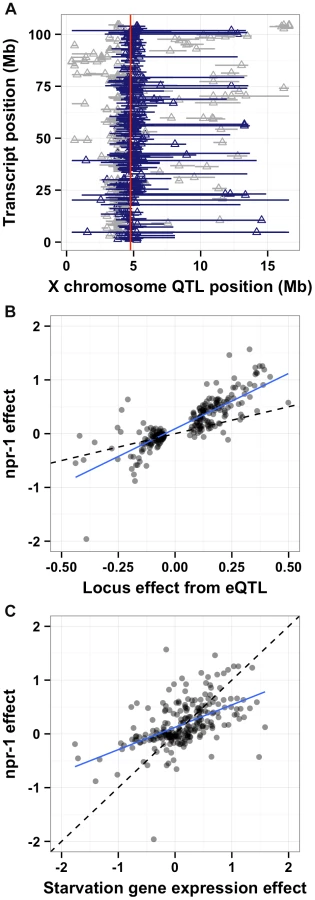
Reduced food availability or starvation is sufficient to decrease growth rates and fecundity in a variety of organisms, including C. elegans [34]. We hypothesized that the Hawaii strain might be chronically underfed, because in large aggregates bacterial food is depleted locally. To test this hypothesis, we obtained data on gene expression differences observed between starved and well fed Bristol animals [35] for the 247 genes whose expression linked to npr-1. Then, we compared the effect of the altered npr-1 function to the effect observed in the starvation experiments (Figure 6C). We observed positive correlations between the gene expression effects from altered npr-1 function and the effects of starvation on the Bristol strain. The regression slope was 0.76 (rho = 0.61), indicating a strong positive relationship and suggesting that at least some of the gene expression differences observed between strains with the laboratory-version of npr-1 and strains with the natural allele of npr-1 could be explained by reduced food availability. Starvation is known to alter pharyngeal pumping rate [36], [37] with starved animals pumping more once bacterial food is encountered again. We observed that the Hawaii strain pumps significantly more (p = 2E-16) than than Bristol strain (Figure 7A). This difference suggests that the Hawaii strain is underfed. To test how much the Hawaii strain eats when aggregated, we fed both the Bristol and Hawaii strains an E. coli bacterial food source expressing GFP. Using the COPAS Biosort, we measured the amount of green fluorescence per unit length inside each animal in the culture. Even though the Hawaii strain pumps more, the strain consumes less food than the Bristol strain (Figure 7B), likely caused by increased competition for food inside aggregates.

Discussion
We used linkage mapping to identify QTL that control differences in lifetime fecundity, adult body size, susceptibility to the human pathogen S. aureus, as well as expression of hundreds of genes between the Bristol laboratory strain (N2) and a Hawaii wild strain (CB4856). Taking advantage of reciprocal NILs and two loss-of-function alleles, we identified the neuropeptide receptor gene npr-1 as the quantitative trait gene underlying a QTL shared by all of these traits. Additionally, we showed that these large phenotypic effects are caused by variation in aggregation and feeding behaviors found between the Bristol and Hawaii strains mediated by npr-1.
The laboratory-derived variant of NPR-1 found in the Bristol strain is abnormally sensitive to an additional neuropeptide [20], creating a constitutively activated neural circuit through the RMG interneuron [22]. This hyperactive circuit causes Bristol animals to avoid each other and the edges of the bacterial lawn when consuming food. By contrast, the Hawaii strain aggregates at the edge of the bacterial lawn. The increased density of animals in an aggregate at the edge of the bacterial lawn may cause animals to deplete food faster than if they were spread across the bacterial lawn. Such local food depletion can cause physiological responses to decreased food [34], [38], [39], which can decrease fecundity and growth rate. We showed that the Hawaii strain consumes less food even though the strain has high pharyngeal pumping activity than the Bristol strain. These results suggest that the natural strains of C. elegans including the Hawaii strain (CB4856) are chronically underfed when reared in standard laboratory conditions. In support of this hypothesis, we observed a significant correlation between gene expression changes during starvation and those observed in strains with the Hawaii version of npr-1 on an abundant food source. Moreover, the genes that change expression as a result of npr-1 variation are enriched for neuropeptide signaling and growth. It is likely that animals in large aggregates locally deplete bacterial food at a faster rate than solitary animals, enter a physiological state similar to weak starvation, and decrease offspring production and growth rates to adapt to the decreased availability of food. Once the animals encounter a larger supply of food, growth and offspring production resume. Alternatively, it is possible that animals in large aggregates have reduced growth and offspring production because they experience higher local pheromone levels, indicating more competition from peers. We must perturb the putative pheromone receptor that controls growth and offspring production to make this functional connect. Thus far, we can not differentiate these alternative hypotheses. Regardless, the laboratory variant of npr-1 has large and diverse pleiotropic effects on the growth and physiology of the animal because it fundamentally alters behavior. These results illustrate how behavioral changes can translate to broad physiological effects, and provide a case study of the molecular and physiological mechanisms that underlie pleiotropy.
The highly pleiotropic laboratory allele of npr-1 affects growth and physiology of the Bristol strain long used by most C. elegans research laboratories. Given these large effects, it is not difficult to hypothesize how this particular allele was selected in the laboratory. Compared to wild C. elegans strains, the dispersal behavior of the Bristol laboratory strain makes it easier to select solitary individuals for maintenance or genetic crosses [7]. Others found that this strain is well adapted in a continuous food environment found in a research setting [40]. Additionally, we found that the Bristol strain has an increase in lifetime fecundity and enhanced survival after exposure to pathogens when grown under laboratory conditions. Lab-derived alleles of large-effect have also been observed in the standard laboratory strains of other common model organisms. For instance, in S. cerevisiae, loss-of-function mutations in AMN1 [17] and FLO8 [18] reduce two aggregation phenotypes—clumping and flocculation—and make S288C and related strains much easier to use in a laboratory setting. Similarly, the commonly used A. thaliana accession, Landsberg erecta, has EMS-derived mutations in the gene ERECTA [41], which enables the plants to grow more robustly in laboratory incubators [19]. In both of these organisms, just like in C. elegans, mapping studies employing recombinant inbred line panels that include these laboratory strains often find these derived alleles as major-effect QTL.
The Bristol strain has other laboratory-derived alleles with large phenotypic effects on the animal, including variants that alter oxygen and carbon dioxide avoidance [7] and fecundity [10], as well as many predicted functional variants [42], [43]. The large effects of these alleles in crosses using laboratory-derived strains could obscure the more modest phenotypic effects of natural alleles [44] and hinder their detection. Therefore, studies aimed at understanding natural genetic variation in C. elegans need to complement recombinant inbred line panels involving the Bristol strain with new panels derived from crosses using wild isolates. Additionally, it is important to devise assays of physiological traits that are not confounded by the effects of feeding behavior as observed on agar plates with a lawn of ample bacterial food. Because the standard Bristol strain has an abnormally active RMG neural circuit caused by high NPR-1 activity, behaviors observed in this strain may be idiosyncratic and not shared by wild strains, making the results of many behavioral studies harder to interpret in an evolutionary context.
Materials and Methods
Strains
Animals were cultured at 20°C with the bacterial strain OP50 on modified nematode growth medium (NGM), containing 1% agar and 0.7% agarose to prevent burrowing of the Hawaii strain and npr-1 loss-of-function strains. For each assay, strains were grown at ambient atmospheric conditions (i.e. 21% oxygen) for at least five generations with no strain entering starvation or encountering dauer-inducing conditions. To investigate the causality of npr-1 in our traits, we used two putative null alleles of npr-1: ky13, which has a C-to-T transition that introduces a stop codon after the first transmembrane domain; and ad609, which has two missense mutations - a threonine-to-isoleucine change in transmembrane domain two and a threonine-to-alanine change in transmembrane domain four [21].
Quantitative phenotyping
Lifetime fecundity assays
A modified NGM recipe with 2% agarose substituted for agar was used for all fecundity assays. Without this substitution, the Hawaii strain, RIAILs with the Hawaii version of npr-1, and npr-1 loss-of-function strains burrow readily and fecundity is difficult to measure accurately. 100 µL of overnight OP50 culture was spotted on each plate and dried in a laminar flow hood. For each genotype, single L4 larval stage hermaphrodites were picked to each of six plates. Plates were kept at 20°C for the duration of the assay. For each assay plate, the original adult hermaphrodite parent was picked to a fresh plate after 48 and 96 hours. The total offspring from each of these three plates was counted manually. Most strains had very few offspring after 96 hours. For population density experiments, assays were prepared and measured as described above, except animals were picked from 10 cm plates where population densities were defined to be 125, 1500, or 4000 animals per plate.
Adult body size assays
25–30 L4 hermaphrodites from each strain were picked to both of two 10 cm modified NGM agar plates. Strains were grown for four to five days and bleached to collect a approximately synchronous embryo population. Embryos were hatched for 15–24 hours at 20°C on a roller drum at a density of one embryo/µL in a total of 2 mL S medium. The hatched and arrested L1 larvae were plated onto three 10 cm plates at a density of 1500 animals/plate. Strains were grown for 72 hours at 20°C. Most of the animals were day-one adults when length and optical density was assessed using a COPAS Biosort (Union Biometrica). All objects smaller than 100 µm or 100 extinction units were removed from the analysis. Most of these objects were next generation L1 animals. Custom R scripts processed the data to obtain mean and median length and optical density values. Because the mean length was more heritable than any other measure, we used mean length for all future size calculations. Population density experiments were prepared and measured as described above, except a defined number of L1 larvae (125, 1500, or 4000) were plated per 10 cm modified NGM agar plate. The plates with 4000 animals were checked regularly and moved to fresh 10 cm plates if food became limiting.
Staphylococcus aureus survival assays
Staphylococcus aureus assay plates were made of brain heart infusion (BHI) agar (Gibco #211065) supplemented with Bactoagar (Gibco #214010) to a final agar concentration of 1.7%. The autoclaved agar was supplemented with nalidixic acid to a final concentration of 10 µg/mL and poured into 3.5 cm petri plates. S. aureus strain NCTC8325 was grown for 24 hours in BHI liquid media with nalidixic acid. Subsequently, 10 µL of bacterial suspension was spread onto the surface of the assay plates and grown at 37°C for 24 hours. After growth at 37°C, assay plates were kept at room temperature for no more than 24 hours at which point 30 L4 stage animals were added to each assay plate. The plates were incubated at 25°C and the fraction dead was scored every 12 hours from 0 to 48 hours. The LT50 was determined by fitting an exponential decay formula used previously [8].
Pharyngeal pumping assays
The pharynges of ten adult animals (24 hours after the fourth larval stage) were observed for one minute each in three separate trials. Animals were reared at 1500–2000 animals per 10 cm plate before each assay. Data were tabulated and analyzed using R.
Feeding rates
Animals were reared at high density (as before) on plates seeded with OP50. After washing off those plates, animals were plated onto our modified NGM plates seeded with HB101 expressing GFP at 2000 animals per plate. At this density, animals clumped within five minutes of plating. Two hours after plating out day-one adults, animals were washed off and assayed for green fluorescence using the COPAS Biosort. Green fluorescence was normalized by animal length (TOF parameter).
Quantitative trait mapping
Sets of advanced intercross recombinant inbred lines (RIAILs) from a cross between the Bristol (N2) and Hawaii (CB4856) strain were phenotyped as described above. The phenotype data and RIAIL genotype data [15] were entered into the R/qtl package [45]. In most cases, the phenotypes of the RIAILs were approximately normally distributed. QTL were detected using interval mapping [46]. The 5% genome-wide significance threshold was calculated based on 500 permutations of the phenotype data [47]. The marker with the highest LOD score was used as a covariate to identify additional QTL until no more significant QTL were detected. QTL model fitting and covariate analysis used normal models with the Haley-Knott estimator [48]. The fits were used to estimate the total phenotypic variance explained by each QTL. Broad-sense heritability was calculated as the fraction of phenotypic variance explained by strain from fit of a linear mixed-model of repeat phenotypic measures of the parents and RIAILs [49]. The total variance explained by each QTL was divided by the broad-sense heritability to determine how much of the heritability is explained by each QTL. Confidence intervals were defined as the regions contained within a 1.5 LOD drop from the maximum LOD score. 73, 145, and 109 RIAILs were scored for lifetime fecundity, adult body size, and susceptibility to S. aureus, respectively.
npr-1 causality experiments
Causality experiments compared phenotypes of six strains: the two parents (Bristol and Hawaii), the two NILs (qgIR1 and kyIR9), and the two loss-of-function alleles (npr-1(ad609) and npr-1(ky13)). The significance from every pairwise comparison was calculated using Tukey's Honest Significant Difference (HSD) test.
Gene expression assays and quantitative trait mapping
Expression data were corrected for dye effects using a linear model and phenotypic residuals were used for downstream analysis. Probes with polymorphisms were removed. We tested for linkage by calculating LOD scores for each genotypic marker and each trait as -n(ln(1-R∧2)/2ln(10)) where R is the Pearson correlation coefficient between the RIAIL genotypes at the marker and RIAIL trait values, as calculated in [49]. To estimate significance empirically, assignment of phenotype to each RIAIL was randomly permuted 1000 times while maintaining the correlation structure among phenotypes [50]. The maximum LOD score for each chromosome and trait was retained. The FDR was calculated as the ratio of expected peaks to observed peaks across different LOD thresholds. Genetic markers corresponding to QTL peaks which were significant at an FDR of 5% were added to a linear model for each trait. Trait-specific linear models that included the significant QTL genotypes as additive covariates were computed, and phenotypic residuals were estimated. Phenotypic residuals for each trait were then used for another round of QTL detection. This process of peak detection, calculation of empirical significance thresholds, and expansion of the linear model for each trait to include significant QTLs detected at each step was repeated three times. The LOD thresholds corresponding to a 5% FDR at each step were 3.8, 4.98, and 7.5. 2,447 QTL were detected by these analyses. Approximate 95% confidence intervals were determined using a drop of one LOD value. The confidence intervals of 247 QTL overlapped with the position of npr-1 and have genomic positions further than 10 kb from the QTL peak (Table S1).
RNA was collected and microarrays performed as described previously [1] for the strains Bristol, Hawaii, qgIR1, kyIR9, npr-1(ad609), and npr-1(ky13). Microarrays were processed using the R package Limma [51]. Non-uniform outliers and probes with signal well below background were removed. Median signals were background corrected. Within-array normalization was performed using the “loess” method. Between-array normalization was performed using the “Gquantile” method. Duplicate probes were averaged. Probes with SNPs between the Bristol and Hawaii strains were removed from the analysis. All microarray data are available through GEO (GSE49307).
For each of the 247 QTL identified previously, a linear model was fit per gene accounting for strain background and npr-1 status (Bristol-like or Hawaii-like) as covariates. Loss-of-function strains were considered to have a Bristol genetic background and Hawaii-like npr-1 status. Effect sizes were calculated as the multiple regression coefficient for npr-1 status. The Spearman correlation was calculated comparing these regression coefficients to the differences in expression from the eQTL results.
For the comparison to starvation gene expression, we used the GEOquery R package to download Agilent microarray data from GSE15656 [35] and extracted the gene expression ratios of six-hour starved to well fed L4 larvae. These ratios were compared to the effect sizes of the genes with distant QTL overlapping npr-1. Because we compared a starvation experiment using L4 larvae to our experiment using adult worms, we also analyzed the correlation between gene expression ratios from well fed L4 larvae [52] and our effect sizes. This correlation was much lower (rho = 0.22).
Gene ontology class enrichment
Using ProfCom [53], gene expression traits were analyzed for enrichment of GO terms. The following GO terms and reference numbers were significantly enriched: neuropeptide signaling pathway (0007218), transferring hexosyl groups (0016758), and metabolic process (0008152). The respective p-values were 5.47e-12, 2.89e-2, and 3.32e-2.
Oxygen concentration assays
Adult body size and lifetime fecundity were assessed as described above, except paired assays were prepared at 10% and 21% oxygen using a Coy hypoxia chamber with oxygen analyzer (Coy Laboratory Products, Grass Lake, MI). Oxygen was kept constant using a nitrogen gas source. The temperature inside the oxygen chamber was approximately 23.5°C, as opposed to 20°C in the incubator. For this reason, strains grow faster inside the oxygen chamber and paired comparisons for body size and fecundity to 21% oxygen were not appropriate. All statistical comparisons were performed within the oxygen growth conditions and not between. Given the differences in temperature and humidity between ambient and 10% oxygen, we did not assay susceptibility to S. aureus where assays are normally performed at 25°C.
Supporting Information
Zdroje
1. RockmanMV, SkrovanekSS, KruglyakL (2010) Selection at linked sites shapes heritable phenotypic variation in C. elegans. Science 330 : 372–376 doi:10.1126/science.1194208
2. SeidelHS, AilionM, LiJ, van OudenaardenA, RockmanMV, et al. (2011) A novel sperm-delivered toxin causes late-stage embryo lethality and transmission ratio distortion in C. elegans. Plos Biol 9: e1001115 doi:10.1371/journal.pbio.1001115
3. SeidelHS, RockmanMV, KruglyakL (2008) Widespread genetic incompatibility in C. elegans maintained by balancing selection. Science 319 : 589–594 doi:10.1126/science.1151107
4. GhoshR, AndersenEC, ShapiroJA, GerkeJP, KruglyakL (2012) Natural variation in a chloride channel subunit confers avermectin resistance in C. elegans. Science 335 : 574–578 doi:10.1126/science.1214318
5. BendeskyA, TsunozakiM, RockmanMV, KruglyakL, BargmannCI (2011) Catecholamine receptor polymorphisms affect decision-making in C. elegans. Nature 472 : 313–318 doi:10.1038/nature09821
6. PalopoliMF, RockmanMV, TinMaungA, RamsayC, CurwenS, et al. (2008) Molecular basis of the copulatory plug polymorphism in Caenorhabditis elegans. Nature 454 : 1019–1022 doi:10.1038/nature07171
7. McGrathPT, RockmanMV, ZimmerM, JangH, MacoskoEZ, et al. (2009) Quantitative mapping of a digenic behavioral trait implicates globin variation in C. elegans sensory behaviors. Neuron 61 : 692–699 doi:10.1016/j.neuron.2009.02.012
8. ReddyKC, AndersenEC, KruglyakL, KimDH (2009) A polymorphism in npr-1 is a behavioral determinant of pathogen susceptibility in C. elegans. Science 323 : 382–384 doi:10.1126/science.1166527
9. GlauserDA, ChenWC, AginR, MacinnisBL, HellmanAB, et al. (2011) Heat avoidance is regulated by transient receptor potential (TRP) channels and a neuropeptide signaling pathway in Caenorhabditis elegans. Genetics 188 : 91–103 doi:10.1534/genetics.111.127100
10. DuveauF, FélixM-A (2012) Role of pleiotropy in the evolution of a cryptic developmental variation in Caenorhabditis elegans. Plos Biol 10: e1001230 doi:10.1371/journal.pbio.1001230
11. GAERTNERBE, ParmenterMD, RockmanMV, KruglyakL, PhillipsPC (2012) More than the sum of its parts: a complex epistatic network underlies natural variation in thermal preference behavior in Caenorhabditis elegans. Genetics 192 : 1533–1542 doi:10.1534/genetics.112.142877
12. BendeskyA, PittsJ, RockmanMV, ChenWC, TanM-W, et al. (2012) Long-range regulatory polymorphisms affecting a GABA receptor constitute a quantitative trait locus (QTL) for social behavior in Caenorhabditis elegans. PLoS Genet 8: e1003157 doi:10.1371/journal.pgen.1003157
13. KammengaJE, DoroszukA, RiksenJAG, HazendonkE, SpiridonL, et al. (2007) A Caenorhabditis elegans wild type defies the temperature-size rule owing to a single nucleotide polymorphism in tra-3. PLoS Genet 3: e34 doi:10.1371/journal.pgen.0030034
14. AndersenEC, GerkeJP, ShapiroJA, CrissmanJR, GhoshR, et al. (2012) Chromosome-scale selective sweeps shape Caenorhabditis elegans genomic diversity. Nat Genet 1–8 doi:10.1038/ng.1050
15. RockmanMV, KruglyakL (2009) Recombinational landscape and population genomics of Caenorhabditis elegans. PLoS Genet 5: e1000419 doi:10.1371/journal.pgen.1000419
16. GAERTNERBE, PhillipsPC (2010) Caenorhabditis elegans as a platform for molecular quantitative genetics and the systems biology of natural variation. Genet Res 92 : 331–348 doi:10.1017/S0016672310000601
17. YvertG, BremRB, WhittleJ, AkeyJM, FossE, et al. (2003) Trans-acting regulatory variation in Saccharomyces cerevisiae and the role of transcription factors. Nat Genet 35 : 57–64 doi:10.1038/ng1222
18. BremRB, YvertG, ClintonR, KruglyakL (2002) Genetic dissection of transcriptional regulation in budding yeast. Science 296 : 752–755 doi:10.1126/science.1069516
19. van ZantenM, SnoekLB, ProveniersMCG, PeetersAJM (2009) The many functions of ERECTA. Trends Plant Sci 14 : 214–218 doi:10.1016/j.tplants.2009.01.010
20. RogersC, RealeV, KimK, ChatwinH, LiC, et al. (2003) Inhibition of Caenorhabditis elegans social feeding by FMRFamide-related peptide activation of NPR-1. Nat Neurosci 6 : 1178–1185 doi:10.1038/nn1140
21. de BonoM, BargmannCI (1998) Natural variation in a neuropeptide Y receptor homolog modifies social behavior and food response in C. elegans. Cell 94 : 679–689.
22. MacoskoEZ, PokalaN, FeinbergEH, ChalasaniSH, ButcherRA, et al. (2009) A hub-and-spoke circuit drives pheromone attraction and social behaviour in C. elegans. Nature 458 : 1171 doi:10.1038/nature07886
23. ReddyKC, AndersenEC, KruglyakL, KimDH (2009) A polymorphism in npr-1 is a behavioral determinant of pathogen susceptibility in C. elegans. Science 323 : 382–384 doi:10.1126/science.1166527
24. ChangAJ, ChronisN, KarowDS, MarlettaMA, BargmannCI (2006) A distributed chemosensory circuit for oxygen preference in C. elegans. Plos Biol 4: e274 doi:10.1371/journal.pbio.0040274
25. DaviesAG, BettingerJC, ThieleTR, JudyME, McIntireSL (2004) Natural variation in the npr-1 gene modifies ethanol responses of wild strains of C. elegans. Neuron 42 : 731–743 doi:10.1016/j.neuron.2004.05.004
26. JangH, KimK, NealSJ, MacoskoE, KimD, et al. (2012) Neuromodulatory State and Sex Specify Alternative Behaviors through Antagonistic Synaptic Pathways in C. elegans. Neuron 75 : 585–592 doi:10.1016/j.neuron.2012.06.034
27. HallemEA, SternbergPW (2008) Acute carbon dioxide avoidance in Caenorhabditis elegans. Proceedings of the National Academy of Sciences 105 : 8038–8043 doi:10.1073/pnas.0707469105
28. ChoiS, ChatzigeorgiouM, TaylorKP, SchaferWR, KaplanJM (2013) Analysis of NPR-1 Reveals a Circuit Mechanism for Behavioral Quiescence in C. elegans. Neuron 78 : 869–880 doi:10.1016/j.neuron.2013.04.002
29. YookK, HarrisTW, BieriT, CabunocA, ChanJ, et al. (2012) WormBase 2012: more genomes, more data, new website. Nucleic Acids Res 40: D735–D741 doi:10.1093/nar/gkr954
30. KamathRS, FraserAG, DongY, PoulinG, DurbinR, et al. (2003) Systematic functional analysis of the Caenorhabditis elegans genome using RNAi. Nature 421 : 231–237 doi:10.1038/nature01278
31. CheungBHH, Arellano-CarbajalF, RybickiI, de BonoM (2004) Soluble guanylate cyclases act in neurons exposed to the body fluid to promote C. elegans aggregation behavior. Curr Biol 14 : 1105–1111 doi:10.1016/j.cub.2004.06.027
32. GrayJM, KarowDS, LuH, ChangAJ, ChangJS, et al. (2004) Oxygen sensation and social feeding mediated by a C. elegans guanylate cyclase homologue. Nature 430 : 317–322 doi:10.1038/nature02714
33. RockmanMV, KruglyakL (2006) Genetics of global gene expression. Nat Rev Genet 7 : 862–872 doi:10.1038/nrg1964
34. SeidelHS, KimbleJ (2011) The oogenic germline starvation response in C. elegans. PLoS ONE 6: e28074 doi:10.1371/journal.pone.0028074
35. JoH, ShimJ, LeeJH, LeeJ, KimJB (2009) IRE-1 and HSP-4 contribute to energy homeostasis via fasting-induced lipases in C. elegans. Cell Metab 9 : 440–448 doi:10.1016/j.cmet.2009.04.004
36. AveryL, HorvitzHR (1990) Effects of starvation and neuroactive drugs on feeding in Caenorhabditis elegans. J Exp Zool 253 : 263–270 doi:10.1002/jez.1402530305
37. LuedtkeS, O'ConnorV, Holden-DyeL, WalkerRJ (2010) The regulation of feeding and metabolism in response to food deprivation in Caenorhabditis elegans. Invert Neurosci 10 : 63–76 doi:10.1007/s10158-010-0112-z
38. HubbardEJA, KortaDZ, DalfóD (2013) Physiological control of germline development. Adv Exp Med Biol 757 : 101–131 doi:_10.1007/978-1-4614-4015-4_5
39. DalfóD, MichaelsonD, HubbardEJA (2012) Sensory regulation of the C. elegans germline through TGF-β-dependent signaling in the niche. Curr Biol 22 : 712–719 doi:10.1016/j.cub.2012.02.064
40. Gloria-SoriaA, AzevedoRBR (2008) npr-1 Regulates foraging and dispersal strategies in Caenorhabditis elegans. Curr Biol 18 : 1694–1699 doi:10.1016/j.cub.2008.09.043
41. ToriiKU, MitsukawaN, OosumiT, MatsuuraY, YokoyamaR, et al. (1996) The Arabidopsis ERECTA gene encodes a putative receptor protein kinase with extracellular leucine-rich repeats. Plant Cell 8 : 735–746 doi:10.1105/tpc.8.4.735
42. WeberKP, DeS, KozarewaI, TurnerDJ, BabuMM, et al. (2010) Whole genome sequencing highlights genetic changes associated with laboratory domestication of C. elegans. PLoS ONE 5: e13922 doi:10.1371/journal.pone.0013922
43. McGrathPT, XuY, AilionM, GarrisonJL, ButcherRA, et al. (2011) Parallel evolution of domesticated Caenorhabditis species targets pheromone receptor genes. Nature 477 : 321–325 doi:10.1038/nature10378
44. RockmanMV (2011) THE QTN PROGRAM AND THE ALLELES THAT MATTER FOR EVOLUTION: ALL THAT'S GOLD DOES NOT GLITTER. Evolution no–no doi:10.1111/j.1558-5646.2011.01486.x
45. BromanKW, WuH, SenS, ChurchillGA (2003) R/qtl: QTL mapping in experimental crosses. Bioinformatics 19 : 889–890.
46. LanderE, BotsteinD (1989) Mapping Mendelian Factors Underlying Quantitative Traits Using RFLP Linkage Maps. Genetics 121 : 185.
47. DoergeRW, ChurchillGA (1996) Permutation tests for multiple loci affecting a quantitative character. Genetics 142 : 285–294.
48. HaleyCS, KnottSA (1992) A simple regression method for mapping quantitative trait loci in line crosses using flanking markers. Heredity 69 : 315–324.
49. BloomJS, EhrenreichIM, LooWT, LiteT-LV, KruglyakL (2013) Finding the sources of missing heritability in a yeast cross. Nature 494 : 234–237 doi:10.1038/nature11867
50. BremRB, KruglyakL (2005) The landscape of genetic complexity across 5,700 gene expression traits in yeast. Proc Natl Acad Sci USA 102 : 1572–1577 doi:10.1073/pnas.0408709102
51. SmythGK (2005) Limma: linear models for microarray data. Bioinformatics and Computational Biology Solutions Using R and Bioconductor Statistics for Biology and Health 397–420.
52. CapraEJ, SkrovanekSM, KruglyakL (2008) Comparative developmental expression profiling of two C. elegans isolates. PLoS ONE 3: e4055 doi:10.1371/journal.pone.0004055
53. AntonovAV, SchmidtT, WangY, MewesHW (2008) ProfCom: a web tool for profiling the complex functionality of gene groups identified from high-throughput data. Nucleic Acids Res 36: W347–W351 doi:10.1093/nar/gkn239
Štítky
Genetika Reprodukční medicínaČlánek vyšel v časopise
PLOS Genetics
2014 Číslo 2
- Kazuistika – Perspektivy využití precizované medicíny v rámci personalizované specifické terapie onkologických pacientů
- Nobelova cena za chemii pro genetické nůžky: Objev, který změní naši budoucnost?
- Technologie na bázi RNA v klinické praxi: od přebarvených petúnií k terapii vzácných a dosud jen obtížně léčitelných chorob u lidí
- „Nepředstavovali jsme si, že náš výzkum povede přímo ke vzniku nových léků, dokonce ještě za našeho života“
- Bezplatné služby pro diagnostiku ATTRv amyloidózy pro kardiology
Nejčtenější v tomto čísle
- Genome-Wide Association Study of Metabolic Traits Reveals Novel Gene-Metabolite-Disease Links
- A Cohesin-Independent Role for NIPBL at Promoters Provides Insights in CdLS
- Classic Selective Sweeps Revealed by Massive Sequencing in Cattle
- Arf4 Is Required for Mammalian Development but Dispensable for Ciliary Assembly
Zvyšte si kvalifikaci online z pohodlí domova
Mazová zátka a její řešení
nový kurzVšechny kurzy