
Perivascular Arrest of CD8 T Cells Is a Signature of Experimental Cerebral Malaria
Cerebral malaria is the most severe complication of Plasmodium falciparum infection. Utilizing the murine experimental model of cerebral malaria (ECM), it has been found that CD8+ T cells are a key immune cell type responsible for development of cerebral pathology during malaria infection. To identify how CD8+ T cells cause cerebral pathology during malaria infection, in this study we have performed detailed in vivo analysis (two photon imaging) of CD8+ T cells within the brains of mice infected with strains of malaria parasites that cause or do not cause ECM. We found that CD8+ T cells appear to accumulate in similar numbers and in comparable locations within the brains of mice infected with parasites that do or do not cause ECM. Importantly, however, brain accumulating CD8+ T cells displayed significantly different movement characteristics during the different infections. CD8+ T cells interacted with myeloid cells within the brain during infection with parasites causing ECM, but this association was not required for development of cerebral complications. Furthermore, our results suggest that CD8+ T cells do not cause ECM through the widespread killing of brain microvessel cells. The results in this study significantly improve our understanding of the ways through which CD8+ T cells can mediate cerebral pathology during malaria infection.
Published in the journal:
. PLoS Pathog 11(11): e32767. doi:10.1371/journal.ppat.1005210
Category:
Research Article
doi:
https://doi.org/10.1371/journal.ppat.1005210
Summary
Cerebral malaria is the most severe complication of Plasmodium falciparum infection. Utilizing the murine experimental model of cerebral malaria (ECM), it has been found that CD8+ T cells are a key immune cell type responsible for development of cerebral pathology during malaria infection. To identify how CD8+ T cells cause cerebral pathology during malaria infection, in this study we have performed detailed in vivo analysis (two photon imaging) of CD8+ T cells within the brains of mice infected with strains of malaria parasites that cause or do not cause ECM. We found that CD8+ T cells appear to accumulate in similar numbers and in comparable locations within the brains of mice infected with parasites that do or do not cause ECM. Importantly, however, brain accumulating CD8+ T cells displayed significantly different movement characteristics during the different infections. CD8+ T cells interacted with myeloid cells within the brain during infection with parasites causing ECM, but this association was not required for development of cerebral complications. Furthermore, our results suggest that CD8+ T cells do not cause ECM through the widespread killing of brain microvessel cells. The results in this study significantly improve our understanding of the ways through which CD8+ T cells can mediate cerebral pathology during malaria infection.
Introduction
Malaria remains a significant global health problem with 207 million cases, resulting in 584,000–1,238,000 deaths, annually [1, 2]. A high proportion of these deaths are due to cerebral malaria (CM), a neuropathology induced primarily by the species Plasmodium falciparum [2]. Current treatment of cerebral malaria is limited to parasiticidal chemotherapies, typically administered late in the course of infection. These traditional and narrowly targeted interventions are ineffective in many cases, and the mortality rate of CM, even after treatment, remains at 10–20% [3–5]. A greater understanding of the parasitological and immunological events leading to the development of CM would aid the development of improved therapeutic options to treat the condition.
Infection of susceptible strains of mice with Plasmodium berghei ANKA (Pb ANKA) results in the development of a serious neurological syndrome, termed experimental cerebral malaria (ECM), which recapitulates many of the clinical and pathological features of CM [6–10]. Susceptible mice typically develop neurological signs of disease including ataxia, convulsions, paralysis and coma between 6 and 8 days post infection [7, 11]. Histologically visible hemorrhages, widespread disruption of the vascular integrity and accumulation of leukocyte subsets are observed within the brain concomitant with the onset of signs of disease, [12–14]. The reason why Pb ANKA causes ECM while other strains of P. berghei, such as P. berghei NK65, do not is an area of active investigation. However, the differing virulence of P. berghei parasites does not appear to be due to extensive genetic polymorphisms between strains [15, 16].
Multiple cell types, including monocytes, macrophages, NK cells and CD8+ T cells accumulate within the brain at the onset of ECM [17–20]. However, to date, only CD8+ T cells have been identified as playing an unequivocal role in the development of cerebral pathology; protection from ECM is afforded by their depletion as late as one day prior to the development of neurological signs [10, 12, 19, 21]. The pathogenic parasite-specific CD8+ T cells are primed in the spleen by CD8α+ dendritic cells (DCs) [22] before migrating to the brain through homing dependent upon IFNγ-stimulated CXCL10 production in the CNS [23]. Monocytes play a role in recruitment of the pathogenic CD8+ T cells to the brain during ECM; however, the relative importance of this event in development of cerebral pathology remains undefined [19]. It has previously been shown that parasite-specific CD8+ T cells mediate ECM development through perforin - and granzyme B-dependent mechanisms [11, 24, 25], yet where the CD8+ T cells localize within the brain to cause ECM has remained unclear.
Parasite-specific CD8+ T cells appear to require in situ antigen-dependent stimulation within the brain to program their pathogenic activity necessary for ECM development [11]. To date, however, the identity of the putative antigen cross-presenting cells that interact with pathogenic CD8+ T cells during ECM is unknown. Recently, it has been shown that parasite specific CD8+ T cells can specifically interact with antigen cross-presenting microvessel cells obtained from mice experiencing ECM [26], but the relevance of this interaction for development of ECM in vivo is undefined.
In other models of neuroinflammatory diseases, such as experimental autoimmune encephalomyelitis (EAE), it has been demonstrated that professional antigen presenting cells (APCs) within the subarachnoid (SA) and perivascular spaces of the central nervous system (CNS) present antigen to T cells, instructing their pathogenic function [27–31]. Whether interaction of CD8+ T cells with brain-resident or infiltrating APC types is a canonical event in ECM development is largely unexplored and may represent a hitherto unexplored mechanism in the development of ECM.
In this study, we have attempted to reveal, in vivo, the mechanisms through which brain-infiltrating CD8+ T cells cause ECM. Using transcranial intravital two-photon microscopy, we report that T cells are recruited to, and accumulate perivascularly within, the SA and perivascular spaces of mice infected with both ECM-inducing and non-ECM-inducing Plasmodium berghei strains. However, a high proportion of perivascular T cells exhibited arrested behavior, consistent with immunological synapse formation [32–34], in the meninges specifically during ECM-inducing malaria infection. These arrested perivascular T cells formed cognate interactions with cells expressing CX3CR1, comprising inflammatory monocytes, macrophages and dendritic cells, but this event was redundant for ECM development. Pathogenic CD8+ T cells co-localized with apoptotic CD31+ cells in brains of mice with ECM, but apoptosis was a rare event in relation to the extensive vascular leakage observed during ECM. Combined, our results support a model where CD8+ T cells mediate ECM via direct recognition of cognate antigen on target cells without the need for additional in situ secondary activation in the brain by professional APCs and without causing apoptosis.
Results
Parasitaemia, neurological symptoms and cerebral vascular leakage during infection with Pb ANKA
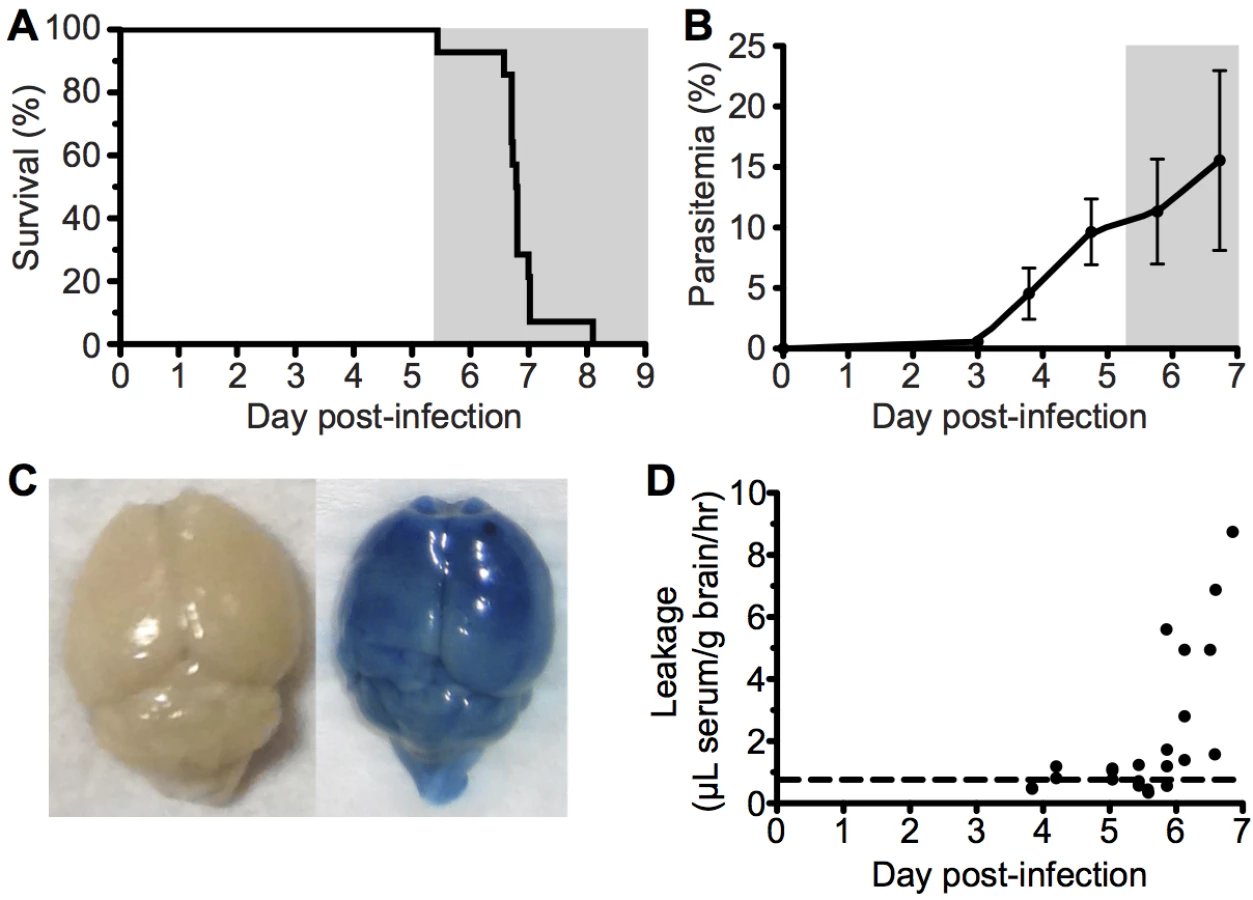
To investigate the immunopathological events that contribute to the development of ECM, we used the well-characterized Pb ANKA infection of C57BL/6 mice. Infected mice developed fatal neurological symptoms of ECM on day 6–7 post infection (p.i.) (Fig 1A), with a peak peripheral parasitaemia of around 15% (Fig 1B). The brains of symptomatic mice (day 6 p.i) displayed extensive vascular leakage, as assessed by Evans blue leakage, with diffuse blue coloration throughout the brain along with a few intense blue foci, which identify sites of petechial hemorrhage (Fig 1C). In contrast, brains from uninfected mice showed no discoloration (Fig 1C). Spectrophotometric quantification of Evans blue extravasation due to disruption of the cerebral vascular integrity revealed this to be a late occurring phenomenon, coinciding with the onset of ECM. (Fig 1D).
Cytoadherance of pRBCs in brain during malaria infections
A pathological hallmark of human CM is sequestration, or cytoadhesion, of parasitized RBCs (pRBCs) within the cerebral blood vessels [35, 36]. In agreement, utilizing static immunofluorescence detection methods, we observed low numbers of Pb ANKA pRBCs adhering to vascular endothelial cells in mice with advanced symptoms of ECM (Fig 2A and 2C). Importantly, no parasite accumulation was observed in the brains of mice during Pb NK65 infection (Fig 2B), a strain of malaria that causes similar peripheral parasite burdens but does not cause signs of cerebral dysfunction (S1 Fig). We subsequently performed intravital imaging through the thinned skull to study the nature of pRBC adhesion to vascular endothelial cells under physiological flow conditions during ECM. Comparable with results recently obtained by Nacer et al. [13], we observed low frequencies of Pb ANKA pRBC adhering to vascular endothelial cells (Fig 2D and 2E). This interaction was weak, and the pRBCs were quickly removed by the sheer force of blood flow (S1 Video). Surprisingly, by intravital imaging we also observed an increase in the number of pRBCs located in the perivascular space in mice with advanced symptoms of ECM (Fig 2F and 2G, S2 Video). In fact, on day 6 p.i., when the majority of mice developed ECM (9/14), perivascular pRBCs (∼3 pRBC/mm2) were found more often than adherent luminal pRBCs (∼2 pRBC/mm2). In those mice that developed ECM on day 7 p.i., there was a further significant increase in numbers of perivascular pRBCs (∼22 pRBC/mm2), which represents a 10-fold increase that is substantially more than that of peripheral parasitaemia (1.5-fold increase), or adherent luminal pRBCs (no increase), observed between days 6 and 7 p.i. In contrast to LCMV encephalitis, another CD8+ T cell-dependent immunopathological model, we did not observe any evidence of petechial hemorrhages during intravital imaging of meninges of mice with ECM. Thus, it is unlikely that the accumulation of pRBCs within the perivascular space during ECM was simply due to formation of and carriage within hemorrhages. (S2 Fig and S3 Video). These results show that parasite accumulation within the brain is a specific event associated with ECM. However, at the point of ECM development, perivascularly located pRBCs, determined as such by their location relative to the fluorescent endothelium, are at least as common as briefly adherent intravascular pRBCs (Fig 2H). The interaction of pRBCs or parasite-derived material with cells behind the blood vessel endothelial wall within the perivascular space may, therefore, be an important event in the development of ECM.

Comparable recruitment and activation of CD8+ T cells in the brains of mice infected with ECM-causing and non-ECM-causing P. berghei infections
CD8+ T cells are known to play a central role in the development of ECM [11, 17], yet the mechanisms through which they promote cerebral pathology during malaria infection remains poorly understood. It has been shown that despite the divergent infection outcomes, CD8+ T cells accumulate at similar levels in the brains of mice infected with Pb ANKA and Pb NK65 parasites [37]. We therefore hypothesized that brain accumulating CD8+ T cells exhibited intrinsic differences in phenotype activation status during Pb ANKA and Pb NK65 infections, explaining their pathogenic activity specifically during ECM-inducing infections. To test this hypothesis, we isolated leukocytes from the brains of infected and uninfected mice and characterized them via flow cytometry. As reported, similar frequencies and numbers of CD8+ T cells accumulated within the brains of mice infected with Pb ANKA and Pb NK65 on day 7 p.i., when mice infected with Pb ANKA developed ECM (Fig 3A and 3B). Moreover, comparable frequencies of brain accumulating CD8+ T cells expressed high levels of CD11a during Pb ANKA and Pb NK65 infections (Fig 3C), a marker of antigen experience [38, 39]. The intracerebral CD8+CD11ahigh parasite-specific T cells also displayed comparable activation in Pb ANKA and Pb NK65 infections, as evidenced by effector status (CD44+CD62L-) and increased expression of CD69, ICOS, KLRG1, CXCR3, and granzyme B (Fig 3D). Combined, these results show that CD8+ T cells recruited to the brains of mice infected with either ECM-causing or non-ECM causing parasites are similarly activated to cause cerebral pathology and that, although necessary, their presence alone is not sufficient for ECM development.

T cells are perivascularly located within the brain but display different behaviors in Pb ANKA and Pb NK65 infected mice
The comparable activation status of CD8+CD11ahigh parasite specific T cells in the brains of mice infected with Pb ANKA and Pb NK65 parasites on day 7 p.i. suggested that the disparate pathogenic activity of the cells during the two infections may be driven by CD8+ T cell extrinsic factors, which were not quantifiable through traditional flow cytometric analysis. To investigate this, we performed intravital imaging to study the compartmentalization and dynamics of T cells within the brain of hCD2-DsRed transgenic B6 mice during Pb ANKA and Pb NK65 infections. Few DsRed+ T cells were identified within the brains of naïve mice (Fig 4A) or on day 5 p.i. with Pb ANKA (S3 Fig), confirming the late accumulation of T cells in the brain during infection. Very few NK cells or B cells, which may express hCD2, were observed in the brains of infected mice on day 7 p.i. (S4 Fig). Characterization of T cells from isolated meningeal vessels of infected mice on day 7 p.i. showed them to be mainly CD8+ (>70%) (S5 Fig). The number of T cells/mm2 of vessel was increased within the brains of Pb ANKA and Pb NK65 infected mice (day 7 p.i.) compared with uninfected mice (Fig 4A and 4B). The relatively high numbers of T cells quantified by two photon microscopy compared with those given by whole brain flow cytometric analysis may reflect preferential meningeal T cell localization, diluted out by whole brain homogenization. Alternatively it may represent the failure to recover for flow cytometric analysis the Pb specific T cells that are tightly bound to target cells during ECM, a problem recently highlighted for T cell isolation from non-lymphoid tissues [40].

Surprisingly, the majority of T cells were compartmentalized to the perivascular side of the blood vessels during both Pb ANKA and Pb NK65 infections (70.5±10.3% vs 59.2±21.9%, respectively) (Fig 4C). Perivascularly located T cells were closely associated with the abluminal surface of blood vessels in mice infected with Pb ANKA and Pb NK65 parasites. Average distance from the vessel surface was, however, greater in mice infected with Pb NK65 than Pb ANKA parasites (5.9±7.4 μm v 3.1±4.8 μm, respectively) (Fig 4D). Interestingly, the distribution of T cells was not homogenous around the vessels imaged, with clusters of T cells observed preferentially around particular vessels (Fig 4E), which are most likely post-capillary venules [20].
It is becoming evident that the behavior of effector T cells, such as interaction with antigen presenting cells or responsiveness to chemokines and adhesion molecules, determines the local activity and function of the cells within the tissue [41, 42]. Thus, as T cells, of which greater than 70% are CD8+, were observed in comparable compartments of the brain during Pb ANKA and Pb NK65 infections, we next examined whether the cells displayed disparate behavior in the two infections, underlying their pathogenic activity specifically during Pb ANKA infection. Tracking DsRed+ cells revealed that perivascular T cells within brains of mice infected with Pb ANKA (S4 Video and S5 Video) exhibited a more arrested phenotype than those in mice infected with Pb NK65 (S6 Video and S7 Video). These differences were reflected in a lower mean track speed (8.7±4.4 v 15.7±5.6 μm/min), higher arrest coefficient (0.18±0.21 v 0.05±0.1) and lower confinement ratio (0.35±0.23 v 0.46±0.24), reflecting greater confinement (Fig 4F). The more constrained movement of perivascular T cells in brains of mice infected with Pb ANKA compared with Pb NK65 parasites is graphically illustrated by plotting 2D projections of tracks over 17 minutes that were then fixed to a common origin (Fig 4G). Thus, a major correlate of ECM is the perivascular arrest of CD8+ T cells.
Perivascular T cells within the subarachnoid space of mice with ECM form stable interactions with CX3CR1+/GFP cells
The arrest of perivascular T cells within brains of mice infected with Pb ANKA was consistent with immune synapse formation with antigen-expressing cells. The interaction of perivascular T cells with brain APCs has previously been shown to instruct T cell pathogenic functions in other models of T cell mediated cerebral pathology [43, 44]. Consequently, we next assessed the interaction of T cells with professional APC populations in the brains of mice infected with Pb ANKA and Pb NK65 utilizing hCD2-DsRed X CX3CR1+/GFP dual reporter mice, where GFP is expressed by subsets of monocytes, macrophages and DCs, and all microglia [45]. We found that perivascular T cells within brains of mice infected with either Pb ANKA or Pb NK65 were closely associated with CX3CR1+/GFP cells and made frequent interactions with their cellular processes (S8 Video and S9 Video). Consistent with results from the single-reporter hCD2-DsRed mice, arrested perivascular T cells were more numerous in mice infected with Pb ANKA than Pb NK65, and many were stably bound to CX3CR1+/GFP cells (Fig 5A–5C, S10 Video). Formation of longer lasting stable interactions between CX3CR1+/GFP cells and perivascular T cells was reflected by longer average contact times for individual perivascular T cells (Fig 5D) and the formation of fewer contacts with new CX3CR1+/GFP cells in mice infected with Pb ANKA than in mice infected with Pb NK65 (Fig 5E) over the course of the 17 minute imaging period. Combined with CD8+ T cell recruitment results, this raised the possibility that differences within the CX3CR1+/GFP population may determine the behavior, and associated pathogenicity, of perivascularly located T cells that enter the brain subsequent to their full activation in the spleen during Pb infection.

CX3CR1+/GFP cells with an activated phenotype accumulate within the brain during infection with ECM-causing and non-ECM-causing P. berghei infections
We hypothesized that the different nature of cognate interaction between T cells and CX3CR1+/GFP cells in the brains during Pb ANKA and Pb NK65 infections was due to alterations in the composition and/or activation of the brain CX3CR1+/GFP population during infection with Pb ANKA and Pb NK65. Thus, to more specifically identify and characterize the CX3CR1+/GFP cells present within the brain during the two infections, we isolated GFP+ leukocytes from the brains of infected and uninfected mice and characterized them for expression of phenotypic and functional markers. The frequencies of GFP+ cells (out of total leukocytes) in the brain increased comparably during infection with both Pb ANKA and Pb NK65 (Fig 6A). We subsequently sub-gated GFP+ cells into three subsets based on expression of CD11b and CD45; R1 = CD45intCD11bhi microglia, R2 = CD45hiCD11bhi meningeal and perivascular macrophages and inflammatory monocytes and R3 = a mixed population of CD45hiCD11bint leukocytes [46, 47] (Fig 6B). The majority of GFP+ cells in brains from uninfected mice were microglial cells (73.7±7.9%). During both infections, the proportion of microglia within the GFP+ population decreased (52.3±12.2% for Pb ANKA, 47.2±14.1% for Pb NK65), likely due to other GFP+ cells infiltrating the brain (Fig 6C). CD45hiCD11bint leukocytes were mainly CD11c+ DCs (Pb ANKA 82.8±10.3%, Pb NK65 74.5±8.6%) and CD45hiCD11bhi leukocytes were mainly Ly6Chi inflammatory monocytes (Pb ANKA 84.4±2.5%, Pb NK65 83.8±2.5%). Lack of CD11c and Ly6C expression on the CD45int CD11bhi population confirmed their identity as microglia (Fig 6D). These results demonstrate that the composition of the CX3CR1+/GFP population changed within the brain during malaria infection, and that it changed comparably during ECM-causing and non-ECM-causing malaria infection. Furthermore, in contrast to our hypothesis, infection with both Pb ANKA and Pb NK65 caused largely comparable activation of all three CX3CR1+/GFP populations with the most striking up-regulation of co-stimulatory (CD40 and CD80) and antigen presenting molecules (MHC-I) occurring in the CD45hiCD11bhi population (Fig 6E). Changes in T cell motility correlating with ECM could not be attributed to different T cell or myeloid cell surface phenotypes and, thus, in vivo motility represents a distinct parameter of value in assessing T cell function.

CX3CR1+ cells are dispensable for induction of ECM
The CD45hiCD11bhi monocyte and macrophage containing population (R2) displayed the most activated phenotype during infection and were also found to be enriched within the meninges, the site of imaging, compared with the whole brain (S6 Fig). Previous studies investigating the role of monocytes and macrophages in ECM pathogenesis have employed systemic administration of clodronate liposomes, CCR2 and Gr1 depleting antibody or AP20187 drug administration to MAFIA mice [19, 26, 48, 49]. None of these interventions prevented ECM development when given late in the course of infection. Crucially, however, these methods did not deplete populations located behind the endothelial barrier, including meningeal and perivascular macrophages or microglia. Accordingly, we addressed the contribution of these cells, and by association the importance of T cell interactions with them, in the development of ECM. Depletion of systemic and meningeal and perivascular macrophages through combined intraperitoneal (i.p.) and intracerebroventricular (i.c.v.) injection of clodronate liposomes (C.L.) using a protocol adapted from Galea et al. [50], from day 5 p.i. failed to protect mice against development of ECM (Fig 7A). Furthermore, specific depletion of CX3CR1 expressing cells, including perivascular and meningeal macrophages and microglia, from day 3 of infection utilizing CX3CR1-iDTR mice [51] also failed to inhibit development of ECM (Fig 7B). This was despite large scale depletion of brain resident macrophages and microglia, as shown by reduced Iba1 staining (Fig 7C). Our results, therefore, indicate that although stable interaction of T cells with CX3CR1+/GFP APCs is a frequent event, specifically during Pb ANKA infection, this activity is redundant for the development of ECM.

Parasite-specific CD8+ T cells recapitulate ECM pathology in resistant TCR Tg mice
To further analyze the mechanisms through which CD8+ T cells mediate ECM, we developed a tractable Ag-specific model, where CD8+ T cells with bona fide pathogenic activity can be visualized and tracked. Adoptive transfer of 106 SIINFEKL-specific OT-I CD8+ T cells into otherwise ECM-resistant P14 TCR transgenic mice, in which most CD8+ T cells express the receptor specific for the gp33 epitope of LCMV [52], led to the robust development of ECM when mice were subsequently infected with a GFP-SIINFEKL-expressing strain of Pb ANKA parasite (Pb-TG) (Fig 8A and 8B). Consistent with results obtained when examining the polyclonal T cell response (Fig 4), DsRed-expressing OT-I CD8+ T cells were recruited to the brain of P14 hosts in response to infection with Pb-TG (Fig 8C). These brain recruited OT-I CD8+ T cells were predominantly perivascular, as determined by their location relative to the fluorescent endothelium (Fig 8D). Perivascular OT-I CD8+ T cells were, however, more highly arrested than the polyclonal T cells with a mean speed of 2.36±2.32 μm/min and a mean arrest coefficient of 0.829±0.256 (Fig 8E, S11 Video). Differences in Ag-specific and polyclonal T cell behavior are likely due to the varied specificity of the complex polyclonal CD8+ T cell population for different parasite molecules, heterogeneously expressed by cells within the brain, [53]. Transferred OT-I CD8+ T cells behaved comparably in infected wild type and P14 hosts, indicating that their highly arrested behavior was not an artifact of the transgenic recipient (S7 Fig). As our results argue against the requirement for secondary activation by brain APCs to endow brain-infiltrating CD8+ T cells with pathogenic activity during Pb ANKA infection (Fig 3), it is likely that the arrested T cells are attached directly to antigen-presenting target cells, and that such interaction contributes to ECM pathogenesis. These results further emphasize that perivascular arrest of antigen-specific CD8+ T cells is a consistent signature of ECM.

ECM induces increased apoptosis of brain endothelial cells but not sufficiently to account for widespread vascular leakage
It has recently been proposed that CD8+ T cells can directly interact with antigen expressing endothelial cells, and that this interaction may be a proximal event in causing endothelial cell apoptosis and ECM development [24, 26]. We, therefore, assessed the level of apoptosis within the brains of mice with ECM. Detection of apoptotic cells during intravital imaging was attempted by i.v. injection of an active-caspase3/7-reporter molecule, CellEvent. However, no CellEvent-positive cells were observed by transcranial microscopy, suggesting that cellular apoptosis is a rare event in the brain during ECM. This was confirmed by ex vivo examination of thick coronal sections from mice injected with CellEvent, allowing for a larger volume of the brain to be surveyed (Fig 9A), with only 11.2 cells/mm3 apoptotic cells found in the vasculature of the cortex of brains of mice with ECM, compared with 1.36 cells/mm3 in naïve brains (Fig 9B). Although rare, apoptotic cells could be found in immediate contact with parasite-specific CD8+ T cells (Fig 9C), suggesting that the CD8+ T cells were mediating the cellular apoptosis. The low level of cellular apoptosis in the brains of mice with ECM was further confirmed by immunofluorescent staining of thick cortical sections with antibodies against activated caspase 3 (Fig 9D–9F). Brains from mice subject to middle cerebral artery occlusion induced stroke were used to confirm successful activated caspase 3 staining (S8 Fig). Co-staining of activated caspase 3 and CD31 demonstrated that the rare apoptotic cells present during ECM were associated with the vasculature. By examination of morphology, apoptotic cells were identified as both endothelial cells (Fig 9G) and vasculature associated leukocytes (Fig 9H). Apoptotic cells may be rapidly cleared, particularly under physiological blood flow conditions, potentially explaining the low levels of apoptosis observed in the brains from mice with ECM. However, no differences were observed in either total number of vessels (Fig 9I and S9 Fig) or vessel area (Fig 9J and S9 Fig) in brains from mice with ECM compared with uninfected mice. Despite this, as previously reported, extensive vascular leakage was observed in ECM (Fig 9K). Thus, our results indicate that CD8+ T cells do not cause extensive vascular leakage via endothelial cell apoptosis; rather, our results support an alternative model in which perforin and granzyme B release, by perivascular parasite-specific CD8+ T cells, induces opening of intercellular junctions of the endothelium.

Discussion
In this study, we have shown that CD8+ T cells accumulate at high levels in the perivascular space of the brain during malaria infection. The perivascular compartment of the brain is a hitherto understudied location in the study of ECM pathogenesis, even though, consistent with our results, leukocytes have previously been observed in this space during ECM using electron microscopy [54, 55]. Although, our intravital studies examined the superficial regions of the brain, perivascularly located CD8+ T cells were also observed around vessels deeper in the brain during ECM (S10 Fig), suggesting that this phenomenon is not unique to pial vasculature. Our results extend the study of Nacer et al, which used acute labeling with intravenous fluorescent antibodies to detect intravascular CD8+ T cells during ECM [20]. We have utilized a genetically encoded fluorescent protein, expressed in all T cells, coupled with the phenotypic analysis of T cells in the CNS to reveal a large population of extravasated, but still perivascular, CD8+ T cells that were previously unappreciated.
Interestingly, we observed accumulation of CD8+ T cells in the perivascular spaces of the brain during both ECM-inducing and non-inducing infections, indicating that the presence of perivascular T cells per se is insufficient to cause ECM. Instead, dynamic time-lapse movies revealed distinct behaviors of these cells in the perivascular compartment during the different infections, suggesting that it is T cell motility in the brain that correlates with their pathogenic activity during malaria infection. Infection with ECM-causing parasites resulted in a higher proportion of perivascular T cells, including Ag-specific CD8+ T cells that directly contribute to ECM, exhibiting behavior consistent with immunological synapse formation, including lower mean speed, higher mean arrest coefficient and lower mean confinement ratio. Whilst, further work is required to definitively resolve whether T cells interact with other cells within the brain during ECM through classical or atypical synaptic associations, these findings demonstrate the utility of two-photon microscopy in revealing information on important dynamic cellular behaviors of leukocytes that contribute to disease.
Perivascular CD8+ T cells were observed forming stable interactions with CX3CR1+/GFP cells, specifically during infection with ECM-causing Pb ANKA parasites. Such interactions between perivascular APCs and T cells, leading to secondary in situ reactivation, are known to be essential for the development of pathology in other neuro-inflammatory models such as EAE [43, 44]. However, perturbation studies using clodronate liposomes and the CX3CR1/iDTR system [51] to deplete CX3CR1+ cells demonstrated that this interaction is not critical for development of ECM. Thus, CD8+ T cells mediate ECM via interaction with other non-myeloid cell populations within the brain. These results extend previously published data that peripheral myeloid cells are not required for terminal ECM development [17, 19, 48, 49] to also show that resident or recruited myeloid cells positioned behind the tight endothelial barrier of the cerebral vasculature do not non-redundantly contribute to ECM pathogenesis. This difference between EAE and ECM is perhaps unsurprising when the location of disease-associated tissue damage is considered. Whilst in EAE, perivascular T cells must receive further stimulation to cross the glia limitans into the parenchyma, where the disease-associated pathology occurs [27, 56], in malaria the ECM-associated pathology is focused primarily to the cerebral vasculature [13], which is accessible to both luminal and perivascular CD8+ T cells. However, in contrast to luminal cells, it is also possible that arrested perivascular CD8+ T cells may exert a secondary activity during ECM by interacting with the glia limitans. This may induce signals into the parenchyma of the brain, contributing to the activation and injury of brain-resident cells including astrocytes, microglia and neurons, which is observed during ECM [57–59].
Thus, the critical questions are 1) why do T cells behave differently in the brains of ECM-inducing and non-inducing malaria infections, and 2) why can they specifically cause cerebral pathology only during Pb ANKA infection? We found that intracerebral CD8+ T cells possess an equally activated phenotype in mice with ECM-causing and non-ECM causing infections, indicating that upon migration to the brain, CD8+ T cells possess the intrinsic ability to mediate cerebral pathology, as long as they receive the necessary tissue signal. This result is in agreement with Howland et al. who reported that parasite specific CD8+ T cells with cytolytic potential [26] are found within the brains of mice infected with non-ECM causing parasites. Indeed, it is likely that T cells recruited to the brain during Pb ANKA and NK65 infections exhibit comparable antigen specificities, as a number of the most immunogenic antigens are conserved between Pb ANKA and other murine Plasmodium parasites [60, 61]. Moreover, CD8+ T cells specific for EIYIFTNI (F4: replication protein A1), IITDFENL (Pb2: bergheilysin) and SQLLNAKYL (Pb1: PbGAP50) epitopes are observed at similar frequencies in the brains of Pb NK65 and Pb ANKA infected mice [26, 61]. Thus, Howland et al. suggested that the ability of CD8+ T cells to mediate pathology specifically during Pb ANKA infection is the presentation of parasite antigen by microvessel endothelial cells in the brain during this infection. This hypothesis is consistent with Haque et al.’s report that antigen-specific CD8+ T cells migrate to the brain, but do not induce ECM until a critical antigen threshold is reached within the brain [11].
The source of malarial antigen and its mode of presentation to pathogenic T cells specifically during ECM-inducing malaria infections has been a subject of intense investigation. A number of studies have shown that, despite similar peripheral parasitemia in the blood, parasite accumulation within the brain is higher during infection with ECM-causing parasites than non-ECM causing parasites [26, 37]. Similarly, greater parasite accumulation is found in the brains of ECM-susceptible strains of mice than resistant strains [37]. In agreement with these studies, we observed significantly higher accumulation of Pb ANKA parasites than Pb NK65 parasites within the brain on day 7 of infection, when Pb ANKA infected mice developed ECM. Whilst these data support a major role for parasite accumulation in the brain in ECM-pathogenesis, Pb ANKA parasite accumulation was infrequent compared with the level of P. falciparum sequestration observed during CM. Moreover, consistent with Nacer et al [13], we failed to observe high levels of adhesion of luminal parasites to brain vascular endothelium during Pb ANKA infections by intravital imaging. Thus, although Pb ANKA sequestration does not lead to vessel occlusion during ECM, accumulation of pRBCs within the brain, and specifically within the perivascular space, may provide a localized source of antigen for cross-presentation by endothelial or associated cells during Pb ANKA infection, enabling perivascular CD8+ T cells to mediate their pathogenic activity. Notably very recently, Howland et al. [53] have also shown that brain endothelial cells are significantly more efficient at cross presenting Pb ANKA parasites than Pb NK65 or P. yoelii NL parasites, providing a further mechanism for increased antigen expression with the brain during Pb ANKA infection than in other non-ECM inducing infections. Detailing the properties and features of Pb ANKA parasites that cause them to reproducibly promote ECM, unlike other Pb isolates, require further investigation, especially as there appears to be little genetic polymorphism between them [15, 16].
Irrespective of how CD8+ T cells encounter antigen within the brain during Pb ANKA infection, the question remains as to the mechanism through which they mediate ECM pathology. The requirement for perforin and granzyme B in CD8+ T cell-mediated disruption of cerebral vascular integrity, leading to ECM, has previously led to the hypothesis that CD8+ T cells directly induce apoptosis of endothelial cells within the brain [11, 24, 25]. In support of this, perivascularly located T cells were closely associated with the abluminal surface of blood vessels in both infections but more so in mice infected with Pb ANKA than Pb NK65 parasites. However, although increased above levels seen in brains from uninfected mice, the number of apoptotic endothelial cells within the brains of mice with ECM appeared insufficient to account for the extensive vascular leakage, which occurs during ECM. Importantly, the low level of endothelial cell apoptosis during ECM, detected by two independent methods, was not due to rapid clearance of dying cells, as there was no widespread loss of vascular endothelial cells in brains of mice with ECM. The surprisingly low level of cellular apoptosis in the brain during ECM is potentially due to the rapid progression of the ECM syndrome and the late recruitment of relatively low numbers of activated CD8+ T cells. Thus, as CTLs appear to locate target cells through a stochastic search strategy, and CTL immunological synapses last between 30 minutes and 6 hours [62, 63], each individual recruited CTL may target and kill a limited number of endothelial cells before the animal succumbs to infection. Consequently, our results support a model whereby vascular leakage during ECM predominantly occurs at the level of the interendothelial tight junctions without, or long before, causing endothelial cell death [13]. Supporting this hypothesis, Suidan et al. have demonstrated the ability of intracerebral antigen-specific CD8+ T to initiate central nervous system vascular leakage through a perforin-dependent mechanism involving VEGF, that down-regulates tight junction proteins 12–24 hours before activation of the apoptotic caspase cascade [64]. Notably, VEGF is increased in the brains of mice with ECM [65] and humans with CM [66, 67] and has been shown to inhibit endothelial cell apoptosis [68–70]. This scenario provides a potential explanation for the rapid recovery from ECM and reestablishment of the vascular integrity that can occurs after administration of anti-malarial drugs, which would not be possible if vascular dysfunction was mediated through extensive loss of endothelial cells.
In summary, we have presented data that highlights the perivascular space as a site of significant CD8+ T cell accumulation during murine malaria infections. This site was additionally found to be a site for pRBC accumulation. Together, our results suggest that pathogenically relevant interactions between CD8+ T cells and their target cells, most likely cross presenting endothelial cells, may occur at the perivascular aspect of affected vessels, shifting the focus from intraluminal events to include this previously underappreciated location. We, therefore, propose that infection with malaria parasites results in accumulation of perivascular antigen-specific CD8+ T cells and antigen-dependent in-situ active engagement of the T cell receptor, only during Pb ANKA infection, leading to alteration of tight junction proteins, increased vascular permeability and death before the widespread occurrence of endothelial cell apoptosis (Fig 10).

Materials and Methods
Ethics
Animal work in New York was carried out in strict accordance with the recommendation in the Guide for the Care for the Care and Use of Laboratory Animals of the Public Health Service (National Institutes of Health) and was approved by New York University School of Medicine Institutional Animal Care and Use Committee (IACUC). Animal work in the U.K. was approved following local ethical review by the Universities of Manchester and Glasgow Animal Procedures and Ethics Committees and was performed in strict accordance with the U. K Home Office Animals (Scientific Procedures) Act 1986 (approved H.O Project Licenses 70/6995 and 70/7293). All surgery was performed under anesthesia: ketamine (50 mg/kg), xylazine (10 mg/kg), acepromazine (1.7 mg/kg); or isoflurane (2% in O2 at 0.2 L/min).
Mice
The following mice were used in the study: At Skirball Institute Animal facility, C57BL/6 (H-2b) from the National Cancer Institute or Taconic Labs, OT-I [71], P14 [52], CFP [72], DsRed [73], CX3CR1CreER X Rosa26iDTR mice [51]. Both CFP and DsRed were expressed under the control of a chicken β-actin promoter and CMV enhancer cassette. CX3CR1CreER X Rosa26iDTR (referred to as CX3CR1-iDTR) mice express Cre in CX3CR1+ cells upon treatment with tamoxifen, inducing expression of the diphtheria toxin receptor (DTR) and, thus, sensitivity to diphtheria toxin (DT) in those cells. At the Universities of Glasgow and Manchester, C57BL/6 mice from Harlan and Charles River, UK, hCD2-DsRed [74], CX3CR1GFP/GFP [45], CX3CR1GFP/GFP X C57BL/6 (F1) and CX3CR1GFP/GFP X hCD2-DsRed+/+ mice (F1). In all cases, transgenic mice were fully backcrossed to a C57BL/6 background and were used between 6 and 12 weeks of age. Mice were maintained in specific pathogen-free conditions.
Parasites
GFP-expressing P.berghei ANKA parasites (GFP expressed under control of elogation factor 1a [eEF1a] promoter) were a kind gift from Chris Janse (Leiden University Medical Center) [75]. GFP/SIINFEKL-expressing P.berghei ANKA (Pb-TG) parasites were a kind gift from William Heath (University of Melbourne) [22]. P.berghei NK65 parasites expressed GFP under control of the circumsporozoite promoter [76]. Parasites were maintained in liquid nitrogen and passaged through naive mice prior to being used to infect experimental animals. Experimental infections were initiated by i.v. inoculation with 104 or 106 pRBCs, depending upon the experiment, and infected mice were monitored for neurological symptoms (paralysis, ataxia, convulsions, and coma occurring between day 6 and 10 post-infection). Parasitemia was measured daily from day 3 p.i. by either examination of Giemsa-stained thin blood smears or by flow cytometric detection of DAPI stained GFP+ parasites (S11 Fig).
Classification of experimental cerebral malaria
The induction and severity of ECM was assessed using the following well-defined grading system [77] 1: no signs; 2: ruffled fur/and or abnormal posture; 3: lethargy; 4: reduced responsiveness to stimulation and/or ataxia and/or respiratory distress/hyperventilation; 5: prostration and/or paralysis and/or convulsions. Stages 2/3 were classified as prodromal signs of ECM and stages 4/5 were classified as ECM.
Adoptive transfer
Splenic DsRed+/+OT-I CD8+ T cells were purified (>95% purity) from a naïve DsRed+/+OT-I TCR Tg mouse using a Dynal Mouse CD8+ Negative Isolation Kit (Invitrogen). 104 and 106 DsRed+/+OT-I CD8+ T cells were transferred i.v. into C57BL/6 and P14 TCR Tg recipients, respectively, one day prior to infection with 106 Pb-TG-pRBCs, as described above.
Detection of vascular leakage
Vascular leakage was detected as described previously, with some modifications [78]. Briefly, 50 μL 3% Evans blue/PBS (w/v) was injected i.v. into anesthetized mice and allowed to circulate for 5–6 hours. 100–150 μL blood was collected just before perfusion for serum sample. Mice were exsanguinated under KXA anesthesia by intracardial perfusion with 20 mL ice cold PBS. Each brain was removed, weighed, deposited in 500 μL formamide and incubated in darkness at 37°C for 48 hours to extract Evans blue. Formamide was then aspirated and Evans blue absorbance at 610 nm was measured for serum and brain samples with EnVision 2104 Multilabel Reader plate reader (PerkinElmer). Leakage was calculated as Evans blue concentration(brain) multiplied by extraction volume (500 μL), divided by Evans blue concentration(serum), divided by brain mass, divided by hours of circulation, yielding μL serum/g brain/hr.
Intravital 2-photon microscopy
Non-recoverable intravital transcranial imaging was performed utilizing adapted published protocols [79–81]. Infected mice were imaged on days 5, 6 or 7 post infection. For the imaging of mice with ECM, mice were selected only when they scored 3 or above using the grading system described above. Mice imaged on day 5 post infection showed no signs of ECM. The following numbers of mice were imaged to assess the polyclonal T cell response within the subarachnoid and perivascular spaces:—2 mice infected with Pb ANKA on day 5 p.i., before ECM development, 4 mice with ECM (score > 3) on day 7 p.i., 4 mice infected with Pb NK65 on day 7 p.i. and 4 uninfected mice. To visualize blood vessels, mice were injected (i.v.) with either 20 ng Evans blue in PBS or 10 μL Qtracker 705 non-targeted quantum dots (Invitrogen) in PBS prior to imaging. After exposure of the skull by removal of the scalp and periosteum, mice were immobilized in a stereotaxic apparatus. An imaging window (∼3-mm diameter) was created on the right parietal bone 2–3 mm lateral and posterior to bregma by thinning the bone with a micro-drill, under a dissecting microscope.
Two-photon transcranial microscopy was performed with either a LSM-7 MP or LSM-710 system (Zeiss), using a 20x W Plan-Apochromat water immersion objective (NA 1.0, Zeiss). Excitation wavelengths between 910 and 940 nm were generated by a tunable Ti-sapphire femtosecond pulsed laser. Fluorescent emission signals were detected using a combination of non-descanned fluorescence detectors. Emission signals were sequentially separated by dichroic mirrors and bandpass filters arranged in two configurations: 1) 740 and 625 dichroic mirrors (Qtracker 705), 490-nm dichroic mirror with a 485-nm shortpass (SHG), and 593-nm dichroic mirror in combination with 525/25 (GFP) and 585/22 (DsRed) bandpass filters (Semrock). 2) 442/45 (SHG) filter, 465-nm dichroic mirror with 483/35 (CFP/GFP) filter, 505-nm dichroic mirror with 538/36 (GFP/CellEvent) filter, 555-nm dichroic mirror with 610/70 (DsRed) filter and 660-nm dichroic mirror with 710/100 (Evans blue-albumin) filter (Chroma or Semrock). CFP and GFP signals were distinguished by assessing the ratio of 483/35 signal to 538/36 signal. Mice were maintained under anaesthesia throughout surgical and transcranial imaging procedures. Core body temperature was maintained at 37°C, thermostatically controlled by a rectal temperature probe. Perfusion of the cranial window with an isotonic solution was maintained throughout the imaging and provided a meniscus for the dipping lens objective. Preparation and imaging of an individual animal lasted up to 3 hours. Individual movies lasted between 15 and 35 minutes for uninfected and Plasmodium infected mice. For LCMV infected mice, movies lasted up to 1 hour. Imaging sessions started with the generation of a tile scan (1416x1416 μm) of the area in the center of the imaging window. This ‘map’ of the visible area included an average of 8.8±2.1 large vessels (30–100 μm) along with their associated smaller ancillary vessels. Further image acquisition was centered on these larger vessels, in non-overlapping regions of the tile scan. Vessels with T cells visible in the initial tile scan were selected for further image acquisition for motility analyses.
Two-photon image processing and analysis
Two-photon time-lapse sequences acquisition (283x283x30 μm, 2 μm Z step) (Zen software, Zeiss) was performed with low laser power and short pixel dwell time. As a result, significant dark current shot noise was present in some of our images, which had a detrimental impact on our chosen automated tracking software. In order to eliminate this high frequency speckled noise, a multiscale, -undecimated "A Trous" wavelet transform [82] based on a 3x3x3 linear kernel was applied on each volume of interest. Each channel and each time-point were decomposed separately into 7 additive layers plus final residual layer. Noise was mostly contained in the first layer, and cells were best detected in the 4th layer (S12 Fig). By selecting the layers containing only cells, we produced time-lapse sequences which were devoid of noise and therefore suitable for cell tracking. Similarly, the blood vessel stacks were filtered by summing layers 3 to 7 of the wavelet decomposition. Values below 0 were ignored and a volumetric distance map was obtained by successive greyscale dilations and summations of this new image stack using a 3x3x3 structuring element. In the distance map, pixel values are proportional to the distance from the blood vessels and 0 inside the blood vessels. The volumetric distance map was used both to discard any cells inside the blood vessels, and for the remaining cells, to measure their distance from the blood vessels and perform motility analyses (S13 Fig). Imaris (Bitplane) or Volocity (Improvision) software packages were used track cells using a combination of automated and manual processing. Motility analyses were subsequently exported and processed in Excel. Mean speed was calculated as path length/time (μm/min). Mean instantaneous speed was calculated by determining speed of a tracked cell at each consecutive time-point. Arrest coefficient of a cell was defined as the percentage of time points when its instantaneous speed was <2 μm/min. The confinement ratio was calculated as track displacement (distance between start and end point)/track length. Cellular contacts were determined manually in 3D to determine a lack of space between interacting cells at each time point. Analyses were performed for cells with tracks of at least 5 time-points.
Flow cytometry
Brain sequestered leukocytes were isolated from PBS perfused mice as previously described [83]. Isolated brain leukocytes were surface stained with α-mCD8 (53–6.7), CD45 (30-F11), CD3 (17A2), CD11a (M17/4), CD11b (M1/70), CD69 (H1.2F3), CXCR3 (CXCR3-173), KLRG1 (2F1), CD44 (IM7), CD62L (MEL-14), ICOS (15F9), CD40 (3/23), CD80 (16-10A1), MHC I (28-8-6), CD19 (1D3), CD49b (DX5). Intracellular staining for granzyme B (GB11) was performed for 1 hr, after treatment with fix-perm (eBioscience). Dead cells were excluded using forward scatter and side scatter properties and/or LIVE/DEAD Fixable Blue Dead Cell Stain Kit (Life Technologies). Fluoresce minus one controls were used to set gates. Cells were analysed with a BD LSR II (Becton Dickinson) or MACSQuant (Miltenyi) using BD FACSDiva software (Becton Dickinson), and data was analyzed with FlowJo (Tree Star Inc.). All antibodies were from eBioscience and Biolegend
Systemic and intraventricular depletion of macrophages
Macrophages were depleted during infection by the administration of clodronate-liposomes. Systemic depletion was performed from day 5 p.i. by injection (i.p.) of 300 μL clodronate liposomes. Depletion of perivascular macrophages, which are present behind the blood vessel wall and are not depleted by systemic administration of clodronate liposomes [84], was performed on day 5 p.i. by i.c.v. injection of 8 μL clodronate liposomes into the right lateral ventricle, adapted from Galea et al. [50]. Briefly, animals were anesthetized with isoflurane (2%) in O2 (0.2 L/min) and N2O (0.4 L/min) and craniectomy performed. I.c.v. injection was performed using a glass microneedle (co-ordinates from bregma: anterior–posterior -0.22 mm, lateral −1.0 mm, ventral −2 mm. Sub-cutaneous buprenorphine was prophylactically administered at 0.1 mg/kg. The i.c.v. protocol was optimized and the injection placement within the ventricle confirmed by assessing the circulation of trypan blue throughout the perivascular compartments.
Systemic depletion of CX3CR1 cells
CX3CR1+ cells were depleted from Pb ANKA infected mice as follows: CX3CR1-iDTR mice were initially infected with 106 Pb ANKA pRBCs i.v. On day 1 and 2 p.i., infected mice were treated daily with 5 mg tamoxifen dissolved in corn oil via oral gavage. On day 3, 4 and 5 p.i., mice were treated daily with 1 μg diphtheria toxin i.p. to thoroughly deplete DTR-expressing CX3CR1+ cells. CX3CR1+ cell depletion was confirmed by brain histology of CX3CR1-expressing microglia (Fig 7C). Mice were monitored daily for ECM symptoms and survival, as described.
Histology
For detection of GFP+ parasites, CD31 (MEC 13.3, BD Pharmingen), activated caspase 3 (Asp175, Cell Signalling), CD8 (YTS105.18, AbD Serotec) and Lectin (biotinylated Lycopersicon esculentum, Sigma) in 30 μm thick free floating brain sections: mice were sacrificed by exposure to a rising concentration of CO2. Spleens were removed before sequential transcardial perfusion with PBS and 4% PFA. Brains were removed and sequentially incubated at 4°C overnight in 20% sucrose/4% PFA and 20% sucrose/PBS. Brains were snap frozen with dry ice and sectioned on a freezing sledge microtome (Bright Instruments, Cambridge, UK) at a thickness of 30μm. Brain sections were stored in cyroprotectant solution (30% ethylene glycol, 20% glycerol in PBS) at -20° C until used. Free-floating sections were washed in PBS and then blocked in 10% goat serum (Sigma Aldrich, UK) in primary diluent (PBS and 0.3% Triton X-100) for 1.5 hrs. Combinations of primary antibodies in primary diluent were applied for 12–48 hrs at 4°C. Combinations of secondary antibodies in primary diluent (goat anti-rabbit 488 and 546, Life Technologies, goat anti-rat 647, Life Technologies and Streptavidin conjugated 546, Life Technologies) were applied for 1.5 hrs at RT. Cell nuclei were counterstained with DAPI (Life Technologies, UK). Sections were mounted onto gelatine coated slides and coverslipped in Prolong Diamond anti-fade mountant (Life Technologies, UK). Images were collected on an Olympus BX51 upright microscope using 20x/ 0.50 and 40x/ 0.75 Plan Fln objective and captured using a Coolsnap ES camera (Photometrics) through MetaVue Software (Molecular Devices). Images were processed using ImageJ (http://rsb.info.nih.gov/ij). Quantitation of parasite load, vasculature and apoptosis was performed in a semi-automated fashion using Image-Pro Premier (MediaCybernetics). ImagePro’s smart segmentation technology was utilized to ascribe areas of interest (i.e parasite/apoptotic cell/vessel) and background from an image. The software then automatically determined all regions of interest from the total image; providing data regarding number of regions of interest and total area these regions occupied in the image. These settings were globally applied to all samples ensuring a non-biased analysis of all samples.
For detection of CD31 and Iba1 in fresh frozen sections: mice were exsanguinated under KXA anesthesia by intracardial perfusion with 20 mL ice cold PBS supplemented with 10 U/mL heparin. For immunohistofluorescent staining, brains were embedded in Optimum Cutting Temperature compound (O.C.T., Tissue-Tek) and frozen in a dry ice/isopropanol bath. 6–8 μm thick coronal sections were cut with a Leica CM3050 S cryotome sectioning system and mounted onto SuperFrost slides. Mounted sections were fixed in acetone at -20°C for 5 min, allowed to air dry for at least 5 hours, followed by rehydration, in TBS (20 mM Tris, 150 mM NaCl, pH 7.5) with orbital shaking for 10 min at RT. Sections were permeablized by soaking in TBST (0.05% Tween-20/TBS) with orbital shaking for 15 min at RT, then blocked by addition of 5% BSA, 10% mouse serum, TBS for 30 min at RT. Following washing in TBST sections were stained in the dark for 1 hour at RT with rat α-CD31-AlexaFluor647 (MEC13.3, Invitrogen) or rabbit α-Iba1 (Wako) antibodies diluted in TBST, and washed with TBST. The Iba1-stained tissue was further probed with goat α-rabbit-AlexaFluor647. After washing probes away, cryosections were mounted with glycerol under coverglass, and sealed with nail polish. For unstained histology, each brain was removed and fixed in 4% PFA/PBS (w/v) at 4°C overnight. Brains were washed with PBS 3 times for 5 min each. 500-μm thick coronal sections were cut with a Pelco100 vibratome sectioning system (Ted Pella Inc.) and mounted onto Superfrost slides with glycerol and sealed with nail polish. Samples were imaged with a 25x LD LCI Plan-Apochromat objective (NA 0.8, Zeiss) and analysed using Photoshop CS5 (Adobe).
Ex vivo apoptosis detection
10 μL 2 mM CellEvent Caspase-3/7 Green Detection Reagent (Invitrogen) was injected i.v. into anesthetized mice and allowed to circulate for 30–60 minutes. Z stacks were captured by two-photon microscopy spanning a surface area of 4–5 mm2 and a depth of ∼150 μm. CellEvent-positive cells were counted and their number divided by the volume of brain tissue imaged.
Statistical analysis
All statistical analyses were performed using GraphPad PRISM (GraphPad Software, USA). Comparison between two groups was made using unpaired t tests, with Welch’s correction where needed. Comparison between multiple groups was made using a one-way ANOVA with Tukey’s test for multiple comparisons. Differences in survival were analysed using the Mantel-Cox log-rank test.
Supporting Information
Zdroje
1. Murray CJ, Rosenfeld LC, Lim SS, Andrews KG, Foreman KJ, Haring D, et al. Global malaria mortality between 1980 and 2010: a systematic analysis. Lancet. 2012;379(9814):413–31. Epub 2012/02/07. doi: 10.1016/s0140-6736(12)60034-8 22305225.
2. World Health Organization. World Malaria Report 2014. Geneva, Switzerland: 2014.
3. Oluwayemi OI, Brown BJ, Oyedeji OA, Adegoke SA, Adebami OJ, Oyedeji GA. Clinical and laboratory predictors of outcome in cerebral malaria in suburban Nigeria. J Infect Dev Ctries. 2013;7(8):600–7. Epub 2013/08/21. doi: 10.3855/jidc.2769 23949295.
4. Dondorp A, Fanello C, Hendriksen I, Gomes E. Artesunate versus quinine in the treatment of severe falciparum malaria in African children (AQUAMAT): an open-label, randomised trial. The Lancet. 2010.
5. Dondorp A, Nosten F, Stepniewska K, Day N, White N. Artesunate versus quinine for treatment of severe falciparum malaria: a randomised trial. Lancet. 366. England2005. p. 717–25. 16125588
6. Amante FH, Haque A, Stanley AC, Rivera Fde L, Randall LM, Wilson YA, et al. Immune-mediated mechanisms of parasite tissue sequestration during experimental cerebral malaria. J Immunol. 2010;185(6):3632–42. Epub 2010/08/20. doi: 10.4049/jimmunol.1000944 20720206.
7. Hearn J, Rayment N, Landon DN, Katz DR, de Souza JB. Immunopathology of cerebral malaria: morphological evidence of parasite sequestration in murine brain microvasculature. Infect Immun. 2000;68(9):5364–76. Epub 2000/08/19. 10948166; PubMed Central PMCID: PMCPmc101800.
8. Lou J, Lucas R, Grau GE. Pathogenesis of cerebral malaria: recent experimental data and possible applications for humans. Clin Microbiol Rev. 2001;14(4):810–20, table of contents. Epub 2001/10/05. doi: 10.1128/cmr.14.4.810–820.2001 11585786; PubMed Central PMCID: PMCPmc89004.
9. Randall LM, Amante FH, McSweeney KA, Zhou Y, Stanley AC, Haque A, et al. Common strategies to prevent and modulate experimental cerebral malaria in mouse strains with different susceptibilities. Infect Immun. 2008;76(7):3312–20. Epub 2008/05/14. doi: 10.1128/iai.01475-07 18474652; PubMed Central PMCID: PMCPmc2446712.
10. Yanez DM, Manning DD, Cooley AJ, Weidanz WP, van der Heyde HC. Participation of lymphocyte subpopulations in the pathogenesis of experimental murine cerebral malaria. J Immunol. 1996;157(4):1620–4. Epub 1996/08/15. 8759747.
11. Haque A, Best SE, Unosson K, Amante FH, de Labastida F, Anstey NM, et al. Granzyme B expression by CD8+ T cells is required for the development of experimental cerebral malaria. J Immunol. 2011;186(11):6148–56. Epub 2011/04/29. doi: 10.4049/jimmunol.1003955 21525386.
12. Renia L, Potter SM, Mauduit M, Rosa DS, Kayibanda M, Deschemin JC, et al. Pathogenic T cells in cerebral malaria. Int J Parasitol. 2006;36(5):547–54. Epub 2006/04/08. doi: 10.1016/j.ijpara.2006.02.007 16600241.
13. Nacer A, Movila A, Baer K, Mikolajczak SA, Kappe SH, Frevert U. Neuroimmunological blood brain barrier opening in experimental cerebral malaria. PLoS Pathog. 2012;8(10):e1002982. Epub 2012/11/08. doi: 10.1371/journal.ppat.1002982 23133375; PubMed Central PMCID: PMCPmc3486917.
14. Amani V, Vigario AM, Belnoue E, Marussig M, Fonseca L, Mazier D, et al. Involvement of IFN-gamma receptor-medicated signaling in pathology and anti-malarial immunity induced by Plasmodium berghei infection. Eur J Immunol. 2000;30(6):1646–55. Epub 2000/07/18. doi: 10.1002/1521-4141(200006)30 : 6<1646::aid-immu1646>3.0.co;2–0 10898501.
15. Ramiro RS, Reece SE, Obbard DJ. Molecular evolution and phylogenetics of rodent malaria parasites. BMC Evol Biol. 2012;12 : 219. Epub 2012/11/16. doi: 10.1186/1471-2148-12-219 23151308; PubMed Central PMCID: PMCPmc3538709.
16. Otto TD, Bohme U, Jackson AP, Hunt M, Franke-Fayard B, Hoeijmakers WA, et al. A comprehensive evaluation of rodent malaria parasite genomes and gene expression. BMC Biol. 2014;12(1):86. Epub 2014/11/02. doi: 10.1186/preaccept-1233682211145405 25359557; PubMed Central PMCID: PMCPmc4242472.
17. Belnoue E, Kayibanda M, Vigario AM, Deschemin JC, van Rooijen N, Viguier M, et al. On the pathogenic role of brain-sequestered alphabeta CD8+ T cells in experimental cerebral malaria. J Immunol. 2002;169(11):6369–75. Epub 2002/11/22. 12444144.
18. Hansen DS, Bernard NJ, Nie CQ, Schofield L. NK cells stimulate recruitment of CXCR3+ T cells to the brain during Plasmodium berghei-mediated cerebral malaria. J Immunol. 2007;178(9):5779–88. Epub 2007/04/20. 17442962.
19. Pai S, Qin J, Cavanagh L, Mitchell A, El-Assaad F, Jain R, et al. Real-time imaging reveals the dynamics of leukocyte behaviour during experimental cerebral malaria pathogenesis. PLoS Pathog. 2014;10(7):e1004236. Epub 2014/07/18. doi: 10.1371/journal.ppat.1004236 25033406; PubMed Central PMCID: PMCPmc4102563.
20. Nacer A, Movila A, Sohet F, Girgis NM, Gundra UM, Loke P, et al. Experimental cerebral malaria pathogenesis-hemodynamics at the blood brain barrier. PLoS Pathog. 2014;10(12):e1004528. Epub 2014/12/05. doi: 10.1371/journal.ppat.1004528 25474413; PubMed Central PMCID: PMCPmc4256476.
21. Belnoue E, Costa FT, Vigario AM, Voza T, Gonnet F, Landau I, et al. Chemokine receptor CCR2 is not essential for the development of experimental cerebral malaria. Infect Immun. 2003;71(6):3648–51. Epub 2003/05/23. 12761155; PubMed Central PMCID: PMCPmc155705.
22. Lundie RJ, de Koning-Ward TF, Davey GM, Nie CQ, Hansen DS, Lau LS, et al. Blood-stage Plasmodium infection induces CD8+ T lymphocytes to parasite-expressed antigens, largely regulated by CD8alpha+ dendritic cells. Proc Natl Acad Sci U S A. 2008;105(38):14509–14. Epub 2008/09/19. doi: 10.1073/pnas.0806727105 18799734; PubMed Central PMCID: PMCPmc2567226.
23. Nie CQ, Bernard NJ, Norman MU, Amante FH, Lundie RJ, Crabb BS, et al. IP-10-mediated T cell homing promotes cerebral inflammation over splenic immunity to malaria infection. PLoS Pathog. 2009;5(4):e1000369. Epub 2009/04/04. doi: 10.1371/journal.ppat.1000369 19343215; PubMed Central PMCID: PMCPmc2658824.
24. Potter S, Chan-Ling T, Ball HJ, Mansour H, Mitchell A, Maluish L, et al. Perforin mediated apoptosis of cerebral microvascular endothelial cells during experimental cerebral malaria. Int J Parasitol. 2006;36(4):485–96. Epub 2006/02/28. doi: 10.1016/j.ijpara.2005.12.005 16500656.
25. Nitcheu J, Bonduelle O, Combadiere C. Perforin-dependent brain-infiltrating cytotoxic CD8+ T lymphocytes mediate experimental cerebral malaria pathogenesis. The Journal of …. 2003.
26. Howland SW, Poh CM, Gun SY, Claser C, Malleret B, Shastri N, et al. Brain microvessel cross-presentation is a hallmark of experimental cerebral malaria. EMBO Mol Med. 2013;5(7):916–31. Epub 2013/05/18. doi: 10.1002/emmm.201202273 23681698; PubMed Central PMCID: PMCPmc3721469.
27. Kivisakk P, Imitola J, Rasmussen S, Elyaman W, Zhu B, Ransohoff RM, et al. Localizing central nervous system immune surveillance: meningeal antigen-presenting cells activate T cells during experimental autoimmune encephalomyelitis. Ann Neurol. 2009;65(4):457–69. Epub 2008/05/23. doi: 10.1002/ana.21379 18496841; PubMed Central PMCID: PMCPmc3305810.
28. Greter M, Heppner FL, Lemos MP, Odermatt BM, Goebels N, Laufer T, et al. Dendritic cells permit immune invasion of the CNS in an animal model of multiple sclerosis. Nat Med. 2005;11(3):328–34. Epub 2005/03/01. doi: 10.1038/nm1197 15735653.
29. Polfliet MM, van de Veerdonk F, Dopp EA, van Kesteren-Hendrikx EM, van Rooijen N, Dijkstra CD, et al. The role of perivascular and meningeal macrophages in experimental allergic encephalomyelitis. J Neuroimmunol. 2002;122(1–2):1–8. Epub 2002/01/05. 11777538.
30. Bartholomaus I, Kawakami N, Odoardi F, Schlager C, Miljkovic D, Ellwart JW, et al. Effector T cell interactions with meningeal vascular structures in nascent autoimmune CNS lesions. Nature. 2009;462(7269):94–8. Epub 2009/10/16. doi: 10.1038/nature08478 19829296.
31. Kawakami N, Flugel A. Knocking at the brain's door: intravital two-photon imaging of autoreactive T cell interactions with CNS structures. Semin Immunopathol. 2010;32(3):275–87. Epub 2010/07/14. doi: 10.1007/s00281-010-0216-x 20623286; PubMed Central PMCID: PMCPmc2937150.
32. Mempel TR, Pittet MJ, Khazaie K, Weninger W, Weissleder R, von Boehmer H, et al. Regulatory T cells reversibly suppress cytotoxic T cell function independent of effector differentiation. Immunity. 2006;25(1):129–41. Epub 2006/07/25. doi: 10.1016/j.immuni.2006.04.015 16860762.
33. Boissonnas A, Fetler L, Zeelenberg IS, Hugues S, Amigorena S. In vivo imaging of cytotoxic T cell infiltration and elimination of a solid tumor. J Exp Med. 2007;204(2):345–56. Epub 2007/01/31. doi: 10.1084/jem.20061890 17261634; PubMed Central PMCID: PMCPmc2118741.
34. Beal AM, Anikeeva N, Varma R, Cameron TO, Norris PJ, Dustin ML, et al. Protein kinase C theta regulates stability of the peripheral adhesion ring junction and contributes to the sensitivity of target cell lysis by CTL. J Immunol. 2008;181(7):4815–24. Epub 2008/09/20. 18802085; PubMed Central PMCID: PMCPmc2748977.
35. Taylor TE, Fu WJ, Carr RA, Whitten RO, Mueller JS, Fosiko NG, et al. Differentiating the pathologies of cerebral malaria by postmortem parasite counts. Nat Med. 2004;10(2):143–5. Epub 2004/01/28. doi: 10.1038/nm986 14745442.
36. Ho M, Hickey MJ, Murray AG, Andonegui G, Kubes P. Visualization of Plasmodium falciparum-endothelium interactions in human microvasculature: mimicry of leukocyte recruitment. J Exp Med. 2000;192(8):1205–11. Epub 2000/10/18. 11034611; PubMed Central PMCID: PMCPmc2195873.
37. Baptista F, Pamplona A, Pena A, Mota M, Pied S, Vigário A. Accumulation of Plasmodium berghei-infected red blood cells in the brain is crucial for the development of cerebral malaria in mice. Infection and immunity. 2010;78(9):4033–9. doi: 10.1128/IAI.00079-10 20605973
38. Lau LS, Fernandez Ruiz D, Davey GM, de Koning-Ward TF, Papenfuss AT, Carbone FR, et al. Blood-stage Plasmodium berghei infection generates a potent, specific CD8+ T-cell response despite residence largely in cells lacking MHC I processing machinery. J Infect Dis. 2011;204(12):1989–96. Epub 2011/10/15. doi: 10.1093/infdis/jir656 21998471.
39. Rai D, Pham NL, Harty JT, Badovinac VP. Tracking the total CD8 T cell response to infection reveals substantial discordance in magnitude and kinetics between inbred and outbred hosts. J Immunol. 2009;183(12):7672–81. Epub 2009/11/26. doi: 10.4049/jimmunol.0902874 19933864; PubMed Central PMCID: PMCPmc2808048.
40. Steinert EM, Schenkel JM, Fraser KA, Beura LK, Manlove LS, Igyarto BZ, et al. Quantifying Memory CD8 T Cells Reveals Regionalization of Immunosurveillance. Cell. 2015;161(4):737–49. Epub 2015/05/11. doi: 10.1016/j.cell.2015.03.031 25957682; PubMed Central PMCID: PMCPmc4426972.
41. Harris TH, Banigan EJ, Christian DA, Konradt C, Tait Wojno ED, Norose K, et al. Generalized Levy walks and the role of chemokines in migration of effector CD8+ T cells. Nature. 2012;486(7404):545–8. Epub 2012/06/23. doi: 10.1038/nature11098 22722867; PubMed Central PMCID: PMCPmc3387349.
42. Honda T, Egen JG, Lammermann T, Kastenmuller W, Torabi-Parizi P, Germain RN. Tuning of antigen sensitivity by T cell receptor-dependent negative feedback controls T cell effector function in inflamed tissues. Immunity. 2014;40(2):235–47. Epub 2014/01/21. doi: 10.1016/j.immuni.2013.11.017 24440150.
43. Owens T, Bechmann I, Engelhardt B. Perivascular spaces and the two steps to neuroinflammation. J Neuropathol Exp Neurol. 2008;67(12):1113–21. Epub 2008/11/20. doi: 10.1097/NEN.0b013e31818f9ca8 19018243.
44. Bechmann I, Galea I, Perry VH. What is the blood-brain barrier (not)? Trends Immunol. 2007;28(1):5–11. Epub 2006/12/05. doi: 10.1016/j.it.2006.11.007 17140851.
45. Jung S, Aliberti J, Graemmel P, Sunshine MJ, Kreutzberg GW, Sher A, et al. Analysis of fractalkine receptor CX(3)CR1 function by targeted deletion and green fluorescent protein reporter gene insertion. Mol Cell Biol. 2000;20(11):4106–14. Epub 2000/05/11. 10805752; PubMed Central PMCID: PMCPmc85780.
46. Pais TF, Chatterjee S. Brain macrophage activation in murine cerebral malaria precedes accumulation of leukocytes and CD8+ T cell proliferation. J Neuroimmunol. 2005;163(1–2):73–83. Epub 2005/05/12. doi: 10.1016/j.jneuroim.2005.02.009 15885309.
47. Mutnal MB, Hu S, Little MR, Lokensgard JR. Memory T cells persisting in the brain following MCMV infection induce long-term microglial activation via interferon-gamma. J Neurovirol. 2011;17(5):424–37. Epub 2011/07/30. doi: 10.1007/s13365-011-0042-5 21800103; PubMed Central PMCID: PMCPmc3204167.
48. Schumak B, Klocke K, Kuepper JM, Biswas A, Djie-Maletz A, Limmer A, et al. Specific depletion of Ly6C(hi) inflammatory monocytes prevents immunopathology in experimental cerebral malaria. PLoS One. 2015;10(4):e0124080. Epub 2015/04/18. doi: 10.1371/journal.pone.0124080 25884830; PubMed Central PMCID: PMCPmc4401438.
49. Claser C, Malleret B, Gun SY, Wong AY, Chang ZW, Teo P, et al. CD8+ T cells and IFN-gamma mediate the time-dependent accumulation of infected red blood cells in deep organs during experimental cerebral malaria. PLoS One. 2011;6(4):e18720. Epub 2011/04/16. doi: 10.1371/journal.pone.0018720 21494565; PubMed Central PMCID: PMCPmc3073989.
50. Galea I, Palin K, Newman TA, Van Rooijen N, Perry VH, Boche D. Mannose receptor expression specifically reveals perivascular macrophages in normal, injured, and diseased mouse brain. Glia. 2005;49(3):375–84. Epub 2004/11/13. doi: 10.1002/glia.20124 15538754.
51. Parkhurst CN, Yang G, Ninan I, Savas JN, Yates JR 3rd, Lafaille JJ, et al. Microglia promote learning-dependent synapse formation through brain-derived neurotrophic factor. Cell. 2013;155(7):1596–609. Epub 2013/12/24. doi: 10.1016/j.cell.2013.11.030 24360280; PubMed Central PMCID: PMCPmc4033691.
52. Brandle D, Burki K, Wallace VA, Rohrer UH, Mak TW, Malissen B, et al. Involvement of both T cell receptor V alpha and V beta variable region domains and alpha chain junctional region in viral antigen recognition. Eur J Immunol. 1991;21(9):2195–202. Epub 1991/09/01. doi: 10.1002/eji.1830210930 1716213.
53. Howland SW, Claser C, Poh CM, Gun SY, Rénia L. Pathogenic CD8(+) T cells in experimental cerebral malaria. Seminars in immunopathology. 2015. doi: 10.1007/s00281-015-0476-6 25772948
54. Lackner P, Beer R, Helbok R, Broessner G, Engelhardt K, Brenneis C, et al. Scanning electron microscopy of the neuropathology of murine cerebral malaria. Malar J. 2006;5 : 116. Epub 2006/11/28. doi: 10.1186/1475-2875-5-116 17125519; PubMed Central PMCID: PMCPmc1676017.
55. Ampawong S, Chaisri U, Viriyavejakul P, Nontprasert A, Grau GE, Pongponratn E. Electron microscopic features of brain edema in rodent cerebral malaria in relation to glial fibrillary acidic protein expression. Int J Clin Exp Pathol. 2014;7(5):2056–67. Epub 2014/06/27. 24966914; PubMed Central PMCID: PMCPmc4069908.
56. Gimenez MA, Sim JE, Russell JH. TNFR1-dependent VCAM-1 expression by astrocytes exposes the CNS to destructive inflammation. J Neuroimmunol. 2004;151(1–2):116–25. Epub 2004/05/18. doi: 10.1016/j.jneuroim.2004.02.012 15145610.
57. Szklarczyk A, Stins M, Milward EA, Ryu H, Fitzsimmons C, Sullivan D, et al. Glial activation and matrix metalloproteinase release in cerebral malaria. J Neurovirol. 2007;13(1):2–10. Epub 2007/04/25. doi: 10.1080/13550280701258084 17454443.
58. Medana IM, Chaudhri G, Chan-Ling T, Hunt NH. Central nervous system in cerebral malaria: 'Innocent bystander' or active participant in the induction of immunopathology? Immunol Cell Biol. 2001;79(2):101–20. Epub 2001/03/27. doi: 10.1046/j.1440-1711.2001.00995.x 11264703.
59. DellaValle B, Hempel C, Kurtzhals JA, Penkowa M. In vivo expression of neuroglobin in reactive astrocytes during neuropathology in murine models of traumatic brain injury, cerebral malaria, and autoimmune encephalitis. Glia. 2010;58(10):1220–7. Epub 2010/06/15. doi: 10.1002/glia.21002 20544857.
60. Lau LS, Fernandez-Ruiz D, Mollard V, Sturm A, Neller MA, Cozijnsen A, et al. CD8+ T cells from a novel T cell receptor transgenic mouse induce liver-stage immunity that can be boosted by blood-stage infection in rodent malaria. PLoS Pathog. 2014;10(5):e1004135. Epub 2014/05/24. doi: 10.1371/journal.ppat.1004135 24854165; PubMed Central PMCID: PMCPmc4031232.
61. Poh CM, Howland SW, Grotenbreg GM, Rénia L. Damage to the blood-brain barrier during experimental cerebral malaria results from synergistic effects of CD8+ T cells with different specificities. Infection and immunity. 2014;82(11):4854–64. doi: 10.1128/IAI.02180-14 25156726
62. Breart B, Lemaitre F, Celli S, Bousso P. Two-photon imaging of intratumoral CD8+ T cell cytotoxic activity during adoptive T cell therapy in mice. J Clin Invest. 2008;118(4):1390–7. Epub 2008/03/22. doi: 10.1172/jci34388 18357341; PubMed Central PMCID: PMCPmc2268880.
63. Coppieters K, Amirian N, von Herrath M. Intravital imaging of CTLs killing islet cells in diabetic mice. J Clin Invest. 2012;122(1):119–31. Epub 2011/12/03. doi: 10.1172/jci59285 22133877; PubMed Central PMCID: PMCPmc3248300.
64. Suidan GL, McDole JR, Chen Y, Pirko I, Johnson AJ. Induction of blood brain barrier tight junction protein alterations by CD8 T cells. PLoS One. 2008;3(8):e3037. Epub 2008/08/30. doi: 10.1371/journal.pone.0003037 18725947; PubMed Central PMCID: PMCPmc2516328.
65. Hempel C, Hoyer N, Kildemoes A, Jendresen CB, Kurtzhals JA. Systemic and Cerebral Vascular Endothelial Growth Factor Levels Increase in Murine Cerebral Malaria along with Increased Calpain and Caspase Activity and Can be Reduced by Erythropoietin Treatment. Front Immunol. 2014;5 : 291. Epub 2014/07/06. doi: 10.3389/fimmu.2014.00291 24995009; PubMed Central PMCID: PMCPmc4062992.
66. Canavese M, Spaccapelo R. Protective or pathogenic effects of vascular endothelial growth factor (VEGF) as potential biomarker in cerebral malaria. Pathog Glob Health. 2014;108(2):67–75. Epub 2014/03/08. doi: 10.1179/2047773214y.0000000130 24601908; PubMed Central PMCID: PMCPmc4005586.
67. Furuta T, Kimura M, Watanabe N. Elevated levels of vascular endothelial growth factor (VEGF) and soluble vascular endothelial growth factor receptor (VEGFR)-2 in human malaria. Am J Trop Med Hyg. 2010;82(1):136–9. Epub 2010/01/13. doi: 10.4269/ajtmh.2010.09–0203 20065009; PubMed Central PMCID: PMCPmc2803523.
68. Spyridopoulos I, Brogi E, Kearney M, Sullivan AB, Cetrulo C, Isner JM, et al. Vascular endothelial growth factor inhibits endothelial cell apoptosis induced by tumor necrosis factor-alpha: balance between growth and death signals. J Mol Cell Cardiol. 1997;29(5):1321–30. Epub 1997/05/01. doi: 10.1006/jmcc.1996.0365 9201618.
69. Munshi N, Fernandis AZ, Cherla RP, Park IW, Ganju RK. Lipopolysaccharide-induced apoptosis of endothelial cells and its inhibition by vascular endothelial growth factor. J Immunol. 2002;168(11):5860–6. Epub 2002/05/23. 12023390.
70. Jin K, Mao XO, Batteur SP, McEachron E, Leahy A, Greenberg DA. Caspase-3 and the regulation of hypoxic neuronal death by vascular endothelial growth factor. Neuroscience. 2001;108(2):351–8. Epub 2001/12/06. 11734367.
71. Hogquist KA, Jameson SC, Heath WR, Howard JL, Bevan MJ, Carbone FR. T cell receptor antagonist peptides induce positive selection. Cell. 1994;76(1):17–27. Epub 1994/01/14. 8287475.
72. Hadjantonakis AK, Macmaster S, Nagy A. Embryonic stem cells and mice expressing different GFP variants for multiple non-invasive reporter usage within a single animal. BMC Biotechnol. 2002;2 : 11. Epub 2002/06/25. 12079497; PubMed Central PMCID: PMCPmc116589.
73. Vintersten K, Monetti C, Gertsenstein M, Zhang P, Laszlo L, Biechele S, et al. Mouse in red: red fluorescent protein expression in mouse ES cells, embryos, and adult animals. Genesis. 2004;40(4):241–6. Epub 2004/12/14. doi: 10.1002/gene.20095 15593332.
74. Kirby AC, Coles MC, Kaye PM. Alveolar macrophages transport pathogens to lung draining lymph nodes. J Immunol. 2009;183(3):1983–9. Epub 2009/07/22. doi: 10.4049/jimmunol.0901089 19620319; PubMed Central PMCID: PMCPmc3609601.
75. Franke-Fayard B, Trueman H, Ramesar J, Mendoza J, van der Keur M, van der Linden R, et al. A Plasmodium berghei reference line that constitutively expresses GFP at a high level throughout the complete life cycle. Mol Biochem Parasitol. 2004;137(1):23–33. Epub 2004/07/29. doi: 10.1016/j.molbiopara.2004.04.007 15279948.
76. Natarajan R, Thathy V, Mota MM, Hafalla JC, Menard R, Vernick KD. Fluorescent Plasmodium berghei sporozoites and pre-erythrocytic stages: a new tool to study mosquito and mammalian host interactions with malaria parasites. Cell Microbiol. 2001;3(6):371–9. Epub 2001/06/26. 11422080.
77. Villegas-Mendez A, Greig R, Shaw TN, de Souza JB, Gwyer Findlay E, Stumhofer JS, et al. IFN-gamma-producing CD4+ T cells promote experimental cerebral malaria by modulating CD8+ T cell accumulation within the brain. J Immunol. 2012;189(2):968–79. Epub 2012/06/23. doi: 10.4049/jimmunol.1200688 22723523; PubMed Central PMCID: PMCPmc3393641.
78. Steinwall O, Klatzo I. Selective vulnerability of the blood-brain barrier in chemically induced lesions. J Neuropathol Exp Neurol. 1966;25(4):542–59. Epub 1966/10/01. 4162603.
79. Fumagalli S, Coles JA, Ejlerskov P, Ortolano F, Bushell TJ, Brewer JM, et al. In vivo real-time multiphoton imaging of T lymphocytes in the mouse brain after experimental stroke. Stroke. 2011;42(5):1429–36. Epub 2011/03/29. doi: 10.1161/strokeaha.110.603704 21441145.
80. Myburgh E, Coles JA, Ritchie R, Kennedy PG, McLatchie AP, Rodgers J, et al. In vivo imaging of trypanosome-brain interactions and development of a rapid screening test for drugs against CNS stage trypanosomiasis. PLoS Negl Trop Dis. 2013;7(8):e2384. Epub 2013/08/31. doi: 10.1371/journal.pntd.0002384 23991236; PubMed Central PMCID: PMCPmc3749981.
81. Yang G, Pan F, Parkhurst CN, Grutzendler J, Gan WB. Thinned-skull cranial window technique for long-term imaging of the cortex in live mice. Nat Protoc. 2010;5(2):201–8. Epub 2010/02/06. doi: 10.1038/nprot.2009.222 20134419.
82. Holschneider M, Kronland-Martinet R, Morlet J, Tchamitchian P. A Real-Time Algorithm for Signal Analysis with the Help of the Wavelet Transform. In: Combes J-M, Grossmann A, Tchamitchian P, editors. Wavelets. inverse problems and theoretical imaging: Springer Berlin Heidelberg; 1990. p. 286–97.
83. Villegas-Mendez A, de Souza JB, Murungi L, Hafalla JC, Shaw TN, Greig R, et al. Heterogeneous and tissue-specific regulation of effector T cell responses by IFN-gamma during Plasmodium berghei ANKA infection. J Immunol. 2011;187(6):2885–97. Epub 2011/09/02. doi: 10.4049/jimmunol.1100241 21880980; PubMed Central PMCID: PMCPmc3173971.
84. Getts DR, Terry RL, Getts MT, Muller M, Rana S, Shrestha B, et al. Ly6c+ "inflammatory monocytes" are microglial precursors recruited in a pathogenic manner in West Nile virus encephalitis. J Exp Med. 2008;205(10):2319–37. Epub 2008/09/10. doi: 10.1084/jem.20080421 18779347; PubMed Central PMCID: PMCPmc2556789.
85. Weiser S, Miu J, Ball HJ, Hunt NH. Interferon-gamma synergises with tumour necrosis factor and lymphotoxin-alpha to enhance the mRNA and protein expression of adhesion molecules in mouse brain endothelial cells. Cytokine. 37. United States2007. p. 84–91. 17412608
86. Monso-Hinard C, Lou JN, Behr C, Juillard P, Grau GE. Expression of major histocompatibility complex antigens on mouse brain microvascular endothelial cells in relation to susceptibility to cerebral malaria. Immunology. 1997;92(1):53–9. Epub 1997/11/26. 9370924; PubMed Central PMCID: PMCPMC1363981.
87. Turner GD, Morrison H, Jones M, Davis TM, Looareesuwan S, Buley ID, et al. An immunohistochemical study of the pathology of fatal malaria. Evidence for widespread endothelial activation and a potential role for intercellular adhesion molecule-1 in cerebral sequestration. Am J Pathol. 1994;145(5):1057–69. Epub 1994/11/01. 7526692; PubMed Central PMCID: PMCPMC1887431.
Štítky
Hygiena a epidemiologie Infekční lékařství LaboratořČlánek vyšel v časopise
PLOS Pathogens
2015 Číslo 11
- Parazitičtí červi v terapii Crohnovy choroby a dalších zánětlivých autoimunitních onemocnění
- Vakcíny proti klíšťové encefalitidě
- Kdy je nejlepší očkovat
- Možné vedlejší účinky očkování
- Imunogenita vakcín
Nejčtenější v tomto čísle
- Dengue Virus Non-structural Protein 1 Modulates Infectious Particle Production via Interaction with the Structural Proteins
- On the Discovery of TOR As the Target of Rapamycin
- Parasite Glycobiology: A Bittersweet Symphony
- Broadening of Virus-Specific CD8 T-Cell Responses Is Indicative of Residual Viral Replication in Aviremic SIV Controllers
Zvyšte si kvalifikaci online z pohodlí domova
Mazová zátka a její řešení
nový kurzVšechny kurzy