
Sequential Bottlenecks Drive Viral Evolution in Early Acute Hepatitis C Virus Infection
Hepatitis C is a pandemic human RNA virus, which commonly causes chronic infection and liver disease. The characterization of viral populations that successfully initiate infection, and also those that drive progression to chronicity is instrumental for understanding pathogenesis and vaccine design. A comprehensive and longitudinal analysis of the viral population was conducted in four subjects followed from very early acute infection to resolution of disease outcome. By means of next generation sequencing (NGS) and standard cloning/Sanger sequencing, genetic diversity and viral variants were quantified over the course of the infection at frequencies as low as 0.1%. Phylogenetic analysis of reassembled viral variants revealed acute infection was dominated by two sequential bottleneck events, irrespective of subsequent chronicity or clearance. The first bottleneck was associated with transmission, with one to two viral variants successfully establishing infection. The second occurred approximately 100 days post-infection, and was characterized by a decline in viral diversity. In the two subjects who developed chronic infection, this second bottleneck was followed by the emergence of a new viral population, which evolved from the founder variants via a selective sweep with fixation in a small number of mutated sites. The diversity at sites with non-synonymous mutation was higher in predicted cytotoxic T cell epitopes, suggesting immune-driven evolution. These results provide the first detailed analysis of early within-host evolution of HCV, indicating strong selective forces limit viral evolution in the acute phase of infection.
Published in the journal:
. PLoS Pathog 7(9): e32767. doi:10.1371/journal.ppat.1002243
Category:
Research Article
doi:
https://doi.org/10.1371/journal.ppat.1002243
Summary
Hepatitis C is a pandemic human RNA virus, which commonly causes chronic infection and liver disease. The characterization of viral populations that successfully initiate infection, and also those that drive progression to chronicity is instrumental for understanding pathogenesis and vaccine design. A comprehensive and longitudinal analysis of the viral population was conducted in four subjects followed from very early acute infection to resolution of disease outcome. By means of next generation sequencing (NGS) and standard cloning/Sanger sequencing, genetic diversity and viral variants were quantified over the course of the infection at frequencies as low as 0.1%. Phylogenetic analysis of reassembled viral variants revealed acute infection was dominated by two sequential bottleneck events, irrespective of subsequent chronicity or clearance. The first bottleneck was associated with transmission, with one to two viral variants successfully establishing infection. The second occurred approximately 100 days post-infection, and was characterized by a decline in viral diversity. In the two subjects who developed chronic infection, this second bottleneck was followed by the emergence of a new viral population, which evolved from the founder variants via a selective sweep with fixation in a small number of mutated sites. The diversity at sites with non-synonymous mutation was higher in predicted cytotoxic T cell epitopes, suggesting immune-driven evolution. These results provide the first detailed analysis of early within-host evolution of HCV, indicating strong selective forces limit viral evolution in the acute phase of infection.
Introduction
Hepatitis C virus (HCV) infection is a major cause of chronic liver disease, resulting in substantial morbidity and mortality worldwide, with between 123 and 170 million persons infected [1]. Transmission is predominantly via blood-to-blood contact associated with contaminated injection devices. Infection persists in approximately 70% of acute cases, leading to chronic hepatitis, and ultimately cirrhosis and the associated complications of liver failure and hepatocellular carcinoma [2]. The outcome of primary HCV infection is driven by the interplay between rapid viral evolution and host adaptive immune responses [3], [4]. Analogous to other RNA virus infections, development of effective vaccines and antiviral treatments has been constrained by the ability of these viruses to swiftly overcome evolutionary pressures such as host immunity and antiviral drugs [5]–[7].
The rapid rate of evolution in RNA viruses is driven by a highly error-prone RNA-dependent RNA polymerase (RdRp). For HCV, the estimated mutation rate is 1.2×10⁻⁴ substitutions per site per infected cell [8], and with a half-life of 3–5 hrs, it is estimated that at least 1012 particles are generated per day [9]. With these rapid kinetics, at least 109 variants with single - and double-nucleotide changes are likely to arise in each individual multiple times daily [10]. However, the observed viral complexity is much less than this prediction, largely due to reduced fitness of mutated variants [11]. While the error-prone viral replicase results in a continuous supply of new viral variants (genetic drift), purifying selection generated from host immune pressure and viral fitness results in culling and preferential selection of certain variants. When selection overbalances drift, a genetic bottleneck occurs (i.e. evolutionary events resulting in a reduction in genetic variation due to extinction of a significant proportion of the viral variants).
Very little quantification of the within-host evolutionary dynamics of human RNA viruses has been reported, and limited information exists from experimental evolution systems [12], and from viruses infecting animals. For RNA viruses, the effective population size - broadly equated with the number of variants that will contribute genes to the next generation, a key parameter in viral evolution - is smaller than the census size. This discrepancy is often seen at the epidemiological level as result of a strong transmission bottleneck. Well-characterized within-host genetic bottlenecks have been observed upon transmission of a number of RNA viruses, including HIV [13]–[15]. A low effective population size has important consequences for viral evolution, as at small effective population numbers (Ne), random processes (i.e. genetic drift) predominate over deterministic ones (i.e. selection) [16]. Genetic bottlenecks severely limit viral diversity and potentially limit replicative fitness of the resultant virus (reviewed in [12]). After a bottleneck event, RNA viruses undergo rapid evolution, leading to accumulation of deleterious mutations and the occurrence of rare fit variants, which can rapidly reach fixation and dominate the next population.
Following a genetic bottleneck, within-host evolution of rapidly mutating viruses can be characterized by selective sweeps (i.e. the reduction or elimination of variants in the viral population as the result of strong selection pressures), with only a few variants emerging to dominate the future population. This phenomenon is common at the host population level, such as in influenza [17], and has been documented within-host for HCV [18], [19] and HIV [20]. The extent to which positive selection and random genetic drift contribute to the within-host evolution of HCV, and whether selective sweeps observed late in primary infection are related to genetic bottleneck events, remain to be resolved.
A major challenge in studies of the within-host evolution of RNA viruses lies in the capacity to detect low frequency viral variants. Standard cloning techniques, and more recently single genome amplification, followed by sequencing have been used to detect variants present at frequencies as low as 10–15% [15], [21], [22]. Next generation sequencing (NGS), despite high technical errors [23], allows detection of rare variants present at less than 1% of the population [24]–[33]. Data analysis tools have now improved the ability to differentiate true biological variation from technical error [34], [35], and also enabled reconstruction of genomic regions of individual variants from short NGS reads [34], [36].
The early evolution of HCV has been investigated to date only in limited case series [18], [30], [35], [37]–[40], and with a strong bias towards symptomatic cases, who represent a small minority of those with acute infection, and who are known to have an increased likelihood of clearance [3], [4]. Few studies have investigated early infection in a longitudinal fashion [30], [35], [39], [41]. In these cases the frequency, distribution, and timing of viral mutations has been characterized only in limited regions of the virus and with low sensitivity in the detection of rare variants.
Here we report a comprehensive analysis of longitudinal collected samples from four subjects identified very early in asymptomatic acute HCV infection. The aim was to quantify the number of successfully transmitted founder viruses, and to characterize the diversity and complexity of viral population across the genome over the course of the primary infection leading to clearance or chronicity.
Results
Subjects
Four newly viremic seronegative subjects were studied (Figure 1, Table 1, Table S1). Subjects were enrolled in the Hepatitis C Incidence and Transmission Study (HITS) cohort, and had tested negative for HCV antibodies and RNA within 3–6 months prior [42], [43]. The estimated days post-infection (DPI) at enrolment ranged from 30–45 days (Table 1). Two subjects cleared the infection (686_Cl, 360_Cl), and the other two progressed to chronic infection (23_Ch, 240_Ch). A single viral genotype (GT) was detected in each subject: two with GT1a (686_Cl, and 23_Ch), and two with GT3a (360_Cl, and 240_Ch). Figure 1 shows the HCV RNA levels and HCV-specific IgG antibody titers (estimated as the optical density to cut-off ratio in the enzyme immunoassay) over the course of infection.


For the purposes of this analysis, the time course of the primary infection was divided into three phases: i) transmission; ii) an acute phase (designated as <100 DPI); and iii) a pre-chronic phase (designated as >100 DPI) leading to clearance or chronicity at six months post-infection).
Evolutionary dynamics of viral diversity over the course of the infection
NGS, standard cloning and bulk (consensus) sequencing were performed on viremic samples collected longitudinally from each of the subjects (Figure 1). On average, 81,900 reads with average read lengths of 358 bp were generated per subject per timepoint, giving an average coverage depth of 3,093 (Table S2). Single nucleotide polymorphisms (SNP) analysis revealed between 160 and 460 nucleotide substitutions per timepoint. Over the course of the infection more than half of the substitution events occurred at frequencies of <1%, except in subject 240_Ch (38%). Non-synonymous substitutions constituted 40%–57% of the total and were distributed across the genome (Figure 2). Within the first 60 DPI, the prevalence of non-synonymous substitutions was approximately half of the total (50–57%), except in subject 686_Cl (34%). Subject 686_Cl showed the highest prevalence of substitutions with a frequency <1% (76% during the first 60 DPI). In the two subjects who became chronically infected (23_Ch and 240_Ch), the prevalence of substitutions was significantly higher than in subjects who ultimately cleared the infection (686_Cl and 360_Cl). In subjects that progressed to chronicity, some substitutions reached frequencies above 99% (i.e., fixations; see also below).

Shannon entropy (SE) was calculated from the frequencies of nucleotide substitutions measured across the genome. During the acute phase, the SE measures indicated a general decline in viral diversity. This decline did not follow the HCV RNA kinetics. Similar patterns were observed for SE calculated with all substitutions, or with only non-synonymous changes. In two subjects (686_Cl, 23_Ch) at least two pre-seroconversion timepoints were sampled within a window of eight weeks, allowing an accurate assessment of very early HCV evolution, and revealing a peak in viral diversity in temporal proximity to the viremic peak. In the two subjects who ultimately became chronically infected (23_Ch and 240_Ch), SE increased in the pre-chronic phase, which also featured a continued increase in HCV RNA level (Figure 1). The observed patterns of change in SE measured across the full genome were not consistently observed in the 10 protein-encoding regions, clearly indicating a non-uniform evolution of HCV across the genome and between subjects.
Transmission - First bottleneck
To test the hypothesis that a single virus establishes infection upon transmission, a statistical model, PoissonFitter [44] was used to examine whether the viral population had a star-like phylogeny with a Poisson distribution [22]. For this analysis reconstructed viral variants were obtained from NGS reads using a Bayesian statistical tool, ShoRAH [34], [36]. Firstly, viral haplotypes were reconstructed from NGS data at the first viremic timepoint segregated into 400 nt windows across the genome (see Table S3, including the number of variants reconstructed per window). Secondly, reconstructed haplotypes of the E1/HVR1 (871 nt) and partial E2 (932 nt) regions were utilized, along with the corresponding E1/E2 clonal sequences (Table S3). In the second dataset, only variants with a frequency greater than 2.5% were included in this analysis. This cut-off was derived through a validation analysis for the method of reconstruction of viral haplotypes (of length > 400 nt) using a mixed sample of four plasmid E1/E2 clones derived from one subject (see Supporting Text S1 for details). By definition, the sequence of the founder was identified as being: i) the most prevalent variant; and ii) identical to the consensus sequence of the viral population at the first time point [15], [22].
Both the PoissonFitter tests and phylogenetic analyses indicated that the HCV infection in three subjects (686_Cl, 360_Cl, and 240_Ch) was successfully established by a single variant (Figures 3, S1, S2 and Table S3). For these subjects, the highlighter plots show the random distribution of SNPs across the sequences, again consistent with a star-like distribution of variants arising from a single founder. By contrast, Poisson analysis of the remaining subject (23_Ch) indicated that more than one virus established the infection. Phylogenetic analyses of E1, E2 and NS3 regions of subject 23_Ch indicated that at least two viruses had established the infection, designated 23AF and 23BF (Figures 3 and S1, Table S3). These founders generated two major clusters of variants, which were named after the founder variants. These two founder variants were identified with comparable prevalence in both E1/HVR1 (Figure S1) and E2 regions (Figures 3). The average genetic difference between these two dominant variants over E1/E2 regions was 1.3%. In support of these results, the founder variants were also identified via clonal sequencing in both E1/HVR1 (Figure S1) and E2 regions (Figure 3). For 23_Ch, the calculation of the exact number of founder viruses was confounded by the presence of several variants that appeared to have arisen from recombination events between two viruses from each cluster (see for example, variant C1_14b in Figure 3).

A total of 2-5 variants (including the founders) were detected with a frequency above 2.5% in 240_Ch, 686_Cl, and 360_Cl at the first viremic timepoint. Subject 23_Ch presented the most diverse repertoire, with nine variants present in the E1/E2 region. These results, in combination with the fact that >50% of substitutions were present at a frequency <1% (see above), indicate that early HCV evolution was characterized by a large distribution of low frequency variants.
The time since the most recent common ancestor (tMRCA), which is estimated with PoissonFitter, provides an empirical measure of the likely timing of the transmission event [22], [45]. The estimated tMRCA from independent analyses of E1/HVR1 and partial E2 regions closely matched the DPI estimated from the seroconversion timepoint (Tables 1 and S3). The tMRCA estimated from the founder analyses in windows of 400 nt across the full genome also matched the DPI estimated from the seroconversion timepoint (Table S3). As expected, estimates of the tMRCA in 23_Ch from genomic regions with evidence of at least two founders were longer than those estimated from the seroconversion timepoint, indicating that the observed diversity was not likely to be generated by a single founder.
Acute phase - Second bottleneck
Analysis of the viral dynamics in the acute phase of infection (i.e. <100 DPI) for each subject revealed a second genetic bottleneck event brought about by the extinction of several variants. Evidence for this second bottleneck was supported by: i) the decline in SE for all four subjects at the end of the acute phase; ii) a decline in viral diversity evidenced by phylogenetic analysis; and iii) a decrease in the effective population size estimated from viral sequences in the two subjects who developed chronic infection.
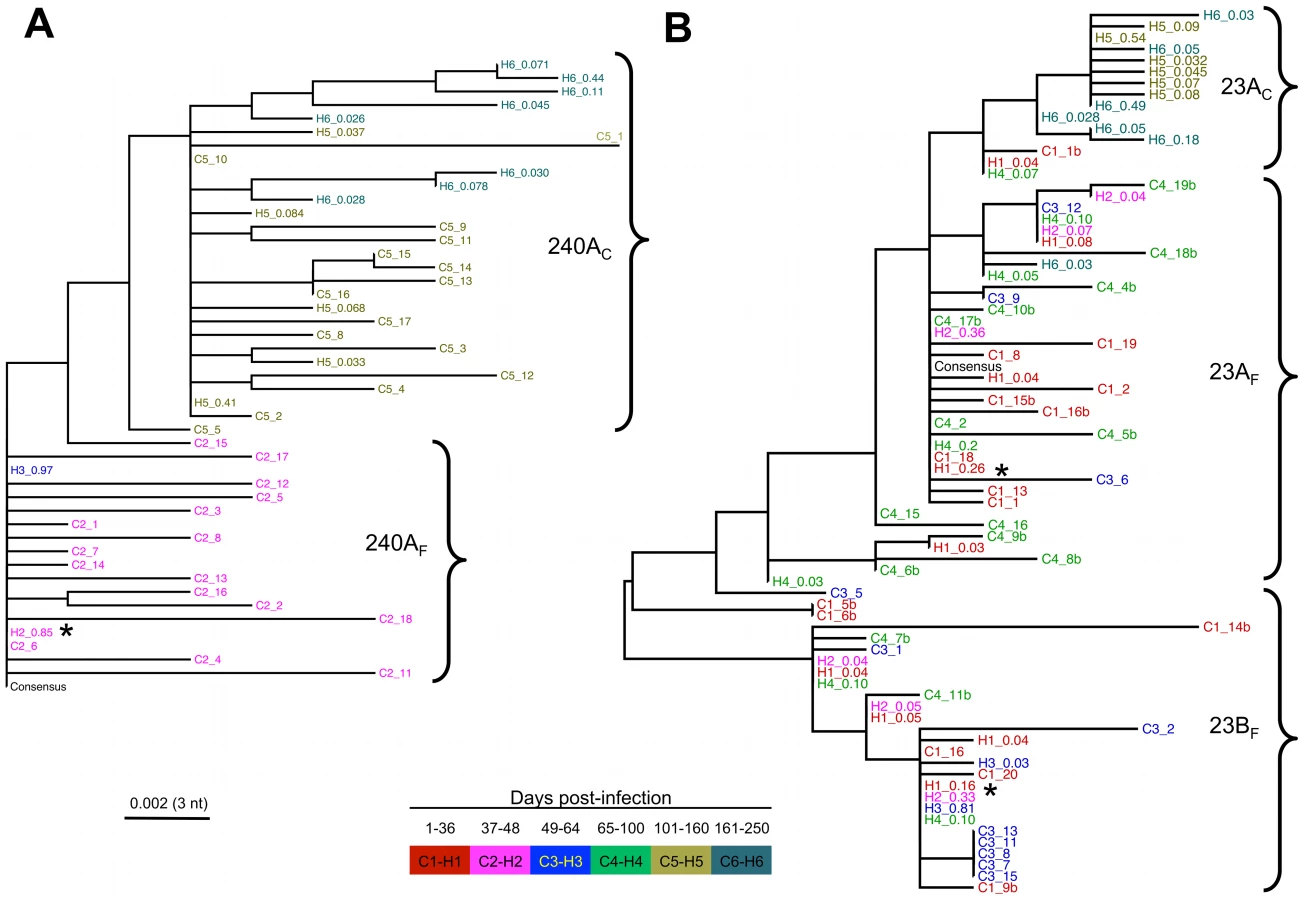
Phylogenetic reconstruction of partial E2 nucleotide sequences showed a decline in viral diversity at the end of the acute phase (Figure 4). In 240_Ch, infection was successfully initiated with a single founder, 240AF, identified here as the most prevalent variant (85% of the population) of the cluster (termed 240AF after the founder) observed in the acute phase (Figures 3 and 4). The early increase in prevalence of the founder variant (up to 97% by 57 DPI) and the absence of minor viral variants, are consistent with the observed decline in SE and increase in HCV RNA level. The two founders identified in 23_Ch differed only at three residues in the E2 region (402, 443 and 446). Initially, these founders were present at comparable levels within the viral population (26% and 16% respectively, Figure 4). However, by 60 DPI, the founder variant within cluster 23AF was undetectable - concomitant with seroconversion and with the decline in HCV RNA level between 44 DPI and 60 DPI (Figure 4). The prevalence of the second founder variant, 23BF remained reasonably stable within the cluster until 60 DPI, whereas by 74 DPI its frequency was greatly diminished, consistent with the overall reduction in HCV RNA level. Similar patterns of decline in viral diversity were also observed by phylogenetic analyses in other regions of the same subjects (E1/HVR1, Figure S3 and NS3, Figure S4) and also in the other two subjects (not shown).
The evolutionary trajectories of individual viral variants at the amino acid level in the partial E2 region (Figure 5) and E1/HVR1 (data not shown), also showed the dominance of two distinct viruses for 23_Ch (23AF and 23BF) and one for 240_Ch (240AF) in the acute phase. Minor variants emerged during this phase with the majority receding below the limit of detection.

A decrease in the effective population size also provided evidence of sequential bottleneck events. A coalescent demographic reconstruction of the viral population within each host, using the Bayesian skyline plot [46] on E1/HVR1 and partial E2 regions (Figure 6) revealed a decline in diversity (measured as Nτ, the product of the effective population size and generation length in days) during the acute phase of infection in both subjects who became chronically infected (23_Ch and 240_Ch). The estimates of the time of infection from this analysis were consistent with those found via the Poisson model (Table S3). Demographic reconstruction for subjects who cleared infection (360_Cl and 686_Cl) showed little variation in effective population size over the course of the infection (Figure S5), which is likely to reflect the short time interval covered by the available samples.

Pre-chronic phase - Selective sweep
The pre-chronic phase (i.e, >100 DPI) featured selective sweeps, with the new variants arising from the preceding viral population in the acute phase, showing remarkably few substitutions reaching fixation in the new population. In subject 240_Ch, following the decline in HCV RNA level at 140 DPI, a new cluster of variants, termed here 240AC, figure 4) replaced the 240AF cluster via a selective sweep brought about by the second bottleneck event. Similarly, in 23_Ch, the recrudescence of viremia in the pre-chronic phase was associated with the emergence of a new cluster, 23AC, which evolved only from cluster 23AF via a selective sweep (Figure 4b). In both subjects a single variant dominated the pre-chronic phase population, accounting for 74% of the total HCV RNA level in subject 23_Ch, and approximately 50% in 240_Ch. Further evidence in support of the establishment of a new viral population in the pre-chronic phase was provided by the increase in effective population size following the second bottleneck, which was particularly evident for 240_Ch (Figure 6).
Fixation (>99%) was observed in a limited number of sites in association with the selective sweep (Figure 2). Fixation occurred at two sites in 23_Ch by 136 DPI (E2, 542; NS3, 1498) and at 12 sites in 240_Ch by 159 DPI (E1, 372; E2 : 443, 483 and 543; NS2, 750; NS3 : 1509, 1606; NS4b: 1768; NS5a: 1985, 1999; NS5B: 2497 and 2973). Further evolution was observed with additional fixation sites occurring by 304 DPI in NS2 (856) and NS5B (2629), indicating the presence of a further selective sweep event. In subject 240_Ch a further selective sweep event occurred by 477 DPI, with fixations observed in E2 (400, 405, 408, 583), NS3 (1641), and NS5a (2361).
Evidence of immune driven selection
In order to determine whether non-synonymous substitutions were likely to be driven by cellular and humoral immune responses, we identified the location of predicted, as well as experimentally-verified, epitopes across the full genome for each subject (Table S4). Analysis of HLA class I restricted cytotoxic T cell (CTL) epitopes revealed a total of 62 amino acid substitutions (29 in 23_Ch, 12 in 240_Ch, 8 in 686_Cl, and 13 in 360_Cl) which were found to be located in HLA-restricted epitopes (Table S4, Figure 5). Twenty-four of these substitutions resulted in mutant epitopes with a lowered predicted binding score, suggesting that these substitutions potentially conferred a CTL immune escape phenotype (Table S5). In 23_Ch, all four sites that reached fixation in the pre-chronic phase lay within HLA-restricted epitopes. In 240_Ch, of the 18 sites that reached fixation in the pre-chronic phase, nine lay within CTL epitopes.
Figure 5 shows the location of the E2 mutations within putative CTL and B cell epitopes in the different variants in subjects 23_Ch and 240_Ch, as well as mutations previously shown to be associated with viral fitness costs. All the identified epitopes within this region carried at least one amino acid change. Two of these mutations (G483D for 240_Ch and T542I for 23_Ch) generated CTL epitopes with reduced binding affinity, thus indicating potential immune escape (Table S4). Interestingly, both subjects also showed a substitution at position 443 (Y443I for 23_Ch and Y443H in 240_Ch) known to be within a B cell epitope [47]. In 240_Ch a mutation at 543 was observed (T543A). Mutations at this site have been reported to alter the yield of precipitated E1/E2 proteins [48].
Comparison between SE (based on all substitutions) at sites of predicted CTL epitopes, with sites at which no epitopes were predicted, revealed significant differences for each subject (Mann Whitney; all p<0.01). In three subjects (excluding 686_Cl who had rare HLA-B alleles, and hence limited information available for epitope prediction), the distribution of SE values based only on non-synonymous substitutions, revealed that epitope regions carried higher SE values (Mann Whitney; p<0.01). These results support the hypothesis that viral evolution is influenced by the host cellular immune response, as has been shown in chronic infection [49]–[52].
Discussion
This comprehensive examination of the pattern and kinetics of viral evolution across the HCV genome has revealed that early primary HCV infection features at least two significant genetic bottleneck events. The first occurred during or immediately after transmission, where only one or two founder viruses successfully initiated infection. The second occurred within 100 DPI, preceding a decline in HCV RNA level, and in temporal proximity to seroconversion. This second bottleneck was followed either by clearance, or by a selective sweep with new variants emerging from the founder virus to dominate the pre-chronic phase of infection. These quantitative analyses of early events in primary HCV infection suggest that strong selective pressures limit viral evolution both during transmission and early infection.
The demonstration here of a single founder virus in three of four IDU-transmitted HCV cases is comparable to studies in HIV, which have shown that the majority of subjects with mucosal transmission had a single founder virus [14], [15], [22], [53], [54]. Interestingly, HIV transmission via IDU was more commonly associated with multiple viruses, although still less than five founders [14]. Investigation of HIV Envelope sequences in 20 heterosexual transmission pairs revealed that the founder variant in the recipient comprised only a small fraction of the viral variants in the donor (i.e. <5%) [55]. The only previous study in HCV using NGS for founder analysis revealed that a small inoculum could explain the limited diversity observed in early infection in two genomic structural regions [30]. For both HIV and HCV, it remains unclear whether the transmission bottleneck is attributable to a low number of variants being transferred between hosts, or is the result of early evolutionary events where a larger number of strains are rapidly eliminated due to varying fitness constraints. As the two founders identified in subject 23_Ch showed relatively limited diversification from each other, it is also plausible that a single founder underwent very rapid evolution within the first few days post-infection in this case.
Very little is known about the phenotypic characteristics of founder viruses in HCV. The Envelope sequences of founder viruses in HIV consistently predict CCR5 tropism, concordant with the evidence for utilization of this co-receptor for infection of tissue macrophages and dendritic cells in the mucosa [56]. A recent phenotypic analysis of HCV variants emerging in HCV-infected liver transplant recipients indicated that strains with increased viral entry efficiency and lower neutralizing affinity were preferentially selected in the post-transplant phase [57]. In the present study, one of the subjects (23_Ch) was infected with at least two founder viruses that differed at only three sites within the envelope region. Interestingly, residues 443 and 446 lie within, or in close proximity to, one of the major CD81 binding domains, spanning residues 436 – 443 [58], suggesting that founder variant 23BF may have had better infectivity allowing it to out-compete variant 23AF in the acute phase. Phenotypic analysis of these two variants is currently underway. On close analysis of some of the minor variants within subject 23_Ch, evidence of potential recombination was identified between the two founder variants. Recombination has been described in RNA viruses, but with limited evidence in HCV (reviewed in [59]). However, as these putative recombinant strains are closely related, it is difficult to distinguish a recombination event from convergent evolution, where closely related variants incorporate common mutations due to shared selective pressure [60]. Furthermore, PCR amplification could also cause recombinant artefacts via template switching.
The novel finding of a genetic bottleneck occurring in the acute phase in all subjects regardless of outcome, calls for comprehensive investigation of the determinants of this phenomenon to identify key factors driving HCV evolution towards chronicity. Consistent with the results of this study, an early reduction in viral diversity within the Envelope region was observed during the acute phase in subjects who subsequently resolved primary HCV infection [19]. This result is somewhat in contrast with the patterns of viral diversity reported by Wang and colleagues who analysed the Envelope region using NGS in three subjects with symptomatic HCV infection [30]. These authors concluded that there was limited diversification in the early phase of infection, which then increased during the chronic phase. However, this conclusion was derived from analysis of a limited region of the genome, and with only one subject sampled longitudinally in the acute phase (assuming a median interval of 50 days between infection and symptom onset). Also, quantification of viral variants was performed only on two short segments of 200 nt and with limited NGS coverage.
The sequential bottleneck events followed by selective sweeps reported here highlights the complex population structure of HCV, and the significance of evolutionary dynamics occurring early in the infection, namely in the first few weeks post-infection. A thorough analysis of these dynamics will ultimately guide understanding of the mechanisms driving establishment of chronic infection. The within-host evolution of HCV observed here is consistent with at least two evolutionary models. Firstly, the observed low effective population size may be the result of strong constraints on infectivity, where only a few viruses can establish infection at each generation. Alternatively, the observed temporal changes in genetic diversity are consistent with a model of evolution via sequential selective sweeps where strong immune pressures drive the establishment of a few escape variants, which then dominate the viral population surviving the bottleneck event. This model has been proposed to explain the epidemiological dynamics occurring in influenza infections [17].
The rapid fixations observed in this study suggest the presence of selective pressures acting on the virus in early infection. The mean number of generations required for a fixation to occur in a neutrally-evolving haploid population (as in RNA viruses) is twice the effective population size, 2 Neff (55). In the case of HCV, using an approximate estimate of Neff = 2000 derived from this study, and a generation time of (say) four days, the estimated fixation time is of the order of years. One explanation for the high fixation rate is that escape from the immune system is likely to be a major driver for such mutations, as well as the occurrence of compensatory mutations. However, the fact that a second genetic bottleneck occurred in the acute phase of the infection suggests that chronic infection may not only be the result of escape from host immune responses, but stochastic events may also be relevant, such as genetic drift. In this scenario, strains surviving the second bottleneck may not be those that escaped the immune response, but merely random survivors [reviewed in 16].
A striking finding in the data presented here is that despite the high mutation rate of HCV [8], the large number of infected hepatocytes [61], [62], and the rapid turnover of virions [9], the observed number of substitutions, and of viral variants, during early infection was relatively small, with the majority of substitutions occurring at frequencies below 2%. In the present study up to 60 variants were observed in the HCV Envelope from viral samples at the first available timepoint (Table S3) and up to 100 variants from pre-chronic samples. These estimates are consistent with those of Wang and colleagues, however, these authors reported only up to four variants in the acute phase, and up to 100 variants from viruses sampled 200 weeks post-infection [30]. It is therefore conceivable that there may be a larger population of variants hidden below the detection threshold in this analysis (0.1%). Studies of HIV diversity have shown that up to 50 amino acid variants are detected in analyses of small epitope regions [54], and at least 15–20 variants have been detected across the full genome [22]. Given that HCV mutates faster than HIV [8], these data raise the question as to why the observed diversity in early HCV is comparable to, or less than, the diversity measured in HIV. Two explanations are possible: firstly, HCV may have an intrinsically higher fitness cost associated with mutations – in another RNA virus, vesicular stomatitis virus, approximately 40% of mutations have been reported to be associated with extinction [8]. One potential instance of relevance identified in the dataset reported here, was in subject 240_Ch, where a CTL epitope in NS3 (surrounding residue 399T) mutated towards I with increasing frequency over the first two timepoints before disappearing below detection. Mutations at this site have been reported to affect viral production [63] (Table S4). A second potential explanation is that early HCV diversity is significantly higher than in subjects with early HIV, but the prevalence of the majority of variants is below the detection threshold – such a skewed distribution has been reported for foot-and-mouth disease virus using NGS [33].
In conclusion, this analysis suggests that the early phase of HCV infection is characterized by strong sequential bottleneck events where diversity is markedly reduced. Whether this is due to strong selective pressure from the host immune response and/or viral fitness cost, remains to be experimentally determined. However, these data suggest that strong selective pressures limit viral evolution early in infection both in subjects that clear infection and those that progress to chronicity. Ultimately, better-informed strategies to modify these selective pressures may alter this outcome, potentially including immunotherapeutic approaches via vaccination, or antiviral therapies to constrain viral replication and hence escape.
Materials and Methods
HCV cohort
Four early incident cases were recruited from HITS, which is a prospective cohort of HCV seronegative and HCV RNA negative prison inmates in New South Wales, Australia [42]. Blood samples were collected frequently over 24 weeks following initial viremia, with at least one pre-seroconversion sample collected for each subject (Table S1). HCV antibody testing was performed as described [42]. The date of infection was estimated by subtracting the average pre-seronversion window period, which has been estimated at 51 days [64]–[66], from the midpoint between last seronegative and first seropositive timepoints.
HCV antibody testing was performed using the qualitative Abbott ARCHITECT anti-HCV chemiluminescent microparticle immunoassay (Abbott Diagnostics, Abbott Park, IL, USA). Qualitative HCV RNA detection was performed either using the VERSANT HCV RNA Qualitative Transcription Mediated Amplification (TMA) assay (Bayer Diagnostics, Emeryville, CA, USA; lower limit of detection: 3,200 copies/ml) or COBAS AmpliPrep/COBAS TaqMan HCV assay (Roche, Branchburg, NJ, USA; lower limit of detection 223 genome copies/ml).
Ethics statement
Ethical approvals were obtained from Human Research Ethics Committees of Justice Health (reference number GEN 31/05), New South Wales Department of Corrective Services (reference number 05/0884), and the University of New South Wales (reference numbers 05094, 08081), all located in Sydney, Australia. Written informed consent was obtained from the participants.
RNA extraction and amplification of partial 5′UTR to 3′ NS5B for NGS
Viral RNA was extracted as previously described [67]. Near full length HCV cDNA was synthesized from 8 µl of viral RNA with the Superscript III First-Strand Synthesis System for RT-PCR (Invitrogen, Mt. Waverley, Australia) and a genotype specific primer (Table S6) according to manufacturers' instructions. The region spanning nt 98 to 9314 (nt position designated according to H77, GenBank accession number AF011751) was amplified from the cDNA in two (5′ UTR - 3′ NS2 and 3′ NS2 - 3′ NS5B) or three fragments (5′ UTR -3′ NS2, 3′ NS2 - 5′ NS4B, and 5′ NS4B - 3′ NS5B) with genotype specific primers (Table S6) in a single PCR round with SequalPrep Long PCR kit (Invitrogen). First round PCRs were performed using 5 µl of cDNA added to 15 µl of PCR reaction mix according to manufacturers' instructions (Invitrogen). First round PCR was carried out for 94°C for 2 min, then 10 cycles of 94°C, 50°C, 68°C for 30 sec, 30 sec and 6 min, respectively and followed with an additional 25 cycles of 94°C, 58°C, 52°C for 30 sec, 30 sec and 6 min (plus 20 sec extra each cycle), respectively. Second round PCR was performed using 5 µl of first round product and an inner set of genotype specific primers (Table S6) added to 45 µl of PCR reaction mix. Reaction mix and conditions were as described above with one exception; the annealing temperature was raised to 60°C.
For the GT3, and some GT1a samples (subject 686 2/3/09, 23/3/09 and 6/4/09, and subject 23 2/6/09, 2/7/09 and 1/9/09), it was not possible to obtain a single amplicon spanning the 3′ NS2 to 3′ NS5B and this region was amplified from the first round product in two fragments, 3′ NS2 to 5′ NS4B and 5′ NS4B to 3′ NS5B. Nested round amplification was performed with Platinum Taq High Fidelity (Invitrogen). Reaction conditions were as specified in the manufacturers' instructions with 5 µl of first round product added as template.
PCR products were electrophoresed on 0.8% agarose in 0.5× TBE buffer and products of the correct size were gel purified with the QIAquick gel extraction kit (Qiagen) and confirmed to be the amplicon of interest by direct sequencing on an ABI 3730 DNA Analyzer (Applied Biosystems, Foster City, CA, US) using dye-terminator chemistry.
Roche 454 FLX sequencing
PCR amplicons were quantified with the Picogreen dsDNA assay (Invitrogen). Genome fragments amplified from the same timepoint were pooled in equimolar amounts to obtain equal coverage, and submitted for library preparation before subsequent NGS [23] using 454 Roche FLX Titanium at the Murdoch University, Perth, Australia. Pyrosequencing was performed in three independent runs. The first two runs were carried out without bar-coding. The last run was performed using bar-coding given the improvement of this technology over the course of the study. The last run included two samples for each of the subjects 23_Ch, 686_Cl, and 360_Cl. All other samples were analyzed in the first two runs.
E1/E2 clones
The 3′ end of Core to 5′ end of p7 region was amplified for selected timepoints from each subject with genotype specific primers (Table S6) and Platinum Taq DNA polymerase High Fidelity, using the gel purified PCR product submitted for deep sequencing as the DNA template. The 2534 bp product was TA ligated into the pGEM-T Easy vector (Promega, Wisconsin, United States). Individual colonies were screened by PCR for inserts of the appropriate size with vector specific primers and the amplicons sequenced.
454 FLX data alignment
454 FLX sequence reads were removed prior to the assembly stage if they were: shorter than 55 bp and had an average quality score <20. The terminal 20 nt were removed from all remaining reads. These remaining sequences were aligned with a nucleotide identity threshold of 95% against each subject's unique consensus sequence with the alignment tool, MOSAIK (http://bioinformatics.bc.edu/marthlab/Mosaik). The recommended parameters for 454 data were used in aligning these reads. Each subject's consensus sequence was derived from sequencing the gel purified PCR products on the ABI 3730 DNA Analyzer spanning the near full-length genome generated at the first viremic timepoint. The quality of the aligned file was assessed and reads were excluded from the alignment on the following basis: i) hypermutated sequence (sequences with more than 5 nt mutations within the first 20 position of the read in either of the ends; ii) reads with indels that resulted in a frame-shift or reads with a high frequency (5%) of indels relative to the reference.
SNP detection and haplotype reconstruction
Aligned 454 reads were further analyzed with a Bayesian probabilistic method implemented in the software package ShoRAH [68], [69]. This software was used to: i) perform error correction on 454 FLX reads; ii) estimate the distribution of SNPs and their prevalence, using a detection threshold of 0.1%; iii) reconstruct HCV variants (haplotypes) in local windows of 400 nt; iv) reconstruct HCV haplotypes on the Envelope region of the HCV genome (∼1000 nt in length); and v) to estimate the frequency of occurrence of reconstructed variants within the sample. The result of this global analysis on the Envelope region was compared to the available sequences obtained from standard cloning and sequencing. The ShoRAH analyses were performed in triplicate for each dataset to ensure that the stochastic nature of Bayesian statistics based on Monte Carlo Markov Chain simulations was not affecting the results. Only SNPs and variants detected in all the three simulation runs were considered for further analyses.
Further automated cleaning of the SNPs generated via the ShoRAH method was performed, based on the following criteria: (i) sequences where the reverse and forward strand differed in a frequent base substitution, allowing only a difference of 10% between forward and reverse reads; (ii) SNPs which were only present at the end of reads; and (iii) if the nucleotides adjacent to the SNP were part of a homopolymeric stretch. The results from ShoRAH were also compared to those obtained using a cut-off method, such as that provided in the software package, Varscan [70].
For the analysis of the Envelope region of the genome, only reconstructed variants with frequencies >2.5% were considered for further analysis (see Supporting Text S1). The probabilistic nature of the clustering algorithm allows for estimation of the reliability of predictions. In the Bayesian scenario implemented in ShoRAH, the fraction of iterations in which a haplotype is reported estimates the posterior probability of the existence of that haplotype. This posterior probability provides a confidence level for the haplotype. Only haplotypes with confidence values (posterior probabilities) greater than 0.9 are reported. Scripts and parameter values used for the analyses are available upon request. Parameters of ShoRAH have been chosen through a detailed preliminary analysis on the sensitivity of these parameters in collaboration with Dr Zagordi (personal communication).
Founder virus analysis
PoissonFitter was used to test the hypothesis that a single virus establishes infection [71]. PoissonFitter performs two tests: one test is based on the fit of the Poisson model to the frequency distribution of the Hamming distance observed in each sample; the other is a topological test to verify that observed frequencies are distributed according to a star-like phylogeny (for this test, no formal statistic is available and consequently no p-value is obtained). In this model the main assumption is that a single founder virus evolves under neutral evolution, generating a star-like phylogeny, with a distribution of mutations conforming to a Poisson distribution [15], [45]. This means that early selective pressures compromise the statistical analysis. For this reason, only HCV sequences obtained from the first available viremic time point for each subject were included in the founder virus analysis. PoissonFitter test was performed on reconstructed viral variants in E1/E2 region of the genome, as well as on reconstructed variants obtained from 400 nt windows sliding across the full genome. A type 1 error threshold α = 0.01 was assumed to conclude whether the Poisson test was rejected. For the initial analysis, in each window a conclusion was made whether one, or more than one, founder virus explained the observations. In cases where the two tests described above were discordant (i.e. a significant fit with Poisson test of a single founder virus, but no star-like phylogeny – which occurred in seven analyses; or the Poisson test suggested more than one founder while the topological test conformed to a star-like phylogeny – which occurred in eight analyses) then early stochastic events were assumed to have occurred, which limited the validity of the tests. These early events could result from an early selective pressure, or strong fitness advantage associated with early mutations. In this analysis, the mutation rate for the HCV genome was set to 1.2×10⁻⁴, as recently estimated [72]. We assumed the same value was constant across the HCV genome.
Phylogenetic analysis
Sequences from standard cloning and reconstructed haplotypes were visualized and curated with MEGA [73] and R packages. Phylogenetic and evolutionary analyses were performed with PhyML [74]. Trees were constructed from sequences using a GTR substitution model with gamma invariant sites, as suggested by analyses using ModelTEST [75]. Trees were visualized with FigTree. Estimates of tMRCA were performed with PoissonFitter and with BEAST [76].
Demographic reconstruction of the within-subject viral population was performed with skyline plots implemented in BEAST [47], [63]. The analysis was performed using both a strict clock model and a relaxed molecular clock model. The length of the MCMC chain was chosen so that the effective sample size (ESS) for each parameter was > 100. Bayesian factors were then used to decide the best model. For each subject, the null hypothesis of a strict clock was not rejected according to the Bayes Factor calculated from the posterior distributions obtained from each model (BF<2).
The evolutionary distances were estimated as within-group mean genetic distances estimated using Maximum Composite Likelihood (implemented in Mega 5) from reconstructed variants from NGS in the E1/E2 region of the HCV genome.
CD8+ epitope predictions
Subjects were HLA typed (Table S2) and MHC Class I restricted epitopes were predicted using available algorithms in http://www.immuneepitope.org. For each subject, several different algorithms were tested with similar results. For simplicity, the results presented are derived from prediction with NetMHC http://www.cbs.dtu.dk/services/NetMHC/, which uses an artificial neural network for predictions. Known HCV epitopes were retrieved from the database http://www.immuneepitope.org (last access, 24 January 2011).
Predicted HLA-A or B restricted epitopes derived from consensus sequence of the viral genome at each time point and in each subject, were used to test the hypothesis that the distribution of Shannon entropy measures in genomic regions carrying predicted epitopes differ from the distribution of Shannon entropy values in region without predicted epitopes. Statistical testing was performed using the Mann-Whitney U test. A one-tailed test was performed to examine the hypothesis that epitope regions had higher SE measures than non-epitope regions.
Supporting Information
Zdroje
1. The Global Burden Of HepatitisCWG 2004 Global burden of disease (GBD) for hepatitis C. J Clin Pharmacol 44 20 29
2. AscioneATartaglioneTDi CostanzoGG 2007 Natural history of chronic hepatitis C virus infection. Dig Liv Dis 39 Suppl 1 S4 7
3. BowenDWalkerC 2005 Adaptive immune responses in acute and chronic hepatitis C virus infection. Nature 436 946 952
4. PostJRatnarajahSLloydAR 2009 Immunological determinants of the outcomes from primary hepatitis C infection. Cell Mol Life Sci 66 733 756
5. StricklandGEl-KamarySKlenermanPNicosiaA 2008 Hepatitis C vaccine: supply and demand. Lancet Infect Dis 8 379 386
6. MaherLWhiteBHellardMMaddenAPrinsM 2010 Candidate hepatitis C vaccine trials and people who inject drugs: challenges and opportunities. Vaccine 28 7273 7278
7. TorresiJJohnsonDWedemeyerH 2011 Progress in the development of preventive and therapeutic vaccines for hepatitis C virus. J Hepatol 54 1273 1285
8. SanjuanRMoyaAElenaSF 2004 The distribution of fitness effects caused by single-nucleotide substitutions in an RNA virus. Proc Natl Acad Sci U S A 101 8396 8401
9. NeumannAULamNPDahariHGretchDRWileyTE 1998 Hepatitis C viral dynamics in vivo and the antiviral efficacy of interferon-alpha therapy. Science 282 103 107
10. GuedjJRongLDahariHPerelsonAS 2010 A perspective on modelling hepatitis C virus infection. J Viral Hepat 17 825 833
11. DuffySShackeltonLAHolmesEC 2008 Rates of evolutionary change in viruses: patterns and determinants. Nat Rev Genet 9 267 276
12. ElenaSFSanjuánR 2007 Virus evolution: insights from an experimental approach. Annu Rev Ecol Evol Syst 38 27 52
13. BoutwellCLRollandMMHerbeckJTMullinsJIAllenTM 2010 Viral evolution and escape during acute HIV-1 infection. J Infect Dis 202 Suppl 2 S309 314
14. BarKJLiHChamberlandATremblayCRoutyJP 2010 Wide variation in the multiplicity of HIV-1 infection among injection drug users. J Virol 84 6241 6247
15. KeeleBFGiorgiEESalazar-GonzalezJFDeckerJMPhamKT 2008 Identification and characterization of transmitted and early founder virus envelopes in primary HIV-1 infection. Proc Natl Acad Sci U S A 105 7552 7557
16. KouyosRDAlthausCLBonhoefferS 2006 Stochastic or deterministic: what is the effective population size of HIV-1? Trends Microbiol 14 507 511
17. KoelleKCobeySGrenfellBPascualM 2006 Epochal evolution shapes the phylodynamics of interpandemic influenza A (H3N2) in humans. Science 314 1898 1903
18. SheridanIPybusOGHolmesECKlenermanP 2004 High-resolution phylogenetic analysis of hepatitis C virus adaptation and its relationship to disease progression. J Virol 78 3447 3454
19. FarciPShimodaACoianaADiazGPeddisG 2000 The outcome of acute hepatitis C predicted by the evolution of the viral quasispecies. Science 288 339 344
20. ShankarappaRMargolickJBGangeSJRodrigoAGUpchurchD 1999 Consistent viral evolutionary changes associated with the progression of human immunodeficiency virus type 1 infection. J Virol 73 10489 10502
21. GoonetillekeNLiuMKSalazar-GonzalezJFFerrariGGiorgiE 2009 The first T cell response to transmitted/founder virus contributes to the control of acute viremia in HIV-1 infection. J Exp Med 206 1253 1272
22. Salazar-GonzalezJFSalazarMGKeeleBFLearnGHGiorgiEE 2009 Genetic identity, biological phenotype, and evolutionary pathways of transmitted/founder viruses in acute and early HIV-1 infection. J Exp Med 206 1273 1289
23. MarguliesMEgholmMAltmanWEAttiyaSBaderJS 2005 Genome sequencing in microfabricated high-density picolitre reactors. Nature 437 376 380
24. WangCMitsuyaYGharizadehBRonaghiMShaferRW 2007 Characterization of mutation spectra with ultra-deep pyrosequencing: application to HIV-1 drug resistance. Genome Res 17 1195 1201
25. WangGPCiuffiALeipzigJBerryCCBushmanFD 2007 HIV integration site selection: analysis by massively parallel pyrosequencing reveals association with epigenetic modifications. Genome Res 17 1186 1194
26. HoffmannCMinkahNLeipzigJWangGArensMQ 2007 DNA bar coding and pyrosequencing to identify rare HIV drug resistance mutations. Nucleic Acids Res 35 e91
27. LeTChiarellaJSimenBBHanczarukBEgholmM 2009 Low-abundance HIV drug-resistant viral variants in treatment-experienced persons correlate with historical antiretroviral use. PLoS One 4 e6079
28. TsibrisAMKorberBArnaoutRRussCLoCC 2009 Quantitative deep sequencing reveals dynamic HIV-1 escape and large population shifts during CCR5 antagonist therapy in vivo. PLoS One 4 e5683
29. JohnsonJALiJFWeiXLipscombJIrlbeckD 2008 Minority HIV-1 drug resistance mutations are present in antiretroviral treatment-naive populations and associate with reduced treatment efficacy. PLoS Med 5 e158
30. WangGPSherrill-MixSAChangKMQuinceCBushmanFD 2010 Hepatitis C virus transmission bottlenecks analyzed by deep sequencing. J Virol 84 6218 6228
31. SolmoneMVincentiDProsperiMCBrusellesAIppolitoG 2009 Use of massively parallel ultradeep pyrosequencing to characterize the genetic diversity of hepatitis B virus in drug-resistant and drug-naive patients and to detect minor variants in reverse transcriptase and hepatitis B S antigen. J Virol 83 1718 1726
32. Margeridon-ThermetSShulmanNSAhmedAShahriarRLiuT 2009 Ultra-deep pyrosequencing of hepatitis B virus quasispecies from nucleoside and nucleotide reverse-transcriptase inhibitor (NRTI)-treated patients and NRTI-naive patients. J Infect Dis 199 1275 1285
33. WrightCFMorelliMJThebaudGKnowlesNJHerzykP 2011 Beyond the consensus: dissecting within-host viral population diversity of Foot-and-Mouth Disease Virus by using next-generation genome sequencing. J Virol 85 2266 2275
34. ZagordiOKleinRDaumerMBeerenwinkelN 2010 Error correction of next-generation sequencing data and reliable estimation of HIV quasispecies. Nucleic Acids Res 38 7400 7409
35. FarciPPurcellRH 2000 Clinical significance of hepatitis C virus genotypes and quasispecies. Semin Liver Dis 20 103 126
36. ZagordiOGeyrhoferLRothVBeerenwinkelN 2010 Deep sequencing of a genetically heterogeneous sample: local haplotype reconstruction and read error correction. J Comput Biol 17 417 428
37. TimmJLauerGMKavanaghDGSheridanIKimAY 2004 CD8 epitope escape and reversion in acute HCV infection. J Exp Med 200 1593 1604
38. CoxALMosbrugerTLauerGMPardollDThomasDL 2005 Comprehensive analyses of CD8+ T cell responses during longitudinal study of acute human hepatitis C. Hepatology 42 104 112
39. CoxALMosbrugerTMaoQLiuZWangXH 2005 Cellular immune selection with hepatitis C virus persistence in humans. J Exp Med 201 1741 1752
40. ChenSWangYM 2007 Evolutionary study of hepatitis C virus envelope genes during primary infection. Chin Med J (Engl) 120 2174 2180
41. RaySCFanningLWangXHNetskiDMKenny-WalshE 2005 Divergent and convergent evolution after a common-source outbreak of hepatitis C virus. J Exp Med 201 1753 1759
42. TeutschSLucianiFScheuerNMcCredieLHosseinyP 2010 Incidence of primary hepatitis C infection and risk factors for transmission in an Australian prisoner cohort. BMC Public Health 10 633
43. DolanKTeutschSScheuerNLevyMRawlinsonW 2010 Incidence and risk for acute hepatitis C infection during imprisonment in Australia. Eur J Epidemiol 25 143 148
44. GiorgiEEFunkhouserBAthreyaGPerelsonASKorberBT Estimating time since infection in early homogeneous HIV-1 samples using a poisson model. BMC Bioinformatics 11 532
45. LeeHYGiorgiEEKeeleBFGaschenBAthreyaGS 2009 Modeling sequence evolution in acute HIV-1 infection. J Theor Biol 261 341 360
46. DrummondAJRambautAShapiroBPybusOG 2005 Bayesian coalescent inference of past population dynamics from molecular sequences. Mol Biol Evol 22 1185 1192
47. ZhangPZhongLStrubleEBWatanabeHKachkoA 2009 Depletion of interfering antibodies in chronic hepatitis C patients and vaccinated chimpanzees reveals broad cross-genotype neutralizing activity. Proc Natl Acad Sci U S A 106 7537 7541
48. OwsiankaAMTimmsJMTarrAWBrownRJHicklingTP 2006 Identification of conserved residues in the E2 envelope glycoprotein of the hepatitis C virus that are critical for CD81 binding. J Virol 80 8695 8704
49. RuhlMKnuschkeTSchewiorKGlavinicLNeumann-HaefelinC 2011 The CD8+ T-Cell Response Promotes Evolution of Hepatitis C Virus Nonstructural Proteins. Gastroenterology 140 2064 2073
50. MeraniSPetrovicDJamesIChopraACooperD 2011 Effect of immune pressure on hepatitis C virus evolution: insights from a single-source outbreak. Hepatology 53 396 405
51. GaudieriSRauchAParkLPFreitasEHerrmannS 2006 Evidence of viral adaptation to HLA class I-restricted immune pressure in chronic hepatitis C virus infection. J Virol 80 11094 11104
52. TimmJLiBDanielsMGBhattacharyaTReyorLL 2007 Human leukocyte antigen-associated sequence polymorphisms in hepatitis C virus reveal reproducible immune responses and constraints on viral evolution. Hepatology 46 339 349
53. BuschMPGlynnSAWrightDJHirschkornDLaycockME 2005 Relative sensitivities of licensed nucleic acid amplification tests for detection of viremia in early human immunodeficiency virus and hepatitis C virus infection. Transfusion 45 1853 1863
54. FischerWGanusovVVGiorgiEEHraberPTKeeleBF 2010 Transmission of single HIV-1 genomes and dynamics of early immune escape revealed by ultra-deep sequencing. PLoS One 5 e12303
55. HaalandREHawkinsPASalazar-GonzalezJJohnsonATichacekA 2009 Inflammatory genital infections mitigate a severe genetic bottleneck in heterosexual transmission of subtype A and C HIV-1. PLoS Pathog 5 e1000274
56. ZhuTMoHWangNNamDSCaoY 1993 Genotypic and phenotypic characterization of HIV-1 patients with primary infection. Science 261 1179 1181
57. Fafi-KremerSFofanaISoulierECarollaPMeulemanP 2010 Viral entry and escape from antibody-mediated neutralization influence hepatitis C virus reinfection in liver transplantation. J Exp Med 207 2019 2031
58. McCaffreyKBooIPoumbouriosPDrummerHE 2007 Expression and characterization of a minimal hepatitis C virus glycoprotein E2 core domain that retains CD81 binding. J Virol 81 9584 9590
59. MorelVFournierCFrancoisCBrochotEHelleF 2011 Genetic recombination of the hepatitis C virus: clinical implications. J Viral Hepat 18 77 83
60. HoltKEParkhillJMazzoniCJRoumagnacPWeillFX 2008 High-throughput sequencing provides insights into genome variation and evolution in Salmonella Typhi. Nat Genet 40 987 993
61. StifflerJDNguyenMSohnJALiuCKaplanD 2009 Focal distribution of hepatitis C virus RNA in infected livers. PLoS One 4 e6661
62. BartenschlagerRLohmannV 2000 Replication of hepatitis C virus. J Gen Virol 81 1631 1648
63. MaYYatesJLiangYLemonSMYiM 2008 NS3 helicase domains involved in infectious intracellular hepatitis C virus particle assembly. J Virol 82 7624 7639
64. BuschMP 2001 Insights into the epidemiology, natural history and pathogenesis of hepatitis C virus infection from studies of infected donors and blood product recipients. Transfus Clin Biol 8 200 206
65. GlynnSAWrightDJKleinmanSHHirschkornDTuY 2005 Dynamics of viremia in early hepatitis C virus infection. Transfusion 45 994 1002
66. Page-ShaferKPappalardoBLToblerLHPhelpsBHEdlinBR 2008 Testing strategy to identify cases of acute hepatitis C virus (HCV) infection and to project HCV incidence rates. J Clin Microbiol 46 499 506
67. PhamSTBullRABennettJMRawlinsonWDDoreGJ 2010 Frequent multiple hepatitis C virus infections among injection drug users in a prison setting. Hepatology 52 1564 1572
68. ZagordiOKleinRDaumerMBeerenwinkelN 2010 Error correction of next-generation sequencing data and reliable estimation of HIV quasispecies. Nucleic Acids Res 38 7400 7409
69. ZagordiOGeyrhoferLRothVBeerenwinkelN 2010 Deep sequencing of a genetically heterogeneous sample: local haplotype reconstruction and read error correction. J Comput Biol 17 417 428
70. KoboldtDCChenKWylieTLarsonDEMcLellanMD 2009 VarScan: variant detection in massively parallel sequencing of individual and pooled samples. Bioinformatics 25 2283 2285
71. GiorgiEEFunkhouserBAthreyaGPerelsonASKorberBT 2010 Estimating time since infection in early homogeneous HIV-1 samples using a poisson model. BMC Bioinformatics 11 532
72. SanjuanRNebotMRChiricoNManskyLMBelshawR 2010 Viral mutation rates. J Virol 84 9733 9748
73. TamuraKDudleyJNeiMKumarS 2007 MEGA4: Molecular Evolutionary Genetics Analysis (MEGA) software version 4.0. Mol Biol Evol 24 1596 1599
74. GuindonSGascuelO 2003 A simple, fast, and accurate algorithm to estimate large phylogenies by maximum likelihood. Syst Biol 52 696 704
75. PosadaDBuckleyTR 2004 Model selection and model averaging in phylogenetics: advantages of akaike information criterion and bayesian approaches over likelihood ratio tests. Syst Biol 53 793 808
76. DrummondAJRambautA 2007 BEAST: Bayesian evolutionary analysis by sampling trees. BMC Evol Biol 7 214
Štítky
Hygiena a epidemiologie Infekční lékařství LaboratořČlánek vyšel v časopise
PLOS Pathogens
2011 Číslo 9
- Parazitičtí červi v terapii Crohnovy choroby a dalších zánětlivých autoimunitních onemocnění
- Vakcíny proti klíšťové encefalitidě
- Kdy je nejlepší očkovat
- Možné vedlejší účinky očkování
- Imunogenita vakcín
Nejčtenější v tomto čísle
- HTLV-1 Propels Thymic Human T Cell Development in “Human Immune System” Rag2 gamma c Mice
- Hostile Takeover by : Reorganization of Parasite and Host Cell Membranes during Liver Stage Egress
- Exploiting and Subverting Tor Signaling in the Pathogenesis of Fungi, Parasites, and Viruses
- A Viral Ubiquitin Ligase Has Substrate Preferential SUMO Targeted Ubiquitin Ligase Activity that Counteracts Intrinsic Antiviral Defence
Zvyšte si kvalifikaci online z pohodlí domova
Mazová zátka a její řešení
nový kurzVšechny kurzy