
A Bistable Switch and Anatomical Site Control Virulence Gene Expression in the Intestine
A fundamental, but unanswered question in host-pathogen interactions is the timing, localization and population distribution of virulence gene expression during infection. Here, microarray and in situ single cell expression methods were used to study Vibrio cholerae growth and virulence gene expression during infection of the rabbit ligated ileal loop model of cholera. Genes encoding the toxin-coregulated pilus (TCP) and cholera toxin (CT) were powerfully expressed early in the infectious process in bacteria adjacent to epithelial surfaces. Increased growth was found to co-localize with virulence gene expression. Significant heterogeneity in the expression of tcpA, the repeating subunit of TCP, was observed late in the infectious process. The expression of tcpA, studied in single cells in a homogeneous medium, demonstrated unimodal induction of tcpA after addition of bicarbonate, a chemical inducer of virulence gene expression. Striking bifurcation of the population occurred during entry into stationary phase: one subpopulation continued to express tcpA, whereas the expression declined in the other subpopulation. ctxA, encoding the A subunit of CT, and toxT, encoding the proximal master regulator of virulence gene expression also exhibited the bifurcation phenotype. The bifurcation phenotype was found to be reversible, epigenetic and to persist after removal of bicarbonate, features consistent with bistable switches. The bistable switch requires the positive-feedback circuit controlling ToxT expression and formation of the CRP-cAMP complex during entry into stationary phase. Key features of this bistable switch also were demonstrated in vivo, where striking heterogeneity in tcpA expression was observed in luminal fluid in later stages of the infection. When this fluid was diluted into artificial seawater, bacterial aggregates continued to express tcpA for prolonged periods of time. The bistable control of virulence gene expression points to a mechanism that could generate a subpopulation of V. cholerae that continues to produce TCP and CT in the rice water stools of cholera patients.
Published in the journal:
. PLoS Pathog 6(9): e32767. doi:10.1371/journal.ppat.1001102
Category:
Research Article
doi:
https://doi.org/10.1371/journal.ppat.1001102
Summary
A fundamental, but unanswered question in host-pathogen interactions is the timing, localization and population distribution of virulence gene expression during infection. Here, microarray and in situ single cell expression methods were used to study Vibrio cholerae growth and virulence gene expression during infection of the rabbit ligated ileal loop model of cholera. Genes encoding the toxin-coregulated pilus (TCP) and cholera toxin (CT) were powerfully expressed early in the infectious process in bacteria adjacent to epithelial surfaces. Increased growth was found to co-localize with virulence gene expression. Significant heterogeneity in the expression of tcpA, the repeating subunit of TCP, was observed late in the infectious process. The expression of tcpA, studied in single cells in a homogeneous medium, demonstrated unimodal induction of tcpA after addition of bicarbonate, a chemical inducer of virulence gene expression. Striking bifurcation of the population occurred during entry into stationary phase: one subpopulation continued to express tcpA, whereas the expression declined in the other subpopulation. ctxA, encoding the A subunit of CT, and toxT, encoding the proximal master regulator of virulence gene expression also exhibited the bifurcation phenotype. The bifurcation phenotype was found to be reversible, epigenetic and to persist after removal of bicarbonate, features consistent with bistable switches. The bistable switch requires the positive-feedback circuit controlling ToxT expression and formation of the CRP-cAMP complex during entry into stationary phase. Key features of this bistable switch also were demonstrated in vivo, where striking heterogeneity in tcpA expression was observed in luminal fluid in later stages of the infection. When this fluid was diluted into artificial seawater, bacterial aggregates continued to express tcpA for prolonged periods of time. The bistable control of virulence gene expression points to a mechanism that could generate a subpopulation of V. cholerae that continues to produce TCP and CT in the rice water stools of cholera patients.
Introduction
Clinical and pathological studies of diverse bacterial pathogens disclose a common theme: the infectious process evolves as a series of spatial and temporal patterns during migration of the pathogen through different tissues and cellular compartments of the host. At each stage different microenvironments are encountered; in response to these, adjustments of the microbial transcriptome and phenotype are thought to occur: virulence genes are induced or silenced and changes in replication rate take place. Spatial differences at the site of infection are magnified by differences in scale between bacteria (microns) and infected host tissues (millimeters or centimeters) leading to situations where bacteria in the same organ could experience dramatically different microenvironments. Spatial and temporal sources of microbial heterogeneity can be compounded by stochastic events that cause cell-to-cell transcriptional and phenotypic differences between genetically-identical individuals in the same microenvironment [1], [2]. Together, these two sources of variation, one deterministic and the other probabilistic, pose significant experimental challenges that impede a deeper understanding of pathogenesis. To address these challenges here we describe results from a study that employed a combination of site-specific and single cell gene expression methods to study Vibrio cholerae infecting the small intestine.
V. cholerae is the etiological agent of cholera, a purging diarrheal illness that occurs in rapidly spreading, seasonally-determined epidemics in south Asia. Ingestion of contaminated water or food containing V. cholerae leads to colonization of the small intestine where production of a powerful enterotoxin induces epithelial cells to secrete water and electrolytes into the bowel lumen [3]. A variety of methods have been used to study murine [4]–[6] and rabbit models of cholera [7]–[9]; collectively, these have identified virulence determinants and characterized early, intermediate and late events in the infectious process. One such study employed confocal microscopy and GFP-labeled bacilli to identify different stages in the infection of rabbit ileal loops [10]. Four hours after the inoculation of V. cholerae into a ligated ileal loop, bacteria migrated from the bowel lumen through the mucus gel to epithelial cell surfaces; eight hours post inoculation large numbers of V. cholerae collect on the surfaces of microvillae and fluid accumulation in the ileal loop lumen is evident; then, between 8 and 12 hours post inoculation, near synchronous detachment of bacteria from the mucosal surface occurs heralding the mucosal escape response, a process that is associated with RpoS-dependent down regulation of virulence gene expression. In humans and in the murine and rabbit models of cholera, the infectious process is accompanied by prodigious intra-intestinal replication of the organism leading to a vast expansion of its biomass and to the possibility that the progeny of the infection, shed in feces, will spread to other susceptible hosts or re-enter natural aquatic reservoirs where the organism resides between outbreaks of human disease [11], [12]. Consistent with the survival of fecal V. cholerae in natural water sources was the identification of sets of genes induced late in the infection of a murine model of cholera that appear to be involved with adaptation of the organism to aquatic environments [13].
Human volunteer studies of V. cholerae mutants show that the clinical hallmarks of cholera require the combined production of two virulence determinants [14]: TCP, which is specified by the tcp operon and promotes small bowel colonization [15], and CT [16], which is encoded by the ctx operon and elicits a secretory response by small bowel epithelial cells. Expression of the tcp and ctx operons is coordinately regulated by the ToxR regulon [15], [17], a multi-component hierarchy of transcription factors that integrates physical and chemical signals, cell density and the physiological state of the organism [18].
Studies of cholera animal models illustrate the difficulty of discerning where, when and by which subsets of the bacterial population key virulence determinants are produced. Earlier work based on a recombination based reporter system showed induction of tcpA and ctxAB by most bacteria during the early stages of infection of a murine model [5]. However, microarray expression profiles of V. cholerae in the fluid that accumulates in ligated loops of the rabbit ileum failed to identify significant expression of tcpA and ctxAB even though CT is required for fluid secretion in this model [19]. This unexpected observation led to the hypothesis that genes encoding CT may only have been expressed by a minority of bacteria or only for a short period of time [19]. A similar paradox can be found in the study of naturally infected cholera patients. Though TCP genes were expressed in the vomitus of cholera patients early in the infectious process [20], a series of three studies showed low, variable or absent expression of these genes by organisms in freshly passed cholera stools [20], [21], [22] even though TCP production is required for the clinical manifestations of the disease [14]. These discrepancies might in part reflect technical variations in the gene expression methods employed or be due to differences in the microenvironments of the colon and rectum (from which the stools were collected) compared to the small bowel (the principal locus of the infection). However, these results also are consistent with the idea that V. cholerae virulence genes are either expressed at a low level by most fecal V. cholerae or at a very high level by a small sub-population of the bacteria [19], [21].
Studies of fecal V. cholerae also showed that freshly-passed cholera stools from naturally infected humans harbor bacteria that are hyper-infectious when tested in an infant mouse model [22]. In vitro propagation of the same strain abolishes the hyper-infectious phenotype indicating that the hyper-infectious state is transient. The hyper-infectious phenotype has now been corroborated by others [23], [24], [25], [26], [27]. Passage of V. cholerae through the infant mouse intestine also induces a hyper-infectious state that was shown to be TCP-dependent [28]. The presence of a hyper-infectious subpopulation of V. cholerae in the stools of cholera patients could promote the rapid dissemination of V. cholerae within households and communities during outbreaks.
In the study reported below we have used the rabbit ileal loop model of cholera and site specific expression profiling to identify virulence genes that are differentially expressed on epithelial surfaces. Further resolution was obtained through the use of single cell expression methods and confocal microscopy to precisely localize where and when in the intestine the gene encoding the principal repeating subunit of the TCP filament is expressed. Expression analysis of a ribosomal promoter, imaged by confocal microscopy at the single cell level of resolution, showed that TCP gene expression and growth are co-localized in the intestine. The capacity to capture the expression behavior of specific virulence genes by individual bacteria led to the discovery that genes encoding TCP and CT are controlled by an epigenetic bistable switch that bifurcates the population into TCP/CT-expressing and TCP/CT-non-expressing subpopulations. The study of mutants in the ToxR regulatory cascade showed that this switch requires autocatalytic regulation of the gene encoding the ToxT transcription factor and the CRP-cAMP complex. Together these observations provide a mechanistic explanation for the presence of a subpopulation of TCP-expressing, hyper-infectious bacteria in the stools of cholera patients.
Results
Site-specific localization of V. cholerae virulence gene expression in the intestine
Confocal microscopy studies of GFP-labeled V. cholerae O1 El Tor (strain A1552) in the rabbit ileal loop model of cholera 4, 8 and 12 hours after inoculation have previously shown that V. cholerae resides in at least three anatomically distinct sites in the ileal loop at the same time point: the epithelial surface; the mucus gel overlying the epithelial surface; and, in fluid that collects in the lumen of the loop [10]. To determine if virulence gene expression differs as a function of anatomical location, we obtained microarray expression data from V. cholerae collected from two anatomically distinct sites of the same ileal loop at 4, 8 and 12 hours post inoculation. Because the epithelial surface and overlying mucus gel could not be separated, these contiguous sites were obtained as a single fraction. V. cholerae in luminal fluid were collected as a second fraction by isolating the liquid contents of incised loops.
Dramatic up-regulation of TCP biosynthetic genes was evident in the mucus gel/epithelial surface fraction of bacteria (Fig. 1). Expression of tcpA (VC0828), the gene encoding the principal repeating subunit of the TCP filament, was 30.0-, 17.0 - and 11.5-fold up-regulated in this fraction 4, 8 and 12 hours post-inoculation, respectively, compared to its expression in mid log phase LB cultures. Also strongly induced in the mucus gel/epithelial cell fraction were the eight downstream genes which together with tcpA compose the operon VC0828 –VC0837 within Vibrio Pathogenicity Island I (VPI-1) (Fig. 1). One of these, tcpF (VC0837), which encodes a soluble colonization factor [29] was up-regulated 19.9-, 15.2-, and 6.7-fold in the mucus gel/epithelial cell fraction at 4, 8 and 12 hours post-inoculation, respectively. By contrast the expression of these genes was markedly lower in the luminal fluid: either no greater than their expression in the mid log phase reference; or, in the case of tcpA, 4.9 - to 3.2-fold lower than its expression in the mucus gel/epithelial cell fraction at the same time point. Even more striking was the localized expression of ctxA and ctxB which encode the A and B subunits of CT: both genes were strongly expressed in the mucus gel/epithelial cell fraction. By contrast, they were not significantly up-regulated in luminal fluid compared to the mid log phase reference (Fig. 1). Taken together, these results show temporal and anatomical localization of V. cholerae virulence gene expression: the expression of these genes is strongest on or close to epithelial cell surfaces early in the infectious process.

ToxT, a member of the AraC/XylS family of transcriptional regulators [30], directly and positively regulates the expression of tcpA-F and ctxAB [31]. The gene encoding ToxT, which resides in VPI-1 adjacent to the tcpA-F operon, was expressed 2.8-, 2.5 - and 1.4-fold greater in the mucus gel/epithelial surface fraction 4, 8 and 12 hours post inoculation, respectively, compared to its expression in the LB broth mid log phase reference (Fig. 1). By contrast, toxT was not up-regulated by V. cholerae collected from the ileal loop fluid. Thus, the expression of toxT, which encodes the proximal regulator of tcpA-F and ctxAB, parallels the expression of the genes it controls. These findings, as demonstrated by microarray expression analysis, were corroborated by quantitative RT-PCR (Table S2), where an even stronger induction of tcpA, ctxA, toxT and tcpP in the mucus fractions was observed, especially during early stages of the infection.
Single cell analysis of tcpA expression in rabbit ileal loops
The localization studies described above were not able to discriminate between the expression of virulence genes by bacteria directly in contact with the epithelial surfaces and their expression by bacteria embedded in the overlying mucus gel. Yet these two microenvironments, though only microns apart, likely represent distinct biochemical milieus. To determine if mucus-embedded and cell-associated bacteria differ with respect to their expression of virulence determinants, tcpA expression by bacteria in ligated ileal loops was monitored by confocal microscopy at the single cell level of resolution.
The tcpA promoter [32] was cloned, fused to the coding sequence of a destabilized variant of the green fluorescent protein (GFP) and inserted as a single copy in the neutral intergenic region between VC0487 and VC0488 on the large chromosome (Fig. 2A). The reporter strain thus harbored the native tcpA gene in VPI-1 and the tcpA-gfp(ASV) reporter at a separate site on the same chromosome. The GFP protein variant encoded by this reporter was modified by the addition of 11 amino acids to the carboxy terminus which targets it for destruction by the ClpXP protease system [33]. As a result, this destabilized derivative of GFP, denoted GFP-ASV, has a markedly reduced half-life (40 minutes in Escherichia coli), yielding a reporter capable of monitoring both increased and decreased activity of the promoter to which it is fused [33], [34], [35]. Thus, this reporter differs from those which encode the stable variant of GFP or which use the recombinase-based reporter of transcription designated RIVET [5]. These systems report activation of the promoter with which they are associated, but cannot report a subsequent decrease in promoter activity. The V. cholerae tcpA-gfp(ASV) reporter strain was phenotypically indistinguishable from the wild type parent with respect to growth and its capacity to colonize the ileal loop and elicit a secretory response. The strain emitted only weak background fluorescence during growth in LB liquid medium. However, significant induction of fluorescence from the tcpA-gfp(ASV) reporter was observed in AKI medium, which induces the expression of the ctxAB and tcpA-F operons [36], [37]. In contrast, fluorescence was not detected when toxR, the global regulator of ctxAB and tcpA-F expression, was deleted from the tcpA-gfp(ASV) reporter strain and the ΔtoxR reporter grown in AKI medium (data not shown). Taken together, these results demonstrate that the fluorescence from the tcpA-gfp(ASV) construct parallels the expression behavior of tcpA.

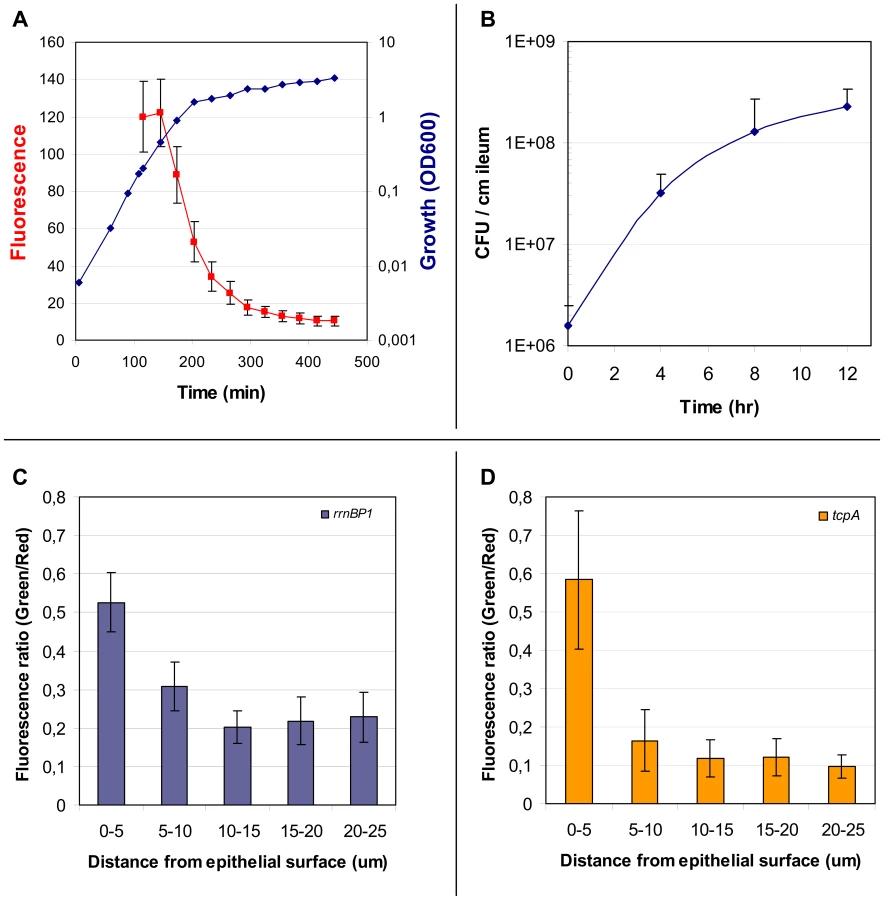
V. cholerae tcpA-gfp(ASV) was inoculated into rabbit ligated ileal loops and expression of the tcpA-gfp(ASV) fusion monitored by confocal microscopy as a function of time and site. In addition, all V. cholerae (i.e., GFP-positive and GFP-negative bacteria) were visualized in the same sample using an O1 antigen-specific antibody so that even bacteria not producing GFP could be identified and distinguished from GFP-producing bacteria. Since the tissue samples were washed before microscopy to remove bacteria present in the luminal fluid, only the bacteria attached to epithelial cell surfaces or residing in the mucus gel coating these surfaces were visualized. Four hours after inoculation of rabbit ligated ileal loops, confocal microscopy showed tcpA-gfp(ASV) expression especially by bacteria which had reached the epithelial surface (Fig. 2B–D). By contrast, tcpA-gfp(ASV) expression was not evident at this time point for most non epithelial surface-associated bacteria that were located in the overlying mucus gel. This distinction was quantified by correlating GFP fluorescence intensity with distance from the nearest epithelial surface. Quantitative image analysis of the ratio between green fluorescence from GFP and red fluorescence from the V. cholerae specific antibody showed significantly stronger expression of tcpA-gfp(ASV) by bacteria ≤5 µm from an epithelial cell surface (Fig. 3D). The average expression level of tcpA-gfp(ASV) declined rapidly for bacteria at greater distances from the epithelium: bacteria further than 5–10 µm from an epithelial surface showed an average fluorescence intensity five-fold lower than bacteria 0–5 µm from an epithelial surface (Fig. 3D). Using the same model system, we have previously shown that expression of GFP from a constitutive promoter was homogeneous throughout the intestine and that the fluorescence did not increase in close proximity to the epithelial surfaces [10]. Consequently, the differences in fluorescence from the tcpA-reporter strain shown in Fig. 2 are very likely caused by differential gene expression. Increased numbers of bacteria were noted eight hours post inoculation. Many were closely associated with epithelial cell surfaces and strongly expressed the tcpA-gfp(ASV) reporter (Fig. 2 E–G). Taken together, single cell tcpA-gfp(ASV) expression data from the 4 and 8 hour post-inoculation time points suggest that bacteria encounter tcpA-inducing signals as they approach or contact the epithelial cell surface. Whether these signals emanate from the epithelial cell as a kind of chemical gradient or require physical contact with the cell surface was not investigated.
Microarray experiments showed the highest expression of tcpA 4 hours post induction, whereas the tcpA-gfp(ASV) reporter showed the strongest induction 8 hours post infection. Thus these two expression methods yielded somewhat different temporal profiles for tcpA expression. However it is not possible to directly compare results from these two expression methods because microarray experiments estimate the average gene expression magnitude of all bacteria in the population, whereas the tcpA-gfp(ASV) reporter captures gene expression magnitude at the single cell level.
An exception to the increasing gradient of tcpA expression from the mucus gel towards the epithelial surface was observed in some locations of the mucus gel where V. cholerae, located at significant distances from the nearest epithelial cell surface, were found to express tcpA-gfp(ASV). Systematic examination of these non cell-associated, tcpA-gfp(ASV)-expressing bacteria showed that they were mainly found in aggregates (denoted by arrows in Fig. 2E) compared to non-aggregated bacteria that do not express tcpA-gfp(ASV). This aggregation-associated, tcpA-inducing phenomenon was evident at the 4, 8 and 12 hour time points and is consistent with the previously-reported TCP-mediated auto-aggregation phenotype [38], [39].
Twelve hours post-inoculation, confocal images showed that most cell-associated bacteria had detached from the epithelial surface and re-entered the mucus gel as part of the previously-described mucosal escape response [10]. Expression of tcpA-gfp(ASV) was markedly reduced at this time point compared to eight hours post-inoculation (Fig. 2 H–J), corroborating microarray expression data which showed that dispersal of bacteria from the villous surface coincides with decreased virulence gene expression (Fig. 1 and [10]). Single cell gene expression analysis of tcpA-gfp (ASV) confirmed that RpoS is required for decreased tcpA expression during the mucosal escape response (Fig. S1) as postulated by Nielsen et al. [10].
Single cell expression analysis of V. cholerae growth in the intestine
Passage of V. cholerae through the human intestine vastly amplifies its biomass. It is, however, unknown how growth rate and virulence are orchestrated as a function of time and anatomical site. To address this question, we used the rabbit ligated ileal loop model of cholera, viable plate counts of V. cholerae in ileal loop fluid and expression of a growth rate-dependent promoter to estimate growth by V. cholerae in the mucus gel and on the epithelial surface.
Beginning with an inoculum of 106 CFUs injected into the ileal loop, viable plate counts of V. cholerae in fluid from the ileal loop lumen increased rapidly for the first four hours (Fig. 3B). Increase in the number of luminal bacteria slowed between the fourth and eighth hour and by hour 12 the apparent growth rate appeared to have further declined (Fig. 3B). However these values likely do not accurately represent in situ growth rates: (1) they register changes in bacterial biomass in only one compartment of the ileal loop (the lumen); (2), they may reflect, but do not directly monitor growth rate since viable plate counts are a function of replication rate, death rate, plating efficiency and other factors; and (3), they do not have the capacity to co-localize virulence gene expression and growth at the micron scale required to correlate both measurements with distance from the epithelial cell surface. These limitations were addressed by performing single cell expression studies and confocal microscopy using gfp(ASV) fused to a growth rate-regulated promoter.
The ribosome synthesis rate and thus the concentration of ribosomes in a cell is directly correlated with growth rate for a wide range of bacteria [40], [41], [42], [43].The growth rate-dependent P1 promoter of the E. coli rrnB ribosomal operon was coupled to gfp(ASV) and the resulting rrnBP1-gfp(ASV) fusion inserted as a single copy between VC0487 and VC0488 on the large chromosome of the same wild type V. cholerae strain that had been used to study in situ expression of tcpA. We selected this promoter fusion because the fluorescence intensity of a Pseudomonas putida strain harboring an E. coli rrnP1-gfp(ASV) reporter accurately reflected both increased and decreased growth and thus could be used in conjunction with confocal microscopy to study bacterial growth rates in complex environments [34].
Growth of the V. cholerae rrnBP1-gfp(ASV) reporter strain in LB medium showed strong fluorescence during exponential growth as quantified by flow cytometry (Fig. 3A). During transition into stationary phase (OD600 = 0.9), a reduction in growth rate was correlated with a reduction in fluorescence intensity. Further progression into stationary phase was accompanied by a rapid decline in fluorescence to approximately 10% of the level observed during exponential growth. Assuming that expression of gfp(ASV) from the rrnP1 promoter ceased after entry into stationary phase, then the rate of the decline in GFP fluorescence corresponds to a maximal GFP(ASV) half life of 40 minutes in V. cholerae.
V. cholerae rrnBP1-gfp(ASV) was inoculated into rabbit ligated ileal loops and samples obtained four, eight and twelve hours post inoculation. The fluorescence intensity of individual bacteria was then monitored by confocal microscopy as a function of time and anatomical site. Four hours post inoculation, bacteria juxtaposed to the epithelial cell surface were found to express the highest levels of GFP, indicating that these bacteria were replicating at a higher rate or were more metabolically active than bacteria residing in the mucus (Fig. 4A–C). The ratio between green fluorescence intensity (from GFP) and red fluorescence intensity (from the V. cholerae O1-specific antibody) was quantified in multiple confocal planes from different images of epithelial tissue four hours post inoculation. Bacteria within 5 µm of the nearest epithelial cell surface produced nearly twice the amount of rRNA-associated fluorescence when compared to bacteria residing at distances further away from the epithelial surface (Fig. 3C). In contrast to the 4 hour time point, fluorescence from the ribosomal promoter fusion was markedly reduced 8 and 12 hours post inoculation (Fig. 4D–I). While most of the rapidly growing bacteria were concentrated on or near epithelial cells early in the infectious process, islands of rapid growth were evident in mucus at sites >10 µm from any cell surface (indicated by arrows in Fig. 4A). Most of these islands were found to be associated with extruded epithelial cells (Fig. S2).

Comparison of single cell gene expression images and quantification of induction levels for the tcpA-gfp(ASV) and rrnBP1-gfp(ASV) promoters suggest that the replication of V. cholerae and the production of TCP are co-localized: both promoters are most active on or near epithelial cell surfaces (Fig. 3C–D). Exceptions to this relationship are the expression of tcpA in non-epithelial surface associated bacterial aggregates and the expression of rrnBP1 within extruded epithelial cells.
Expression of tcpA-gfp(ASV) bifurcates into two subpopulations
Examination of confocal images of V. cholerae tcpA-gfp(ASV) in rabbit ileal loops showed apparent variation between adjacent bacteria in the expression of tcpA twelve hours post-inoculation (Fig. 5A–B). To explore this observation under a more homogeneous condition of growth, fluorescence microscopy was used to qualitatively characterize tcpA-gfp(ASV) expression by V. cholerae in a liquid culture where all bacteria are exposed to the same condition. For this purpose we first used AKI medium, growth in which induces tcpA and ctxAB expression after the bacteria are cultivated four hours in a stationary test tube followed by one hour of growth in a shaken (and thus aerated) flask [36]. Fluorescence microscopy of the culture was conducted at the five hour time point. A small number of strongly GFP-positive bacteria were noted within clumps of weakly fluorescent bacteria (Fig. 5C). However, because four hours of growth in an unstirred test tube preceded the microscopic study of cells at the five hour time point, gradients of oxygen and other metabolites may have formed and given rise to heterogeneity in tcpA expression. To address this issue, we studied the expression of tcpA-gfp(ASV) under a homogeneous condition of growth that did not allow formation of chemical gradients. Expression from the tcpA promoter was induced by adding bicarbonate to stirred HEPES-buffered LB broth containing early exponential phase cultures (OD600 = 0.2), a variation of previously described methods that used bicarbonate or carbon dioxide to induce the production of CT through the activation of the ToxT transcription factor [36], [37], [44]. The distribution of fluorescence intensity was monitored qualitatively by confocal microscopy and quantitatively by flow cytometry. Induction of tcpA-gfp(ASV) expression 30 minutes after addition of bicarbonate to a shaken exponential culture was shown by flow cytometry to be an almost linear function of the bicarbonate concentration (Fig. 6A). The strongest induction of tcpA was observed after the addition of 100 mM bicarbonate, a physiologically relevant value as judged by the 44 mM concentration previously measured in the human ileum [45]. The 100 mM concentration was therefore used in subsequent experiments since it did not cause significant changes in the pH of the medium or alter the growth rate of the bacteria (Fig. 6B).


Three hours after the addition of bicarbonate to a stirred exponentially growing culture, at which time the culture had transitioned into early stationary phase, fluorescence microscopy showed a significant bifurcation of GFP-fluorescence: approximately 50% of the population fluoresced intensely whereas the rest of the population showed only background levels of fluorescence (Fig. 5D). This finding prompted us to use flow cytometry to quantify the ratio between tcpA-gfp(ASV)-expressing and non-expressing bacteria as a function of time after the addition of bicarbonate to an exponentially-growing culture (Fig. 6C). Expression of tcpA-gfp(ASV) was significantly induced in all cells 30 minutes after the addition of bicarbonate to an early exponential phase culture (OD600 ∼0.2). Growth of the culture to an OD600 of approximately 0.9, ninety minutes after the addition of bicarbonate, was associated with bifurcation of tcpA-gfp(ASV) expression. This time point corresponds to transition of the culture into stationary phase (Fig. 6B). Serial flow cytometry measurements of the same culture showed progressive bifurcation over time (Fig. 6C) as the culture progressed into early stationary phase. Examination of the flow cytometry data showed that the bifurcation phenotype came from continued high-level expression of tcpA-gfp(ASV) by ∼50% of the population and declining tcpA-gfp(ASV) expression in the remaining 50%. Several hours after entry into stationary phase, all cells eventually down-regulated tcpA-gfp(ASV) expression (data not shown). The concentration of bicarbonate not only controlled the initial induction of tcpA-gfp(ASV) during exponential growth (Fig. 6A), but it also affected the distribution of the bifurcation phenotype during entry into stationary phase. Increasing concentrations of bicarbonate resulted in a greater fraction of induced cells in stationary phase (Fig. 6D). To test if the bifurcation phenotype was limited to the V. cholerae strain A1552, an identical tcpA-GFP(ASV) reporter strain was created in V. cholerae N16961. This strain also exhibited significant heterogeneity in the expression of the tcpA-gfp(ASV) after addition of bicarbonate and progression into stationary phase (data not shown).
Bifurcation of tcpA-gfp(ASV) expression is accompanied by bifurcation of ctxA and toxT expression
To further investigate the segregation of tcpA-gfp(ASV) expression into two populations during entry into stationary phase, V. cholerae tcpA-gfp(ASV) was induced with bicarbonate at OD600 = 0.2 and grown to early stationary phase until the bifurcation phenotype was observed. Then, the bacteria were fixed with paraformaldehyde and sorted by fluorescence intensity using a fluorescence activated cell sorter (FACS). Cells that continued to produce GFP(ASV) from the tcpA promoter and cells that were GFP(ASV)-negative were collected as two separate populations. RT-PCR was performed to measure the abundance of the tcpA transcript in each of the two populations. The RT-PCR assay employed primers and probes corresponding to regions of the native tcpA gene in VPI-1; these regions were not present in the tcpA-gfp(ASV) construct. In this way, the expression of wild type tcpA could be monitored (by RT-PCR) in parallel with the expression of tcpA-gfp(ASV) (by flow cytometry). To determine if the expression of the genes encoding CT, which is co-regulated with tcpA, also segregate into the same two populations, ctxA mRNA abundance was also monitored. In addition, the RT-PCR multiplex assay employed primers and probes corresponding to three genes (cheA1-3) that are not regulated by ToxT and are located at three different sites on the genome, and six components of the ToxR regulatory network that governs the expression of the tcp and ctx operons [18]. These include: (1) ToxT, which binds and activates the tcpA and ctxAB promoters [46]; (2) AphA, AphB, ToxR and TcpP, which function at higher levels in the regulatory cascade and positively regulate the expression of tcpA-F and ctxAB [47], [48], [49]; and (3), HapR, which negatively controls tcpA and ctxAB expression as a function of population density [50]. When transcripts corresponding to these genes were measured, no significant differences were noted in the expression of cheA1-3, hapR, aphA, aphB or toxR in the two sorted populations (Fig. 6E). The gene encoding TcpP showed less than two-fold greater transcript abundance in the GFP-positive population when compared to GFP-negative cells. By contrast, the toxT transcript was six-fold more abundant in the GFP-positive cells. The accumulation of toxT mRNA in cells expressing the tcpA-gfp(ASV) reporter was associated with an 80-fold greater abundance of the tcpA transcript and a 20-fold greater abundance of the ctxA transcript in the GFP-positive population (Fig. 6E). Taken together, these data provide conclusive evidence that fluorescence from the tcpA-gfp(ASV) reporter can be used as a valid measure of tcpA expression, thus confirming that tcpA expression bifurcates into two populations. These data show that ctxA, long recognized to be co-regulated with tcpA [51] also exhibits the bifurcated phenotype. Thus, expression of the genes coding for the virulence determinants required for V. cholerae colonization (TCP) and virulence (CT) in humans exhibits the bifurcation phenotype. Finally, these data demonstrate bifurcation of toxT expression; thus toxT expression, like the ctxA and tcpA promoters it binds and activates, also segregates into two populations after induction with bicarbonate and progression into stationary phase. The difference in the expression of toxT between the two populations was lower than the difference seen for tcpA, which indicate that smaller changes in the expression of the transcriptional regulator may affect expression of tcpA and ctxAB significantly.
Bifurcation of tcpA-gfp(ASV) expression is a reversible and non-heritable phenotype
To test whether the observed bifurcation in tcpA expression was caused by the presence in the culture of two pre-existing expression variants, only one of which sustains tcpA-gfp(ASV) expression during entry into stationary phase, a culture was induced with bicarbonate during exponential growth and allowed to undergo bifurcation. The two subpopulations [sustained or transient expression of tcpA-gfp(ASV)] were then separated by FACS and inoculated onto separate agar plates. Single colonies grown from each of the two sorted populations were picked, grown to early exponential phase in separate shaken flasks and then treated with bicarbonate to induce tcpA-gfp(ASV) expression. Bacteria from each of the sorted populations were found to exhibit the same bifurcation phenotype as the non-sorted progenitor (Fig. S3). From these results we conclude the following. (1) The bifurcation phenotype is not the consequence of two pre-existing populations; rather, all members of the population appear able to exhibit the bifurcation phenotype. (2) Induction of the bifurcation phenotype does not generate variants durably assigned to one or the other of two populations; the bifurcation phenotype is reversible.
The tcpA-gfp(ASV) bifurcation phenotype exhibits hysteresis
To determine if the continued presence of bicarbonate is required to maintain the tcpA-gfp(ASV) bifurcation phenotype, bicarbonate was removed once the bicarbonate-treated culture had reached early stationary phase by washing and resuspending the bacteria in filter-sterilized conditioned media from cultures grown in parallel to the same OD without bicarbonate. Then, flow cytometry was used to compare the fraction of GFP-positive cells in the bicarbonate-depleted culture with the fraction in a bicarbonate-containing culture as a function of time. Fig. 6F shows that the proportion of GFP-positive cells in the bicarbonate-depleted and bicarbonate-containing cultures was equivalent for up to 150 minutes after removal of bicarbonate. Thus, while 100 mM bicarbonate is required to fully elicit the bifurcation phenotype, once established it can be sustained even after bicarbonate is removed. This cannot be explained by persistence of the GFP(ASV) protein in non-replicating cells since, if no more GFP(ASV) were produced, the 40 minute half-life of this reporter would have caused a much more rapid decline in the fraction of GFP-positive cells. Nor can it be explained by small numbers of GFP-positive cells that might persist because of low residual concentrations of bicarbonate since fewer than 5% of cells exhibit the bifurcation phenotype in cultures containing ≤10 mM bicarbonate (Fig. 6D). Instead, this result is more likely explained by intracellular factors that persist in bicarbonate-depleted cultures and that are responsible for sustaining tcpA expression in the fraction of cells that continue to be GFP-positive after progression into stationary phase. Although the mechanism by which bicarbonate enhances the activity of ToxT is not yet known [44], ToxT is active even in the absence of bicarbonate. It is therefore possible that the concentration of ToxT in the strongly induced population of bacteria is high enough to maintain the positive feedback induction of tcpA and toxT thus causing this sub-population to continue to express tcpA even after transfer of the culture to a bicarbonate-free medium. If so, then the duration of sustained tcpA expression would depend on how long cellular concentrations of ToxT remain above a critical threshold concentration. This kind of biochemical memory is characteristic of systems that exhibit hysteresis: the capacity to sustain an induced phenotype for a period of time after the responsible inducer has been removed or its concentration reduced below the level required to elicit the phenotype [52].
Bifurcation of tcpA expression is due to a bistable switch controlled by ToxT
Many of the features of the tcpA bifurcation phenotype described above are consistent with a variety of genetic, DNA modifying and epigenetic mechanisms by which a clonal population can generate, at high frequency and in a homogeneous environment, two or more subpopulations [1], [2]. These include genetic mechanisms giving rise to reversible switching between two states (phase variation), including site specific recombination, gene conversion and slipped-strand mispairing [1]. Also compatible with some aspects of the bifurcation phenotype is the reversible methylation of DNA at sites affecting gene expression [53]. In contrast to these mechanisms, bistability is an epigenetic process that does not entail rearrangement or chemical modification of DNA. Bistability provides a compelling explanation for the tcpA bifurcation phenotype because it typically results in two distinctive states, is reversible and demonstrates hysteresis [54], [55]. In addition to these properties bistable switches are typically controlled by auto-regulated, positive-feedback circuits that govern the expression of a master regulator and the genes it controls. The regulation of tcpA by ToxT is such a system: the tcpA promoter reads through to toxT thereby creating a positive feedback induction of toxT expression [32], [56] that not only drives tcpA expression, but also ctxAB expression [56]. This autocatalytic circuit is depicted in Fig. 2A.
Like other members of the AraC family of transcriptional regulators, ToxT has an N-terminal dimerization domain that is required for transcriptional activation of tcpA through binding of the two toxbox domains upstream of the tcpA promoter [46], [57]. Thus, in addition to the positive autoregulation of toxT described above, the dimerization of ToxT also may be important in the generation of bistability since it could render activation of the tcpA-promoter hypersensitive to the concentration of ToxT. This is supported by experiments using virstatin which blocks ToxT dimerization [58], [59]. Under in vitro inducing conditions, virstatin reduces the expression of tcpA to a few percent of normal levels, thus reinforcing other findings that ToxT is essential for activation of the tcpA promoter and must dimerize to exert its effect.
The ToxT autocatalytic regulatory circuit and the ∼6-fold greater abundance of toxT transcripts in GFP(ASV)-positive compared to GFP(ASV)-negative sorted cells (Fig. 6E), led us to test if the bifurcation phenotype depends on the positive autoinduction of toxT expression through the tcpA promoter (Fig. 2A). We modified the genetic background of the tcpA-gfp(ASV) reporter strain by deleting the indigenous tcpA-promoter in VPI-1 thus interrupting the positive feedback loop. The tcpA-gfp(ASV) reporter, which is located at an ectopic site on the same chromosome, was left intact (Fig. 2A). The tcpA promoter deletion version of the tcpA-gfp(ASV) reporter strain was then monitored for fluorescence intensity during induction with bicarbonate. Since the tcpA-gfp(ASV) reporter is inserted at a different locus (Fig. 2A), it continues to report the effect of ToxT on the ectopic tcpA promoter, but without the effect of the autocatalytic circuit. As illustrated in Fig. 7B, initial induction of the tcpA-gfp(ASV) reporter was still observed in the tcpA-promoter deletion mutant 30 minutes after addition of bicarbonate to a mid exponential culture. However, in contrast to the wild type reporter strain (Fig. 7A), all cells of the tcpA promoter mutant showed unimodal decreased expression of the tcpA-gfp(ASV) reporter during entry into stationary phase three hours post induction (Fig. 7B). Deletion of the tcpA-promoter therefore completely prevented bifurcation of tcpA-gfp(ASV) expression. Thus, in the absence of the indigenous tcpA promoter, ToxT is still capable of responding to bicarbonate induction through its own promoter during exponential phase growth and to induce expression of tcpA-gfp(ASV) at an ectopic site, but the tcpA promoter mutant has lost the capacity to sustain expression of tcpA in a fraction of the cells during entry into stationary phase. Therefore, bifurcation of the tcpA-gfp(ASV)-expressing phenotype appears to depend on positive feedback induction of toxT through the tcpA promoter. Examination of the flow cytometry data in Fig. 7A and B shows that the average level of tcpA-gfp(ASV) expression in the bicarbonate-induced tcpA-promoter deletion mutant is 20% lower when compared to the average level of expression of the tcpA-gfp(ASV) reporter in the wild type background. This result suggests that autocatalytic control of toxT expression may be required to increase ToxT concentrations above a critical threshold necessary to sustain tcpA-gfp(ASV) expression by a fraction of bicarbonate-induced bacteria during entry into stationary phase.

CRP-cAMP is part of the bistable switch controlling tcpA expression
The initial expression of tcpA in response to bicarbonate during exponential growth results in a unimodal population of induced bacteria; bifurcation of the induced population into the two tcpA-expressing populations, depicted in Fig. 6C and 7A, was only observed during entry into stationary phase. This observation indicates that the tcpA bistable phenotype not only comes from positive auto-regulation of ToxT production, but also from other factors that are able to repress tcpA expression in a fraction of induced cells during entry into stationary phase. We reasoned that one such factor might be cAMP and the catabolite regulatory protein CRP with which it interacts. The CRP-cAMP complex is part of a global regulatory network that controls gene expression in response to the availability of carbon and energy sources in the environment. The effects of cAMP on gene expression are caused by an allosteric modification of CRP that occurs when cAMP binds CRP and the CRP-cAMP complex interacts with upstream promoter motifs. Depending on the position of the CRP-cAMP motif relative to other sites on the promoter, transcription of downstream genes is either increased or decreased (for a review, see [60]). CRP-cAMP has been shown to decrease the expression of ctxAB and tcpA [61]. This effect has been attributed to proven or hypothesized affects at three separate sites in the regulatory cascade that controls ctx and tcp expression. First, CRP-cAMP increases the expression of HapR, a repressor of the regulatory cascade [62]–[63]. Second, CRP-cAMP directly competes with the positive regulators AphA and AphB on the tcpPH promoter [64]; this acts to reduce the expression of TcpP and TcpH which, together with ToxR and ToxS, activate toxT gene expression (Fig. 2A) [49], [65]. Third, a putative CRP-cAMP binding site has been identified at the −35 domain (−50 to −29) of the tcpA promoter [66], [67] that overlaps the ToxT binding site (−59 to −41) [32]. Therefore, occupation of this site by CRP-cAMP could potentially compete with dimeric ToxT and consequently with the positive autoregulation of toxT. Thus at each of the three sites, CRP-cAMP would decrease the expression of toxT and the ToxT-dependent genes, tcpA-F and ctxAB.
To test the hypothesis that CRP-cAMP is required for the tcpA bistable phenotype, we constructed a crp deletion mutant in the tcpA-gfp(ASV) reporter strain. Results from flow cytometry studies of the tcpA-gfp(ASV) Δcrp reporter before the addition of bicarbonate, and then 30 minutes and 3 hours after addition of bicarbonate to an exponential phase culture are depicted in Fig. 7C. Expression of tcpA-gfp(ASV) by the wild type parent and the crp mutant was similar 30 minutes after addition of bicarbonate to log phase cultures (Fig. 7A and C): both showed an unimodel induced population. By contrast to tcpA-gfp(ASV) expression in the wild type parent (Fig. 7A), all cells of the crp mutant remained strongly induced 4 hours after bicarbonate induction as the cells entered stationary phase (Fig. 7C). Moreover, at this time point, the average fluorescence intensity of the crp mutant (7×101 FL-1 FITC) was 350% greater than the average intensity of the induced fraction of the wild type population (2×101 FL1-H FITC). This shows that CRP plays an important role in repressing virulence gene expression and that it is required for generation of the tcpA bistable phenotype. These results also demonstrate that CRP mainly acts as a repressor of tcpA expression during entry into stationary phase, since the crp mutant showed near normal levels of tcpA expression during exponential phase growth when compared to the wild type parent. To further test the role of CRP-cAMP in the bistable phenotype, we studied a mutant deficient in the production of adenylate cyclase (cyaA), an enzyme responsible for the synthesis of cAMP. As predicted by the requirement of cAMP for activation of CRP, results from flow cytometry studies of tcpA-gfp(ASV) expression by the cyaA mutant were identical to the crp mutant (data not shown).
To correlate the results from the crp and cyaA mutants with levels of cAMP during exponential growth and stationary phase, cAMP concentrations in the cytosol were measured during growth in LB medium. The concentration of cAMP was found to increase ∼2.5 fold between mid exponential phase and early stationary phase (OD600 = 0.9) where the bifurcation phenotype is first observed (Fig. S4). These findings are compatible with the results of previous studies with other species showing that the concentration of cAMP increases during nutrient limiting conditions of growth (for a review, see [68]). Taken together, these results suggest that the growth-phase dependency of the tcpA bistable phenotype could be due to increasing concentrations of the CRP-cAMP complex during entry into stationary phase and competition between this complex and dimeric ToxT on the tcpA promoter. If so, then within the population of bicarbonate-induced cells, those bacteria with higher concentrations of ToxT would be able to sustain tcpA expression during progression into stationary phase whereas tcpA expression would decline in cells with lower concentrations of ToxT. Because the concentration of cAMP in each cell determines the activity of CRP and thus its capacity to compete with ToxT on the tcpA promoter, it is possible that the observed bifurcation in tcpA expression could be caused by different cAMP levels in the two populations. However, CRP-cAMP is known to induce the expression of hapR, and since the expression of hapR was not different between the induced and repressed populations when investigated by RT-PCR (Fig. 6E), the bifurcation in tcpA expression is not likely a result of difference in cAMP levels between the two populations.
CRP-cAMP has been shown to increase the expression of rpoS and hapR, both of which down regulate the expression of the tcp and ctx operons [63]. To investigate the effect of HapR on the bistable phenotype, flow cytometry studies of an hapR mutant were carried out after induction of an exponential phase culture with bicarbonate. In contrast to the crp mutation, deletion of hapR did not completely abolish bistability, but rather increased the proportion of cells that continue to express tcpA-gfp(ASV) during progression into stationary phase (Fig. S5). A similar phenotype was observed for the V. cholerae N16961 strain, which is defective in HapR (data not shown). Thus, the role of CRP-cAMP on bistability is not principally mediated through its regulation of hapR, but rather likely comes from the effects of CRP-cAMP at other sites in the regulatory cascade. As discussed above, one such site, predicted by the presence of a CRP promoter recognition motif, is the tcpA promoter [66], [67] (see Fig. S5 for more details).
Expression of tcpA is controlled by a bistable switch in vivo
The in vitro studies reported above demonstrate that tcpA expression bifurcates into two populations in a growth phase dependent manner and that this phenotype is controlled by a bistable switch that is governed by ToxT and by the CRP-cAMP complex. To determine if a bistable switch also segregates tcpA expression into two populations in vivo, we used single cell expression profiling to study tcpA expression by bacteria in the fluid that collects in the lumen of V. cholerae-infected ligated ileal loops. These fluids were used to address the following questions: (1) does luminal fluid contain a population of tcpA-expressing and a population of tcpA-non-expressing bacteria; (2) is the adoption of these two phenotypes a random and reversible process; (3) do tcpA-expressing bacteria in luminal fluid continue to express tcpA after they are transferred from luminal fluid to a medium that does not contain an inducer of tcpA expression; and (4), does disruption of crp abolish the bistable phenotype, yielding a unimodal, tcpA-expressing population of bacteria in the loop lumen. In addition, we sought to determine if the tcpA-expressing population of bacteria in luminal fluid coalesce into aggregates compared to the tcpA-non-expressing population.
Twelve hours post inoculation, ileal loop fluid samples containing the V. cholerae tcpA-gfp(ASV) reporter strain were examined by fluorescence microscopy and the ratio of tcpA-expressing to tcpA-non-expressing bacteria determined. Striking heterogeneity in the expression of tcpA was observed as shown in Fig. 8A–C, where approximately 10% of the individual bacteria produced high levels of the tcpA-gfp(ASV) reporter. Similar heterogeneity was observed in 10–20 micrographs from several ileal loops from two individual rabbits. Thus, tcpA expression bifurcates into two populations in vivo in a manner resembling the bifurcation phenotype revealed by the in vitro experiments depicted in Fig. 5–7. In vitro experiments had also shown that appearance of the bistable phenotype during entry into stationary phase could be explained by positive feedback induction by ToxT acting on the tcpA promoter and down regulation by CRP-cAMP. To determine if crp and the tcpA promoter affect the bistable phenotype in vivo as demonstrated by the in vitro studies reported above, we monitored tcpA-gfp(ASV) expression by the crp and tcpA promoter deletion mutants in ileal loop luminal fluid. As expected, none of the cells of the tcpA promoter deletion mutant were observed to express tcpA in the lumen 12 hours post inoculation (data not shown). By contrast, deletion of crp resulted in strong and homogeneous tcpA expression by all of the bacteria observed in the lumen (Fig. S6), corroborating the results from the in vitro experiments depicted in Fig. 7C.

To determine if the heterogeneous expression of tcpA in ileal loop fluid shown in Fig. 8 A–C is a reversible phenotype, ileal loop fluid containing the tcpA-gfp(ASV) reporter strain was obtained 12 hours post inoculation, plated onto rifampicin containing LB media. Twenty colonies were picked and individually tested in vitro for their ability to respond to bicarbonate by the induction of tcpA expression. No bacteria from the 20 tested colonies showed tcpA-gfp(ASV) expression during exponential growth in bicarbonate-free LB. With the addition of bicarbonate to the medium, tcpA-gfp(ASV) expression by all bacteria occurred; bifurcation of tcpA expression ensued during entry into stationary phase (data not shown).This parallels the in vitro findings depicted in Fig. S3. The bifid population of bacteria that had been isolated from luminal fluid were found to still exhibit the bifurcation phenotype after in vitro growth and re-induction of tcpA expression with bicarbonate. This observation is consistent with the idea that the bifurcation phenotype observed in vivo also is caused by a reversible epigenetic switch.
While most V. cholerae in luminal fluid were found as individual planktonic cells, dense aggregates of bacteria were also observed 12 hours post inoculation. Planktonic populations of individual bacteria were found to contain both tcpA-gfp(ASV)-expressing and non-expressing bacteria. By contrast, most bacteria in aggregates were found to strongly express the tcpA reporter; one such aggregate is depicted in Fig. 8 D–F. Some aggregates were associated with exfoliated epithelial cells; others appeared to consist entirely of V. cholerae. By contrast, no aggregates were found that were composed of bacteria not expressing the tcpA-gfp(ASV) reporter. Thus, while the planktonic population contains both tcpA-expressing and non-expressing bacteria, aggregates appear to be composed mainly of tcpA-expressing bactera.
To test if the expression of tcpA-gfp(ASV) by some bacteria in luminal fluid was dependent on the continued presence of a chemical inducer, an aliquot of luminal fluid, obtained 12 hour post inoculation, was diluted 10-fold in artificial seawater. This sample together with undiluted luminal fluid was incubated at 30°C for up to four hours and the two samples then assessed by fluorescence microscopy and compared to images of a sample of the same fluid examined immediately after incision of the loop (Fig. 8). Significantly fewer of the single cells in luminal fluid and in artificial seawater showed strong fluorescence from the tcpA-gfp(ASV) reporter after four hours of incubation. By contrast, aggregates of bacteria continued to show very strong expression of tcpA (Fig. 8G–I). Since any potential inducer of tcpA expression that is present in the luminal fluid would be diluted significantly by addition of artificial seawater, these results indicate that the bacteria in the clumps continue to express tcpA for a period of time even in the absence of inducer, a finding that is consistent with the hysteresis phenomenon of bistable switches.
Taken together, these results indicate that the mechanism controlling the bifurcation of tcpA expression in vitro is also responsible for causing heterogeneous expression of tcpA during infection of the small intestine. The presence of clumps of V. cholerae expressing high levels of tcpA, and the prolonged expression tcpA in aggregates in luminal fluid and in artificial seawater may ensure the sustained expression of this virulence determinant in recently passed rice water stools.
Discussion
This study was undertaken with the idea that a purely deterministic gene expression model would explain how the anatomical site and time course of infection governs the expression of V. cholerae virulence genes. Microarray expression profiling of V. cholerae collected from two distinct compartments of the intestine seemed to confirm this model (Fig. 1). Genes encoding CT, the TCP assembly apparatus and the principal subunit of the TCP filament (tcpA) were powerfully up-regulated by bacteria on the epithelial surface or in the overlying mucus compared to their expression in fluid secreted into the lumen of the same ileal loop. Further, their expression was greater early in the time course before the mucosal escape response reduced the average expression magnitude of these genes [10]. To more precisely localize tcpA expression and growth in the intestine, single cell gene expression analysis was performed using confocal microscopy and two reporters: tcpA-gfp(ASV) to monitor tcpA expression; and, rrnBP1-gfp(ASV) as a measure of growth. The magnitude of tcpA expression and the rate of growth as determined by fluorescence from the rrnBP1 reporter varied directly as a function of a bacterium's proximity to the nearest epithelial surface (Fig. 2 and 4).
The recently published crystal structure of ToxT showed that the binding of a fatty acid to the ToxT protein inactivates its transcriptional function [69]. It was speculated that the relative absence of this fatty acid in the mucus compared to the luminal fluid may prime ToxT for induction of tcpA and ctxAB. Breakage of flagella during penetration through the mucus has also been hypothesized to serve as a signal for V. cholerae to maximize virulence gene expression in the presence of the right inducers [70]. A possible chemical inducer of virulence gene expression in the intestine is bicarbonate, which is actively secreted by the mucosal epithelia in the ileum [71], the primary site of V. cholerae colonization in the small intestine. Bicarbonate has been demonstrated to induce tcpA-F and ctxAB expression in vitro through the activation of ToxT [44].
Virulence gene expression and growth mainly co-localized to the mucosal surface. While the mechanism of these mucosal-associated affects was not explored here, we are intrigued by the possibility that the secretion of V. cholerae virulence-associated proteins by bacteria adjacent to mucus membranes might liberate nutrients from the host. Of particular interest are: CT; the haemagglutinin (HA)/protease of V. cholerae encoded by hap; and V. cholerae cytotoxins. In addition to its function as a secretory enterotoxin, CT also triggers the release of mucin from goblet cells in villus and crypt epithelia [72]. hap, which encodes the mucin degrading enzyme (HA)/protease, was found in our study to be 2.3-fold more strongly expressed in the mucus/epithelial surface compartment eight hours post inoculation than by mid log phase bacteria (data not shown). Thus, based on these site specific gene expression results, it is possible that CT-mediated mucus release and the degradation of mucus by (HA)/protease both occur in the mucus/epithelial compartment and that the hydrolytic products of mucin degradation provide growth promoting nutrients for V. cholerae. Two V. cholerae cytotoxins were also expressed in the mucus/epithelial cell compartment. hlyA, which encodes haemolysin A, a pore forming toxin that causes cell lysis, was expressed 2.5-, 4.3 - and 7.4-fold more strongly in the mucus/epithelial cell compartment than by the mid log phase reference 4, 8 and 12 hours post inoculation (data not shown). Similarly, hlx, which encodes a hemolysin, was found to be expressed 3.6-, 3.2 - and 3.0-fold more strongly in the mucus/epithelial cell compartment than by the mid log phase reference 4, 8 and 12 hour post-inoculation (data not shown). These cytolytic proteins could release intracellular growth promoting nutrients, including iron, from host cells; this effect might explain why islands of growing V. cholerae are found near extruded epithelial cells (Fig. S2).
Review of confocal images of V. cholerae tcpA-gfp(ASV) in ileal loops indicated that a deterministic gene expression model could not explain all the results of the single cell expression study: in some locations on mucus membranes individual adjacent bacteria appear to produce dramatically different amounts of the TcpA-GFP(ASV) reporter (Fig. 5A). Similar heterogeneity in the expression of tcpA was also observed in bacteria present in the luminal fluid 12 hours post inoculation (Fig. 8). By contrast, little variation between adjacent bacteria was seen in fluorescence emitted by the rrnBP1-gfp reporter (data not shown).
Because the irregular physical features of the intestinal environment made it difficult to confirm, quantify or systematically study the apparent cell-to-cell variation in tcpA expression we turned to in vitro studies. To exclude the possible effects of physical or chemical gradients we studied well-stirred homogenous cultures of V. cholerae tcpA-gfp(ASV) containing bicarbonate, an inducer of tcpA and ctxAB expression. When bicarbonate was added to early exponential phase LB broth cultures to a final concentration of 100 mM, all cells in the population were induced as a monomodal peak typical of a normally-distributed, cell-to-cell variance in gene expression (Fig. 6C and 7A). However, during transition into early stationary phase, the population bifurcated into two nearly equal fractions: in one fraction, tcpA-gfp(ASV) expression persisted undiminished for at least 4 hours whereas in the other fraction the average level of tcpA-gfp(ASV) expression declined to pre-induction levels. Studies using bicarbonate-induced cells sorted by FACS showed that the bifurcation phenotype was entirely reversible (Fig. S3). Thus, it is very likely not caused by durable genetic changes nor is it a manifestation of two pre-existing populations. Taken together, these results lead to a combined deterministic and probabilistic model of tcpA expression. It is deterministic in that it requires exposure to an inducer and is inducer concentration and growth phase dependent. It is probabilistic in that each cell in the pre-induced population has an equal chance to be in each of the two post-induction populations that characterize the bifurcation phenotype.
The toxin-coregulated pilus was so-named because its biosynthesis is governed by the same ToxR hierarchy of transcription factors that regulate the production of CT [73]. FACS and a multiplex RT-PCR assay were used to determine if other components of the ToxR regulon were expressed in a bifid manner by tcpA-gfp(ASV)-expressing and non-expressing cells from the same population. In addition to tcpA, ctxA was also found to exhibit the bifurcation phenotype. This result shows that genes encoding the main determinants of virulence in humans, CT and TCP, both exhibit the bifurcation phenotype. Moreover, significantly larger numbers of the toxT transcript are produced in the same population of sorted cells that also contains larger numbers of the tcpA and ctxA transcripts. This result mechanistically implicates ToxT as a key component of the tcpA/ctxA bifurcation phenotype.
Expression of toxT is positively autoregulated: ToxT dimerizes to activate the promoter of the tcpA-F operon; read-through to the next transcriptional unit activates the toxT promoter thus resulting in a positive feedback loop (Fig. 9) [56]. To determine if this feedback loop is required for the bifurcation phenotype, the indigenous tcpA promoter in VPI-1 was deleted in the reporter strain that carries the promoter-containing tcpA-gfp(ASV) construct in an ectopic location. Exposure of this mutant to bicarbonate during early exponential growth induced tcpA-gfp(ASV) expression, but abolished the bifurcation phenotype (Fig. 7B). Instead of segregating into two populations during progression into stationary phase, a monomodal peak of declining fluorescence occurred. This result supports the idea that tcpA expression (and by inference ctxAB expression as well) is governed by an autocatalyic process that renders it hypersensitive to the concentration of ToxT dimers in the cell.

This hypersensitivity comes in part from the stochasticity of the biochemical processes that underlie transcription and translation and which cause the concentration of a particular protein to vary, in a normally distributed manner, between individual cells [74]. The consequences of deleting the native tcpA promoter, depicted in Fig. 7B, show that the autoinduction of toxT very likely magnifies the cell-to-cell random variation in ToxT concentrations according to the following model. In cells with low ToxT monomer concentrations, few ToxT dimers form and a non-linear increase in ToxT production via the positive feedback loop does not occur. By contrast, in cells containing higher concentrations of ToxT monomers, ToxT dimer concentrations are correspondingly high. This favors an autocatalytic, non-linear increase in ToxT production resulting in yet higher concentrations of ToxT dimers. Cells with a high concentration of ToxT dimers are capable of sustaining tcpA expression after progression into stationary phase (Fig. 9). The autoinduction of toxT may also explain why cells continue to sustain tcpA expression after removal of the inducer (bicarbonate): the half-life of sustained tcpA expression is a function of the half-life of transcriptionally active ToxT dimers. These scenarios were not directly tested in the work presented here by measurements of ToxT monomers and dimers in each of the two populations. However, they are strongly supported by the demonstration that toxT transcript abundance is 6-fold greater in FACS-sorted cells that sustain tcpA expression compared to those that do not (Fig. 6E).
The molecular model provided above does not yet explain the growth phase dependency of the bifurcation phenotype. To address this question we showed that mutants with deletions of the CRP or adenylate cyclase coding sequences do not repress bicarbonate-induced tcpA-gfp(ASV) expression during entry into stationary phase (Fig. 7C). Thus, in addition to the ToxT positive feedback loop, the bifurcation phenotype requires CRP and adenylate cyclase. To integrate this observation with the tcpA-dependent toxT autcatalytic circuit discussed above and with previous work identifying predicted CRP-binding motifs in the tcpA promoter [61], we refine our model by introducing the role of nutrient limitation and its capacity to increase cAMP production (Fig. 9). We propose that V. cholerae encounters nutrient limitation during entry into stationary phase and during late stages of the infectious process. Consistent with this model is the effect of the adenylate cyclase mutation on the bifurcation phenotype, the increase in cAMP concentrations during entry into stationary phase (Fig. S4) and results from our previous work on the role of RpoS and the mucosal escape response [10]. The resulting increase in the intracellular concentrations of the CRP-cAMP complex would then suppress tcpA expression in the population of cells with lower average ToxT dimer concentrations. The autocatalytic nature of this transcriptional system, bifurcation of the population into two distinct tcpA-expressing populations and persistence of the bifid pattern after the removal of inducer are characteristic of an epigenetic mechanism that gives rise to a bistable switch.
During in vitro conditions, the bistable regulation of tcpA expression was found to involve positive feedback induction by ToxT acting through the tcpA promoter in conjunction with CRP-cAMP-mediated repression of tcpA expression. To test if the apparent heterogeneity in the expression of the tcpA-gfp(ASV) reporter on epithelial cell surfaces and in the overlying mucus layer (Fig. 5) was caused by the same mechanism, we used luminal fluids from freshly incised V. cholerae-infected ileal loops to monitor expression of the tcpA-gfp(ASV) reporter by the tcpA promoter and crp mutants. Three reasons led to our use of luminal fluids and the 12 hour post-inoculum time point to study the bistable control of tcpA expression in vivo: (1) this condition corresponds in time to the previously described mucosal escape response [10], when the average levels of tcpA and ctxAB expression decline; (2) the bacterial growth phase in luminal fluid at this time point, as determined by viable plate counts, correlates with entry into or early stationary phase [10], a time in the growth cycle of in vitro cultures when the population bifurcates into tcpA-expressing and tcpA-non-expressing subpopulations; and 3), expression of the tcpA-gfp(ASV) reporter by bacteria in luminal fluid is more easily studied compared to bacteria embedded in mucus or attached to epithelial surfaces. The tcpA promoter mutant lacking positive feedback induction of toxT from the tcpA promoter showed homogeneous low-level fluorescence from the tcpA reporter fusion after 12 hours of infection. This result likely indicates low and homogeneous ToxT concentrations. As expected, the crp deletion mutant showed strong and homogeneous expression from the tcpA promoter in luminal fluid late in the infectious process (Fig. S6). The study of bacteria isolated from luminal fluid also showed that the heterogeneous expression of tcpA is reversible and thus not caused by durable genetic changes of the bacteria. In addition, the study of bacteria removed from the ileal loop demonstrated continued (≥ four hours) strong expression of tcpA, particularly by bacteria within aggregates, even after dilution of the luminal fluid into artificial seawater. This finding indicates that tcpA expression by bacteria removed from the ileal loop can be sustained by a fraction of the population for a period of time and thus is likely not dependent on the continued presence of a chemical inducer (Fig 8G–I). Taken together these results provide compelling evidence that the mechanisms responsible for the bistable regulation of virulence gene expression, documented and studied by in vitro experiments, is also responsible for bifurcation of the tcpA-expressing population in ileal loops.
Other bacterial systems that employ a bistable switch to generate heterogeneity in the bacterial population include a positive feedback loop that controls the expression of a toxin (hipA) and an antitoxin (hipB) in E. coli. This system generates slow or non-growing persister cells with increased antibiotic resistance [75], [76]. Genetic competence in Bacillus subtilis is regulated by a positive feedback loop partly controlled by quorum sensing [77], [78]. In this system, the master regulator ComK, which controls expression of DNA transport genes, binds its own promoter in a dimerized form. Similar to the role of dimeric ToxT described in this report, the combination of a positive feedback loop and dimerization of the transcription factor causes the expression of B. subtilis competence genes to be hypersensitive to changes in the concentration of ComK. As a consequence, only a fraction of the cells becomes competent for natural transformation. Sporulation in B. subtilis is also controlled by a positive feedback loop acting on Spo0A, which results in a subpopulation of cells that sporulate during entry into stationary phase [79][80], [81]. Likewise, the expression of genes involved in B. subtilis biofilm formation are subject to bistable expression through regulation by Spo0A [82]. However, to our knowledge, the heterogeneous expression of tcpA and ctxAB in V. cholerae presented here is the first example of bistable regulation of a major virulence pathway in a pathogenic organism.
In the present study, the rabbit ileal loop model was chosen since it is a well established model of V. cholerae infection [7]. Unlike the murine model system, infection of the rabbit ileal loop with V. cholerae leads to a diarrheal response mimicking the one observed in humans [9], [83]. A potential disadvantage of the rabbit model system is the closed nature of the loops that potentially could offset the timing and extent of the observed phenomenon late during the infection. In a landmark study, Lee et al. used a recombinase-based reporter system to demonstrate that 95% of V. cholerae bacteria isolated from the intestine of an infant mouse model of cholera expressed tcpA during the initial stages of the infection [5]. In the present study, only a subset of bacteria close to the epithelial surface was shown to express tcpA. Differences between the two model systems may explain these contradicting findings. However, perhaps a more likely explanation comes from differences in the reporter systems used. Activation of the recombinase reporter results in a permanent, non-reversible change that is monitored by plating and scoring bacteria isolated from the intestine. Thus, if a recombinase-linked promoter is activated at any time during the infectious process, bacteria harboring that reporter will be scored as positive even if the promoter is silenced at later time points. The recombinasae reporter thus provides a cumulative average of promoter activation events up to the sampling point. By contrast, the unstable (∼40 min half-life) GFP(ASV) reporter used here reports real time levels of promoter activity. Consequently, activation of the gfp(ASV) linked promoter early in the infectious process, followed by silencing of the promoter subsequently, will be scored negative in samples taken at later time points and evaluated by in situ confocal microscopy. Consequently, the recombinase reporter system would not have detected silencing of virulence gene expression by a fraction of the V. cholerae population during the mucosal escape response that occurs late in the infectious process [10]. When considered together, the results of Lee et al. [5] and those reported here suggest a very dynamic regulation of virulence determinants including their induced expression by most bacteria early in the time course and repressed expression of the same genes at later stages of the infectious process.
The bistable control of virulence gene expression could potentially contribute to the transmission of cholera. V. cholerae was found to exist in luminal fluid as individual planktonic bacteria and as bacterial aggregates (Fig. 8A–F). Heterogeneity of this kind has been observed by others in luminal fluid from the rabbit ileal loop model [24] and in patient stool samples [25] [23]. In the present study, bacterial aggregates were found to express high levels of tcpA, a finding that is consistent with the autoaggregating properties of TCP. It has been suggested that the enhanced infectivity of V. cholerae shed in human stools is due to the presence of clumps of cells that disperse in vivo, thereby providing a high infectious dose of the pathogen [23], [24]. Other studies have identified hyperinfectious individual bacteria in feces [22], [25], [26], [27]. Thus, the relative importance of aggregated versus individual bacteria as causes of the hyperinfectious state is at present unresolved. Nonetheless, it seems clear that V. cholerae remain hyperinfectious for at least 5 hours after passage from patients into an aquatic environment [27]. In the present study, continued expression of tcpA by bacteria in aggregates was observed even after dilution of luminal fluid into artificial seawater for at least four hours (Fig. 8G–I). This observation favors the view that sustained production of TCP by a sub-population of autoaggregating bacteria in feces accounts for the hyperinfectious, biofilm-like aggregates of V. cholerae passed in the rice water stools of cholera patients.
Materials and Methods
Ethics statement
All animal experiments were performed in accordance to NIH guidelines, the Animal Welfare Act, and US federal law. Such experiments were approved by Stanford University's Administrative Panel on Laboratory Animal Care (A-PLAC), which has been accredited by the Association of Assessment and Accreditation of Laboratory Animal Care International (AAALAC). All animals were housed in a centralized and AAALAC-accredited research animal facility that is fully staffed with trained husbandry, technical, and veterinary personnel.
Bacterial strains and media
A V. cholerae O1 stool isolate from a cholera patient was used for all experiments. The strain, supplied by the California State Department of Health, was acquired from discarded material and previously de-identified. The isolate is a smooth phase variant of strain A1552 (wild type, El Tor, Inaba and RifR). The construction and properties of the rpoS and hapR deletion mutants of the parental strain were previously described [10]. E. coli strain DH5 was used for standard DNA manipulation experiments, and the E. coli strain S17-1λ pir was used for conjugation with V. cholerae. Bacteria were grown in Luria Bertani (LB) broth with 0.5% NaCl at 37°C. When appropriate, 100 µg/ml ampicillin, 100 µg/ml rifampicin or 50 µg/ml gentamycin was added to the media. Induction of virulence gene expression and bistability of tcpA expression was studied during bacterial growth in AKI conditions [84] and in LB media supplemented with 100 mM NaHCO3.
Determination of cAMP concentration
Intracellular concentration of cAMP was determined using the Biotrak cAMP competitive enzyme-immunoassay system RPN225 (GE Healthcare, Piscataway, NJ) using the non-acetylated method according to the manufacturers instructions. Concentration of cAMP was normalized to the total protein concentration in the sample as determined by a standard Bradford assay [85].
Generation of deletion mutants
Non-polar deletions were generated essentially as described [86]. Crossover PCR was performed to amplify a fragment (with primers 1 and 4) that brings an upstream gene fragment (produced by PCR with primers 1 and 2) to a downstream gene fragment (produced by PCR with primers 3 and 4) thereby creating an in-frame deletion. The fragment was ligated into the sucrose-based counter selectable plasmid pGP704-Sac28 [10]. The plasmid was introduced into V. cholerae A1552 by biparental mating. Sucrose-based counter selection was done essentially as described [86]. Deletions were confirmed by PCR. Primers used for construction of mutants are listed in Table S1.
Construction of tcpA and rrnB reporter strains
The BglI fragment from pBK-mini-Tn7-eyfp-a [87], [88] containing a mini-Tn7 was cloned into pGP704 [89] between the EcoRI and SalI sites. A NotI fragment internal to the Tn7 was removed and a SacI site outside of the transposon was destroyed by blunting and religating. The NotI fragment from Tn5-rrnBP1-gfp(ASV) vector pSM1695 [34], which encodes the promoter fragment containing nucleotides −70 to +3 relative to the transcription initiation site and the sequence encoding a destabilized GFP [designated GFP(ASV)], was cloned into the Tn7 NotI site of the Tn7 vector. For the tcpA reporter, the 192 nucleotides preceding the start codon in the tcpA promoter were amplified by PCR and inserted between SacI and SphI, immediately upstream of the gfp(ASV) ORF. These transposons were introduced into V. cholerae A1552 by triparental mating using helper plasmid pUX-BF13 (carrying the transposase genes) followed by selection on TCBS/gentamycin. Transposition into the chromosome was confirmed by PCR.
Measurement of GFP fluorescence from the rrnBP1-gfp(ASV) reporter strain
For fluorescence analysis of the rrnB-GFP reporter strain, the cells were grown in a total volume of 20 ml in a 100 ml shake flask in LB broth with strong agitation (250 rpm) at 37°C. Multiple samples were taken from mid-exponential phase and every half hour during transition into stationary phase. The bacteria were fixed in 2% paraformaldehyde in 100 mM phosphate buffer (pH 7.4) for 2 hours, washed twice in PBS buffer and analyzed by flow cytometry (FACSCaliber, BD biosciences, San Jose, CA). A total of 100, 000 bacteria were analyzed for each sample.
Analysis tcpA-gfp(ASV) bistable expression using flow cytometry
For fluorescence analysis of the tcpA-gfp(ASV) reporter strain, the cells were grown with strong agitation (250 rpm) at 37°C in a 100 ml shake flask containing 20 ml of LB broth supplemented with 50 mM HEPES buffer. Bicarbonate was used to induce tcpA expression by the tcpA-gfp(ASV) reporter strain. At an OD600 of 0.4, NaHCO3 from a freshly prepared 1.0 M NaHCO3 stock solution in LB was added to the medium to a final concentration of 100 mM. Samples were subsequently taken during exponential phase and during entry into stationary phase, at which time bistable expression of tcpA-gfp(ASV) was first evident. At each time point, bacteria were fixed in 2% paraformaldehyde in 100 mM phosphate buffer (pH 7.4) for 2 hours. Then, the cells were washed in PBS buffer twice before flow cytometry (FACS Caliber, BD biosciences, San Jose, CA). A total of 100,000 bacteria were analyzed for each sample.
Fluorescence activated cell sorting of V. cholerae that express tcpA-gfp(ASV)
Fluorescence activated cell sorting (FACS) was used to sort V. cholerae in order to separate and collect cells that either produced or suppressed fluorescence emission from the tcpA-gfp(ASV) reporter. A mid log phase culture was induced with 100 mM bicarbonate and grown for two hours at which time the bistable phenotype had developed during entry into stationary phase; bacteria were collected and placed on ice. A fluorescence activated cell sorter (BD Digital Advantage, BD Biosciences, San Jose, CA) was used to sort bacteria depending on their GFP fluorescence level. Forward light scatter was used as a second parameter to create a positive identification of bacteria in the solution. A total of 1,000,000 bacteria showing either high or low GFP fluorescence were collected.
For RT-PCR expression analysis, bacteria were induced with 100 mM bicarbonate and grown for approximately two hours until bistability was observed. Then, the bacteria were gently fixed with 0.5% paraformaldehyde in 100 mM phosphate buffer, pH 7.4 for 15 minutes. The fixed cells were washed three times with PBS buffer and placed on ice. A total of 1,600,000 bacteria showing either high or low levels of GFP fluorescence were collected using FACS. The cells were harvested by centrifugation and frozen on dry ice until RNA extraction. To extract RNA for RT-PCR analysis, the frozen cells were thawed, lysed with RLT buffer (Qiagen, Valencia, CA) and treated with proteinase K (Qiagen, Valencia, CA) for 10 minutes at 55°C in order to degrade protein cross linked to the RNA. RNA was isolated from the solution using an RNeasy kit (Qiagen, Valencia, CA) combined with DNaseI degradation of DNA (Applied Biosystems, Austin, TX).
Quantitative real-time RT-PCR
RNA from FACS-sorted bacteria was recovered as described above, and an equivalent of 20 ng of total RNA was used in a real-time RT-PCR reaction as previously described [89]. Validation and calibration experiments were performed for all TaqMan probe and primer sets and these showed the expected linear relationship between the cycle threshold, Ct, and the logarithm of the template amount, using genomic DNA as template. All probe-primer sets (Table S1) yielded a curve with the same slope demonstrating that the amplification efficiency of the various targets was similar (data not shown). To select an internal reference for normalization, we performed real-time RT-PCR with primer-probe sets for six house keeping genes with the cDNA samples from the different experiments. We then used the program GENORM to identify the most stably expressed control gene in these samples as previously described [89]. Relative expression levels in the different samples were calculated by using the comparative Ct method with VC1186 and VC2233 as internal controls. For quantitative real-time RT-PCR of samples isolated by fluorescence activated cell sorting, 15 cycles of pre-amplification were performed with the appropriate primers to ensure adequate signal due to the limited concentration of RNA in the samples.
Rabbit ileal loop model
All animal work was conducted according to national and international guidelines. The animal experimental protocol was reviewed and approved by the institutional animal care and use committee of Stanford University. Ileal loop preparation and inoculation was performed essentially as previously described [10].
Scanning confocal laser microscopy analysis of V. cholerae-infected rabbit ileal loops
GFP-labeled bacteria were grown overnight, diluted 100-fold in fresh LB broth and grown to an optical density of OD600 = 0.3. Bacteria were diluted tenfold to OD600 = 0.03 in PBS buffer and kept at room temperature until injected into ileal loops. After appropriate incubation, ileal loops used for scanning confocal microscopy were cut open and stretched gently onto cardboard discs. The tissue was allowed to adhere to the cardboard before it was gently submersed into 2% paraformaldehyde in 100 mM phosphate buffer pH 7.4 and allowed to fixate for two hours. The fixative was washed away in three subsequent washes with PBS buffer. Then, blocks of approximately 0.3 cm2 were excised and transferred to a 96 well microtiter plate. The tissue samples were then permeabilized and blocked in staining buffer (PBS with 1% saponin and 3% BSA) for one hour before overnight staining with a 2.5 µg/ml anti-Vibrio cholerae O1 IgG monoclonal mouse antibody (VCM-5261-5, Austral biologicals, San Ramon, CA) in staining buffer. Samples were washed gently three times in PBS buffer and subsequently stained for 5 hours with 20-fold diluted Alexa Fluor 660 phalloidin (A-22285, Molecular Probes) and 10 µg/ml goat anti-mouse Alexa Fluor 594 antibody (A11005, Molecular Probes) in staining buffer. After staining, samples were gently washed twice in PBS buffer and mounted for microscopy in Slowfade Light Antifade Kit (Molecular probes, Eugene, OR). Samples were imaged with a BioRad MRC1000 confocal microscope adjusted to identical settings for all images. The z-stacks were reconstructed onto z-projections using the Imaris-software (Bitplane, Zurich, Switzerland) and figures were assembled with Photoshop CS (Adobe, San Jose, CA). For quantification of GFP fluorescence as a function of distance to the nearest epithelial surface, the epithelial surfaces in stacks of images was first outlined in Photoshop CS. The Border function was used to select incremental layers of 5 µm distances from the epithelial surface. The fluorescence in the green (GFP) channel versus the red channel (V. cholerae fluorescent antibody) was quantified using the program Scion Image (Scion Corporation, Frederick, MA).
Fluorescence microscopy of V. cholerae in luminal fluid and artificial sea water
Luminal fluid was isolated 12 hours post inoculation of the rabbit ileal loop with the tcpA-GFP reporter strain. A sample of luminal fluid was immediately fixed in 2% paraformaldehyde in 100 mM phosphate buffer pH 7.4. Another part of the luminal fluid was incubated at 30°C while an aliquot was diluted 10-fold in defined artificial sea water (234 mM NaCl, 27.5 mM MgSO4, 1.5 mM NaHCO3, 4.95 mM CaCl2, 5.15 mM KCl, 0.07 mM Na2B4O7, 0.05 mM SrCl, 0.015 mM NaBr, 0.001 mM NaI, 0.013 mM LiCl, 18.7 mM NH4Cl, 0.187 mM K2HPO4, 50 mM HEPES, pH 7.4) and incubated at 30°C for up to four hours. Samples were isolated every hour and fixed in paraformaldehyde. Samples from the artificial seawater were harvested by gentle centrifugation and resuspension in a smaller volume of PBS buffer. For staining of V. cholerae, 20uL samples were spread out and allowed to dry on poly-L-lysine coated microscope slides and washed in 96% ethanol. Subsequently, the slides were washed in staining buffer (PBS with 1% saponin and 3% BSA) for 10 minutes before staining with a 2.5 µg/ml anti-Vibrio cholerae O1 IgG monoclonal mouse antibody (VCM-5261-5, Austral biologicals, San Ramon, CA) in staining buffer for 1 hour. The slides were washed three times with PBS buffer and subsequently stained for 30 minutes with 10 µg/ml goat anti-mouse Alexa Fluor 594 antibody (A11005, Molecular Probes) in staining buffer. The slides were then washed in PBS buffer and analyzed using fluorescence microscopy.
Microarray experiments
V. cholerae, grown to mid-exponential phase in vitro, were used as the source of “reference RNA” for the two-color hybridization microassay assay described below. For this purpose, bacteria were grown to OD600 = 0.3 in LB medium at 37°C; then, the bacteria were quickly centrifuged, the bacterial pellet resuspended in Trizol reagent (GIBCO/BRL) and the suspension frozen on dry ice. Transcriptional analysis of wild type V. cholerae isolated from the fluid that collects in rabbit ileal loops during infection was performed by quickly pelleting bacteria from the ileal loop fluid after eight and 12 hours of infection. The bacteria were then resuspended in Trizol reagent and frozen on dry ice. The mucus and cell-associated bacteria were isolated as a single fraction from ileal loops four, eight and 12 hours post inoculation by scraping the epithelial surface of the intestine with a disposable plastic cell scraper after the loops had been cut open and gently rinsed in PBS buffer to wash away remaining luminal fluid. The mucus gel/cell associated fraction was suspended in Trizol and frozen on dry ice. Total RNA, which includes RNA from the infecting bacteria and from the host (see below), was isolated from the thawed Trizol suspension, treated with DNaseI (Applied Biosystems, Austin, TX) and cleaned by using the RNeasy kit (Qiagen, Valencia, CA). To avoid microarray expression artifacts imparted by the presence of host RNA, RNA was prepared from a healthy rabbit and added to the V. cholerae reference RNA, isolated as described above from bacteria grown to mid exponential phase in LB broth. The amount of host RNA added to the V. cholerae reference RNA was determined as follows. RT-PCR analysis using Taq Man probe specific for V. cholerae 16S rRNA was used to estimate the amount of V. cholerae RNA in the total RNA fraction. This estimate was used to determine the amount of rabbit RNA that was added to the mid log phase reference V. cholerae RNA. The presence of contaminating host RNA in the mucus gel/epithelial RNA extract was further managed as follows. Primers specific for over 85% of the ORFs identified by the V. cholerae genome sequencing project were used to prime reverse transcriptase reactions in order to enrich for V. cholerae cDNAs prepared from the RNA extracted from the mucus gel/epithelial surface fraction. Labeling of cDNA and microarray hybridizations were performed as described [7]. cDNA from the mucus gel/epithelial cell fraction or luminal fluid fraction was labeled with Cy5 whereas cDNA prepared from mid exponential phase LB grown V. cholerae was labeled with Cy3. RNA from an exponentially growing LB culture was chosen as a reference since virulence gene expression and accumulation of virulence factors is not observed under these conditions. Microarrays were scanned with a GenePix 400A instrument (Axon Instruments), using the GENEPIX 5.0 software. To avoid fluctuations in intensity values from genes that are not expressed to a measurable level, we designated a minimum background level for each channel [89]. Statistically significant changes in gene expression were identified by conducting a one-class analysis using the Significance Analysis of Microarrays program [90] with a threshold of 2-fold change and a 0% false discovery rate for all samples. Raw microarray data are available in Tables S3, S4, S5, S6 and S7 and at http://smd.stanford.edu/.
Accession numbers
The TIGR-CMR genome database (http://cmr.tigr.org/tigr-scripts/CMR/GenomePage.cgi?database=gvc) accession numbers used in this paper are tcpA (VC0828), toxT (VC0838), tcpA-F (VC0828-37), ctxA (VC1457), ctxB (vc1456), crp (vc2614), toxR (vc0984), toxR (VC0984), rpoS (VC0534), aphA (VC1049), aphB (VC2647), tcpP (VC0826), hapR (VC0583), tcpH (VC0827), toxS (VC0983), cyaA (VC0122), hapA (VCA0865), hlyA (VCA00219), hlx (VCA0594), cheA1 (VC1397), cheA2 (VC02063), cheA3 (VCA1095) and rrnB (E. coli b3968).
Supporting Information
Zdroje
1. MoxonR
BaylissC
HoodD
2006 Bacterial contingency loci: the role of simple sequence DNA repeats in bacterial adaptation. Annu Rev Genet 40 307 333
2. DavidsonCJ
SuretteMG
2008 Individuality in bacteria. Annu Rev Genet 42 253 268
3. KaperJB
MorrisJGJr
LevineMM
1995 Cholera. Clin Microbiol Rev 8 48 86
4. KloseKE
2000 The suckling mouse model of cholera. Trends Microbiol 8 189 191
5. LeeSH
HavaDL
WaldorMK
CamilliA
1999 Regulation and temporal expression patterns of Vibrio cholerae virulence genes during infection. Cell 99 625 634
6. HouotL
ChangS
AbsalonC
WatnickPI
Vibrio cholerae phosphoenolpyruvate phosphotransferase system control of carbohydrate transport, biofilm formation, and colonization of the germfree mouse intestine. Infect Immun 78 1482 1494
7. DeSN
ChatterjeDN
1953 An experimental study of the mechanism of action of Vibrio cholerae on the intestinal mucous membrane. J Pathol Bacteriol 66 559 562
8. BurrowsW
MusteikisGM
1966 Cholera infection and toxin in the rabbit ileal loop. J Infect Dis 116 183 190
9. RitchieJM
WaldorMK
2009 Vibrio cholerae interactions with the gastrointestinal tract: lessons from animal studies. Curr Top Microbiol Immunol 337 37 59
10. NielsenAT
DolganovNA
OttoG
MillerMC
WuCY
2006 RpoS controls the Vibrio cholerae mucosal escape response. PLoS Pathog 2 e109
11. ColwellRR
1996 Global climate and infectious disease: the cholera paradigm. Science 274 2025 2031
12. NelsonEJ
HarrisJB
MorrisJGJr
CalderwoodSB
CamilliA
2009 Cholera transmission: the host, pathogen and bacteriophage dynamic. Nat Rev Microbiol 7 693 702
13. SchildS
TamayoR
NelsonEJ
QadriF
CalderwoodSB
2007 Genes induced late in infection increase fitness of Vibrio cholerae after release into the environment. Cell Host Microbe 2 264 277
14. HerringtonDA
HallRH
LosonskyG
MekalanosJJ
TaylorRK
1988 Toxin, toxin-coregulated pili, and the toxR regulon are essential for Vibrio cholerae pathogenesis in humans. J Exp Med 168 1487 1492
15. TaylorRK
MillerVL
FurlongDB
MekalanosJJ
1987 Use of phoA gene fusions to identify a pilus colonization factor coordinately regulated with cholera toxin. Proc Natl Acad Sci U S A 84 2833 2837
16. FinkelsteinRA
LoSpallutoJJ
1969 Pathogenesis of experimental cholera. Preparation and isolation of choleragen and choleragenoid. J Exp Med 130 185 202
17. MillerVL
MekalanosJJ
1984 Synthesis of cholera toxin is positively regulated at the transcriptional level by toxR. Proc Natl Acad Sci U S A 81 3471 3475
18. MatsonJS
WitheyJH
DiRitaVJ
2007 Regulatory networks controlling Vibrio cholerae virulence gene expression. Infect Immun 75 5542 5549
19. XuQ
DziejmanM
MekalanosJJ
2003 Determination of the transcriptome of Vibrio cholerae during intraintestinal growth and midexponential phase in vitro. Proc Natl Acad Sci U S A 100 1286 1291
20. LarocqueRC
HarrisJB
DziejmanM
LiX
KhanAI
2005 Transcriptional profiling of Vibrio cholerae recovered directly from patient specimens during early and late stages of human infection. Infect Immun 73 4488 4493
21. BinaJ
ZhuJ
DziejmanM
FaruqueS
CalderwoodS
2003 ToxR regulon of Vibrio cholerae and its expression in vibrios shed by cholera patients. Proc Natl Acad Sci U S A 100 2801 2806
22. MerrellDS
ButlerSM
QadriF
DolganovNA
AlamA
2002 Host-induced epidemic spread of the cholera bacterium. Nature 417 642 645
23. FaruqueSM
BiswasK
UddenSM
AhmadQS
SackDA
2006 Transmissibility of cholera: in vivo-formed biofilms and their relationship to infectivity and persistence in the environment. Proc Natl Acad Sci U S A 103 6350 6355
24. KamruzzamanM
UddenSM
CameronDE
CalderwoodSB
NairGB
Quorum-regulated biofilms enhance the development of conditionally viable, environmental Vibrio cholerae. Proc Natl Acad Sci U S A 107 1588 1593
25. NelsonEJ
ChowdhuryA
HarrisJB
BegumYA
ChowdhuryF
2007 Complexity of rice-water stool from patients with Vibrio cholerae plays a role in the transmission of infectious diarrhea. Proc Natl Acad Sci U S A 104 19091 19096
26. ButlerSM
NelsonEJ
ChowdhuryN
FaruqueSM
CalderwoodSB
2006 Cholera stool bacteria repress chemotaxis to increase infectivity. Mol Microbiol 60 417 426
27. NelsonEJ
ChowdhuryA
FlynnJ
SchildS
BourassaL
2008 Transmission of Vibrio cholerae is antagonized by lytic phage and entry into the aquatic environment. PLoS Pathog 4 e1000187
28. AlamA
LarocqueRC
HarrisJB
VanderspurtC
RyanET
2005 Hyperinfectivity of human-passaged Vibrio cholerae can be modeled by growth in the infant mouse. Infect Immun 73 6674 6679
29. KirnTJ
TaylorRK
2005 TcpF is a soluble colonization factor and protective antigen secreted by El Tor and classical O1 and O139 Vibrio cholerae serogroups. Infect Immun 73 4461 4470
30. HigginsDE
NazarenoE
DiRitaVJ
1992 The virulence gene activator ToxT from Vibrio cholerae is a member of the AraC family of transcriptional activators. J Bacteriol 174 6974 6980
31. YuRR
DiRitaVJ
2002 Regulation of gene expression in Vibrio cholerae by ToxT involves both antirepression and RNA polymerase stimulation. Mol Microbiol 43 119 134
32. HulbertRR
TaylorRK
2002 Mechanism of ToxT-dependent transcriptional activation at the Vibrio cholerae tcpA promoter. J Bacteriol 184 5533 5544
33. AndersenJB
SternbergC
PoulsenLK
BjornSP
GivskovM
1998 New unstable variants of green fluorescent protein for studies of transient gene expression in bacteria. Appl Environ Microbiol 64 2240 2246
34. SternbergC
ChristensenBB
JohansenT
Toftgaard NielsenA
AndersenJB
1999 Distribution of bacterial growth activity in flow-chamber biofilms. Appl Environ Microbiol 65 4108 4117
35. NielsenAT
Tolker-NielsenT
BarkenKB
MolinS
2000 Role of commensal relationships on the spatial structure of a surface-attached microbial consortium. Environ Microbiol 2 59 68
36. IwanagaM
YamamotoK
HigaN
IchinoseY
NakasoneN
1986 Culture conditions for stimulating cholera toxin production by Vibrio cholerae O1 El Tor. Microbiol Immunol 30 1075 1083
37. MedranoAI
DiRitaVJ
CastilloG
SanchezJ
1999 Transient transcriptional activation of the Vibrio cholerae El Tor virulence regulator toxT in response to culture conditions. Infect Immun 67 2178 2183
38. ChiangSL
TaylorRK
KoomeyM
MekalanosJJ
1995 Single amino acid substitutions in the N-terminus of Vibrio cholerae TcpA affect colonization, autoagglutination, and serum resistance. Mol Microbiol 17 1133 1142
39. KirnTJ
LaffertyMJ
SandoeCM
TaylorRK
2000 Delineation of pilin domains required for bacterial association into microcolonies and intestinal colonization by Vibrio cholerae. Mol Microbiol 35 896 910
40. SchaechterM
MaaloeO
KjeldgaardNO
1958 Dependency on medium and temperature of cell size and chemical composition during balanced grown of Salmonella typhimurium. J Gen Microbiol 19 592 606
41. DennisPP
BremerH
1974 Differential rate of ribosomal protein synthesis in Escherichia coli B/r. J Mol Biol 84 407 422
42. ZhangX
DennisP
EhrenbergM
BremerH
2002 Kinetic properties of rrn promoters in Escherichia coli. Biochimie 84 981 996
43. BartlettMS
GourseRL
1994 Growth rate-dependent control of the rrnB P1 core promoter in Escherichia coli. J Bacteriol 176 5560 5564
44. AbuaitaBH
WitheyJH
2009 Bicarbonate Induces Vibrio cholerae virulence gene expression by enhancing ToxT activity. Infect Immun 77 4111 4120
45. FordtranJS
LocklearTW
1966 Ionic constituents and osmolality of gastric and small-intestinal fluids after eating. Am J Dig Dis 11 503 521
46. WitheyJH
DiRitaVJ
2006 The toxbox: specific DNA sequence requirements for activation of Vibrio cholerae virulence genes by ToxT. Mol Microbiol 59 1779 1789
47. KovacikovaG
SkorupskiK
1999 A Vibrio cholerae LysR homolog, AphB, cooperates with AphA at the tcpPH promoter to activate expression of the ToxR virulence cascade. J Bacteriol 181 4250 4256
48. DiRitaVJ
ParsotC
JanderG
MekalanosJJ
1991 Regulatory cascade controls virulence in Vibrio cholerae. Proc Natl Acad Sci U S A 88 5403 5407
49. HaseCC
MekalanosJJ
1998 TcpP protein is a positive regulator of virulence gene expression in Vibrio cholerae. Proc Natl Acad Sci U S A 95 730 734
50. KovacikovaG
SkorupskiK
2002 Regulation of virulence gene expression in Vibrio cholerae by quorum sensing: HapR functions at the aphA promoter. Mol Microbiol 46 1135 1147
51. MillerVL
TaylorRK
MekalanosJJ
1987 Cholera toxin transcriptional activator toxR is a transmembrane DNA binding protein. Cell 48 271 279
52. FerrellJEJr
2002 Self-perpetuating states in signal transduction: positive feedback, double-negative feedback and bistability. Curr Opin Cell Biol 14 140 148
53. TotsikaM
BeatsonSA
HoldenN
GallyDL
2008 Regulatory interplay between pap operons in uropathogenic Escherichia coli. Mol Microbiol 67 996 1011
54. VeeningJW
SmitsWK
KuipersOP
2008 Bistability, epigenetics, and bet-hedging in bacteria. Annu Rev Microbiol 62 193 210
55. DubnauD
LosickR
2006 Bistability in bacteria. Mol Microbiol 61 564 572
56. YuRR
DiRitaVJ
1999 Analysis of an autoregulatory loop controlling ToxT, cholera toxin, and toxin-coregulated pilus production in Vibrio cholerae. J Bacteriol 181 2584 2592
57. ProutyMG
OsorioCR
KloseKE
2005 Characterization of functional domains of the Vibrio cholerae virulence regulator ToxT. Mol Microbiol 58 1143 1156
58. HungDT
ShakhnovichEA
PiersonE
MekalanosJJ
2005 Small-molecule inhibitor of Vibrio cholerae virulence and intestinal colonization. Science 310 670 674
59. ShakhnovichEA
HungDT
PiersonE
LeeK
MekalanosJJ
2007 Virstatin inhibits dimerization of the transcriptional activator ToxT. Proc Natl Acad Sci U S A 104 2372 2377
60. GorkeB
StulkeJ
2008 Carbon catabolite repression in bacteria: many ways to make the most out of nutrients. Nat Rev Microbiol 6 613 624
61. SkorupskiK
TaylorRK
1997 Cyclic AMP and its receptor protein negatively regulate the coordinate expression of cholera toxin and toxin-coregulated pilus in Vibrio cholerae. Proc Natl Acad Sci U S A 94 265 270
62. SilvaAJ
BenitezJA
2004 Transcriptional regulation of Vibrio cholerae hemagglutinin/protease by the cyclic AMP receptor protein and RpoS. J Bacteriol 186 6374 6382
63. LiangW
Pascual-MontanoA
SilvaAJ
BenitezJA
2007 The cyclic AMP receptor protein modulates quorum sensing, motility and multiple genes that affect intestinal colonization in Vibrio cholerae. Microbiology 153 2964 2975
64. KovacikovaG
SkorupskiK
2001 Overlapping binding sites for the virulence gene regulators AphA, AphB and cAMP-CRP at the Vibrio cholerae tcpPH promoter. Mol Microbiol 41 393 407
65. KrukonisES
YuRR
DiritaVJ
2000 The Vibrio cholerae ToxR/TcpP/ToxT virulence cascade: distinct roles for two membrane-localized transcriptional activators on a single promoter. Mol Microbiol 38 67 84
66. OgiermanMA
VossE
MeaneyC
FaastR
AttridgeSR
1996 Comparison of the promoter proximal regions of the toxin-co-regulated tcp gene cluster in classical and El Tor strains of Vibrio cholerae O1. Gene 170 9 16
67. ThomasS
WilliamsSG
ManningPA
1995 Regulation of tcp genes in classical and El Tor strains of Vibrio cholerae O1. Gene 166 43 48
68. PostmaPW
LengelerJW
JacobsonGR
1993 Phosphoenolpyruvate:carbohydrate phosphotransferase systems of bacteria. Microbiol Rev 57 543 594
69. LowdenMJ
SkorupskiK
PellegriniM
ChiorazzoMG
TaylorRK
2010 Structure of Vibrio cholerae ToxT reveals a mechanism for fatty acid regulation of virulence genes. Proc Natl Acad Sci U S A 107 2860 2865
70. LiuZ
MiyashiroT
TsouA
HsiaoA
GoulianM
2008 Mucosal penetration primes Vibrio cholerae for host colonization by repressing quorum sensing. Proc Natl Acad Sci U S A 105 9769 9774
71. DietzJ
FieldM
1973 Ion transport in rabbit ileal mucosa. IV. Bicarbonate secretion. Am J Physiol 225 858 861
72. ForstnerJF
RoomiNW
FahimRE
ForstnerGG
1981 Cholera toxin stimulates secretion of immunoreactive intestinal mucin. Am J Physiol 240 G10 16
73. DiRitaVJ
1992 Co-ordinate expression of virulence genes by ToxR in Vibrio cholerae. Mol Microbiol 6 451 458
74. CaiL
FriedmanN
XieXS
2006 Stochastic protein expression in individual cells at the single molecule level. Nature 440 358 362
75. BalabanNQ
MerrinJ
ChaitR
KowalikL
LeiblerS
2004 Bacterial persistence as a phenotypic switch. Science 305 1622 1625
76. KerenI
ShahD
SpoeringA
KaldaluN
LewisK
2004 Specialized persister cells and the mechanism of multidrug tolerance in Escherichia coli. J Bacteriol 186 8172 8180
77. van SinderenD
LuttingerA
KongL
DubnauD
VenemaG
1995 comK encodes the competence transcription factor, the key regulatory protein for competence development in Bacillus subtilis. Mol Microbiol 15 455 462
78. MaamarH
DubnauD
2005 Bistability in the Bacillus subtilis K-state (competence) system requires a positive feedback loop. Mol Microbiol 56 615 624
79. ChungJD
StephanopoulosG
IretonK
GrossmanAD
1994 Gene expression in single cells of Bacillus subtilis: evidence that a threshold mechanism controls the initiation of sporulation. J Bacteriol 176 1977 1984
80. Gonzalez-PastorJE
HobbsEC
LosickR
2003 Cannibalism by sporulating bacteria. Science 301 510 513
81. VeeningJW
HamoenLW
KuipersOP
2005 Phosphatases modulate the bistable sporulation gene expression pattern in Bacillus subtilis. Mol Microbiol 56 1481 1494
82. ChaiY
ChuF
KolterR
LosickR
2008 Bistability and biofilm formation in Bacillus subtilis. Mol Microbiol 67 254 263
83. MantleM
HusarSD
1994 Binding of Yersinia enterocolitica to purified, native small intestinal mucins from rabbits and humans involves interactions with the mucin carbohydrate moiety. Infect Immun 62 1219 1227
84. IwanagaM
YamamotoK
1985 New medium for the production of cholera toxin by Vibrio cholerae O1 biotype El Tor. J Clin Microbiol 22 405 408
85. BradfordMM
1976 A rapid and sensitive method for the quantitation of microgram quantities of protein utilizing the principle of protein-dye binding. Anal Biochem 72 248 254
86. FullnerKJ
MekalanosJJ
1999 Genetic characterization of a new type IV-A pilus gene cluster found in both classical and El Tor biotypes of Vibrio cholerae. Infect Immun 67 1393 1404
87. LambertsenL
SternbergC
MolinS
2004 Mini-Tn7 transposons for site-specific tagging of bacteria with fluorescent proteins. Environ Microbiol 6 726 732
88. KochB
JensenLE
NybroeO
2001 A panel of Tn7-based vectors for insertion of the gfp marker gene or for delivery of cloned DNA into Gram-negative bacteria at a neutral chromosomal site. J Microbiol Methods 45 187 195
89. MeibomKL
LiXB
NielsenAT
WuCY
RosemanS
2004 The Vibrio cholerae chitin utilization program. Proc Natl Acad Sci U S A 101 2524 2529
90. TusherVG
TibshiraniR
ChuG
2001 Significance analysis of microarrays applied to the ionizing radiation response. Proc Natl Acad Sci U S A 98 5116 5121
91. SchoolnikGK
VoskuilMI
SchnappingerD
YildizFH
MeibomK
2001 Whole genome DNA microarray expression analysis of biofilm development by Vibrio cholerae O1 E1 Tor. Methods Enzymol 336 3 18
92. KovacikovaG
LinW
SkorupskiK
2003 The virulence activator AphA links quorum sensing to pathogenesis and physiology in Vibrio cholerae by repressing the expression of a penicillin amidase gene on the small chromosome. J Bacteriol 185 4825 4836
Štítky
Hygiena a epidemiologie Infekční lékařství LaboratořČlánek vyšel v časopise
PLOS Pathogens
2010 Číslo 9
- Parazitičtí červi v terapii Crohnovy choroby a dalších zánětlivých autoimunitních onemocnění
- Vakcíny proti klíšťové encefalitidě
- Kdy je nejlepší očkovat
- Možné vedlejší účinky očkování
- Imunogenita vakcín
Nejčtenější v tomto čísle
- Structure of the Extracellular Portion of CD46 Provides Insights into Its Interactions with Complement Proteins and Pathogens
- The Length of Vesicular Stomatitis Virus Particles Dictates a Need for Actin Assembly during Clathrin-Dependent Endocytosis
- Inhibition of TIR Domain Signaling by TcpC: MyD88-Dependent and Independent Effects on Virulence
- The Coevolution of Virulence: Tolerance in Perspective
Zvyšte si kvalifikaci online z pohodlí domova
Mazová zátka a její řešení
nový kurzVšechny kurzy