
Minibrain/Dyrk1a Regulates Food Intake through the Sir2-FOXO-sNPF/NPY Pathway in and Mammals
Feeding behavior is one of the most essential activities in animals, which is tightly regulated by neuroendocrine factors. Drosophila melanogaster short neuropeptide F (sNPF) and the mammalian functional homolog neuropeptide Y (NPY) regulate food intake. Understanding the molecular mechanism of sNPF and NPY signaling is critical to elucidate feeding regulation. Here, we found that minibrain (mnb) and the mammalian ortholog Dyrk1a target genes of sNPF and NPY signaling and regulate food intake in Drosophila melanogaster and mice. In Drosophila melanogaster neuronal cells and mouse hypothalamic cells, sNPF and NPY modulated the mnb and Dyrk1a expression through the PKA-CREB pathway. Increased Dyrk1a activated Sirt1 to regulate the deacetylation of FOXO, which potentiated FOXO-induced sNPF/NPY expression and in turn promoted food intake. Conversely, AKT-mediated insulin signaling suppressed FOXO-mediated sNPF/NPY expression, which resulted in decreasing food intake. Furthermore, human Dyrk1a transgenic mice exhibited decreased FOXO acetylation and increased NPY expression in the hypothalamus, as well as increased food intake. Our findings demonstrate that Mnb/Dyrk1a regulates food intake through the evolutionary conserved Sir2-FOXO-sNPF/NPY pathway in Drosophila melanogaster and mammals.
Published in the journal:
. PLoS Genet 8(8): e32767. doi:10.1371/journal.pgen.1002857
Category:
Research Article
doi:
https://doi.org/10.1371/journal.pgen.1002857
Summary
Feeding behavior is one of the most essential activities in animals, which is tightly regulated by neuroendocrine factors. Drosophila melanogaster short neuropeptide F (sNPF) and the mammalian functional homolog neuropeptide Y (NPY) regulate food intake. Understanding the molecular mechanism of sNPF and NPY signaling is critical to elucidate feeding regulation. Here, we found that minibrain (mnb) and the mammalian ortholog Dyrk1a target genes of sNPF and NPY signaling and regulate food intake in Drosophila melanogaster and mice. In Drosophila melanogaster neuronal cells and mouse hypothalamic cells, sNPF and NPY modulated the mnb and Dyrk1a expression through the PKA-CREB pathway. Increased Dyrk1a activated Sirt1 to regulate the deacetylation of FOXO, which potentiated FOXO-induced sNPF/NPY expression and in turn promoted food intake. Conversely, AKT-mediated insulin signaling suppressed FOXO-mediated sNPF/NPY expression, which resulted in decreasing food intake. Furthermore, human Dyrk1a transgenic mice exhibited decreased FOXO acetylation and increased NPY expression in the hypothalamus, as well as increased food intake. Our findings demonstrate that Mnb/Dyrk1a regulates food intake through the evolutionary conserved Sir2-FOXO-sNPF/NPY pathway in Drosophila melanogaster and mammals.
Introduction
Neuropeptides regulate a wide range of physiological processes in animals. In mammals, NPY is widely distributed in the brain and involved in various physiological functions including food intake. In the mammalian brain, the hypothalamus is the center for controlling food intake. The hypothalamic injection of NPY in the rat brain induces hyperphagia and obesity. In the hypothalamus, the arcuate nucleus (ARC) that contains orexigenic NPY and AgRP expressing neurons and anorexigenic POMC neurons senses hormonal levels of insulin and leptin and regulates food intake [1]. In Drosophila, sNPF, a functional homolog of NPY produced in sNPFnergic neurons of the fly brain, regulates food intake and growth [2]. Recently, we reported that sNPF and sNPF receptor (sNPFR1) regulate body growth through evolutionary conserved ERK-mediated insulin signaling in Drosophila and rat insulinoma cells [3].
Drosophila Minibrain (Mnb) and its mammalian ortholog Dual specificity tyrosine-phosphorylation-regulated kinase 1a (Dyrk1a) are highly expressed in the neural tissues [4], [5], [6]. The Dyrk1a gene has been implicated in Down Syndrome (DS) [5], [7] and the expression level of Dyrk1a is increased in DS patients and Ts65Dn mice, a mouse model of Down syndrome [4], [8]. Mutations of mnb and Dyrk1a in Drosophila and mammals show neural phenotypes like defects in neuroblasts proliferation and brain development [6], [9]. Human patients with truncated mutations in the Dyrk1a gene also show microcephaly [10], [11]. To date, however, the effects of mnb and Dyrk1a upon food intake have not been described.
FoxO1 modulates food intake by regulation of orexigenic Argp and anorexigenic Pomc genes in the hypothalamus of mice. In the ARC of hypothalamic neurons, FoxO1 is localized in the nuclei during fasting and in the cytoplasm by feeding [12]. Sirtuin1 (Sirt1), the mammalian ortholog of Drosophila Silent information regulator 2 (Sir2), in the ARC also regulates food intake [13]. The Sirt1 protein level increases during fasting. Sirt1 inhibition by the hypothalamic knock-out in the AgRP neurons decreases food intake [14]. In N43 hypothalamic cells, pharmacological inhibition of Sirt1 increases anorexigenic POMC expression but co-treatment with Sirt1 inhibitor and FoxO1 siRNA does not [15], suggesting that Sirt1-mediated FoxO1 deactylation is involved in the regulation of POMC mRNA and food intake.
In this study, we identified mnb and Dyrk1a as target genes of sNPF and NPY signaling, respectively, and describe a molecular mechanism of how Mnb and Dyrk1a regulate food intake in Drosophila and mice.
Results
sNPF Targets mnb to Regulate Food Intake in Drosophila
To find genes affected by sNPF signaling, we performed a DNA microarray analysis using the Affymetrix Drosophila Genome 2.0 Array GeneChip with mRNA extracted from Drosophila neuronal BG2-c6 cells treated with sNPF peptide. Among the 159 genes with at least a two-fold change, mRNA of mnb increased 34-fold compared to the control (Table S1). To test whether the expression of mnb is dependent on sNPF signaling in vivo, we examined the expression levels of mnb in sNPF and sNPFR1 mutants. When sNPF was overexpressed in sNPFnergic neurons with the sNPF-Gal4 driver [16] (sNPF>sNPF, sNPF>2XsNPF), mnb mRNA increased 4 to 5-fold compared with the sNPF-Gal4. mRNA of mnb decreased by less than half when sNPF was inhibited (sNPF>sNPF-Ri) or by an sNPF mutant (sNPFc00448) (Figure 1A and Figure S1A). When sNPFR1 was overexpressed via a sNPFR1-Gal4 driver (Figure S2) (sNPFR1>sNPFR1), mnb mRNA was increased 3-fold compared with the sNPFR1-Gal4 control. When sNPFR1 was inhibited (sNPFR1>sNPFR1-Ri) or suppressed (sNPFR1>sNPFR1-DN), mnb mRNA was decreased by more than 50% (Figure 1A and Figure S1A). Like mnb mRNA, Mnb proteins were also increased in sNPF or sNPFR1 overexpression with the sNPF-Gal4 or sNPFR1-Gal4 driver, (sNPF>2XsNPF, sNPFR1>sNPFR1) while reduced in an sNPF mutant (sNPFc00448) or sNPFR1 inhibition (sNPFR1>sNPFR1-Ri) compared with the sNPF-Gal4 or sNPFR1-Gal4 control (Figure S3A). However, the numbers of Mnb expression neurons (asterisks) are consistent in the sNPFR1-Gal4 control, sNPFR1 overexpression (sNPFR1>sNPFR1), sNPFR1 inhibition (sNPFR1>sNPFR1-Ri), and an sNPFc00448 mutant (Figure S3B–S3F). These results indicate that sNPF-sNPFR1 signaling regulates mnb mRNA and protein expression in Drosophila.

To understand how Mnb protein may interact with the sNPFR1 receptor, we immunostained fly adult brains with Mnb and sNPFR1 antibodies. The Mnb antibody produced strong and weak staining in neuronal cells (Figure 1H, 1K, red) while the sNPFR1 receptor antibody stained many neurons (Figure 1I, 1L, green). Among the strongly stained Mnb neurons, cell bodies of symmetrically localized median neurons behind the antennal lobe show overlap with the antibody against sNPFR1 (Figure 1J, 1M, arrows). At least ten neuronal cell bodies in median neurons were stained with the both antibodies. This coincidence suggests that at least part of Mnb function may be regulated by sNPF-sNPFR1 signaling.
Since sNPF signaling regulates food intake and growth, and growth is regulated by ERK-mediated insulin signaling [3], we hypothesized that sNPF may regulate food intake through the mnb gene. To assess this hypothesis, we used the CAFÉ assay [17] to measure feeding in mnb mutant adults. Because homozygous mnb deletion mutants (mnbd305 and mnbd419) generated by the imprecise excisions of the P-element (Figure S4A) are lethal (as are homozygous Dyrk1a mutant mice) we analyzed mnb overexpression and hypomorphs generated by RNAi. mnb overexpression in sNPFR1 neurons (sNPFR1>mnb) increased cumulative food consumption compared to the sNPFR1-Gal4 control whereas inhibiting mnb (sNPFR1>mnb-Ri) decreased cumulative food consumption (Figure 1C), indicating that mnb expression in sNPFR1 neurons can regulate food intake. Likewise, we measured the amount of food intake by the amount of digested dye from colored food. Overexpression of mnb in sNPFR1 neurons (sNPFR1>mnb and sNPFR1>2Xmnb) increased consumed dye up to 57% compared with that of the sNPFR1-Gal4 control whereas mnb inhibition (sNPFR1>mnb-Ri) or the mnb mutant (mnbG1767) decreased this intake by 30% (Figure 1B and Figure S1B). As expected, levels of mnb mRNA and protein were markedly reduced by mnb inhibition and by the mnbG1767 mutant relative to the sNPFR1-Gal4 and w- controls (Figure S4B, S4C). Since sNPFR1 signaling in the insulin producing cells (IPCs) regulates body growth through insulin signaling [3], we examined the effect of mnb in IPCs upon food intake. However, food intake was not affected by mnb overexpression in IPCs driven via Dilp2-Gal4 (Dilp2>mnb and Dilp2>2Xmnb) or by mnb inhibition in IPCs (Dilp2>mnb-Ri) (Figure 1B). Expression of mnb in sNPFR1 neurons but not in IPCs (Figure 1D–1G) is sufficient to regulate food intake.
To determine the consequences of mnb control upon food intake we measured the body weight of young adults from mutant and control. Overexpression of mnb in sNPFR1 neurons (sNPFR1>mnb) increased body weight relative to that of sNPFR1-Gal4 controls, similar to the effect seen when sNPFR1 is overexpressed (sNPFR1>sNPFR1). On the contrary, body weight is decreased when mnb is repressed in sNPFR1 neurons (sNPFR1>mnb-Ri) and mnbG1767 mutant (Figure S4D). The amounts of food intake in the mutants were similar when they were normalized to body mass or to the number of flies (Figure S4E).
Since mnb is involved in neural development [6], [9], we restricted mnb expression in the adult stage using the tub-GAL80ts inducible system [18] and tested food intake. mnb overexpression (sNPFR1-Gal4+tubGal80ts>mnb, sNPFR1-Gal4+tubGal80ts>2Xmnb) and mnb inhibition (sNPFR1-Gal4+tubGal80ts>mnb-Ri) flies were cultured in the 22°C permissive temperature until adulthood to suppress sNPFR1-Gal4 expression by the tubGal80ts. Then, these adult flies were shifted to the 30°C restrictive temperature in which the tubGal80ts cannot suppress sNPFR1-Gal4. In the permissive condition, the mnb overexpression and mnb inhibition flies did not change the amount of food intake compared with the control flies (sNPFR1-Gal4; tub-Gal80ts) (Figure S5A). However, in the restrictive condition, the mnb overexpression increased food intake compared with the control and the mnb inhibition suppressed food intake (Figure S5B). These results indicate that the food intake phenotype of mnb mutants is not due to developmental effects.
sNPF-PKA-CREB-mnb Signaling in Drosophila Neuronal BG2-c6 Cells
To study how sNPFR1 regulates mnb expression, we treated Drosophila central nervous system-derived BG2-c6 cells [19] with synthetic sNPF peptide, which changed sNPF and sNPFR1 expression slightly (Figure S6A). Consistent with our initial observations and with patterns in genetically manipulated flies, sNPF treatment increased mnb mRNA more than 5-fold compared to the control when measured by quantitative PCR (Figure 2A). Then, we tested whether the induction of this mnb mRNA is mediated by ERK, as we have previously observed for the induction of Drosophila insulin like peptides (Dilps) by sNPF [3]. However, ERK inhibitor PD98059 treatment of the sNPF peptide-treated cells did not suppress the mnb expression. On the other hand, sNPFR1 is a G-protein coupled receptor (GPCR), and the second messenger of GPCRs is cAMP or Ca++ which respectively activates PKA or PKC [20].Thus, we treated BG2-c6 cells with the protein kinase A (PKA) inhibitor H89 or with protein kinase C (PKC) inhibitor Chelerythrine Chloride (CC). H89 decreased both basal and sNPF-induced mnb expression level but the PKC inhibitor CC showed no effect (Figure 2A). sNPF signaling appears to control mnb expression through PKA, not through ERK or PKC. Consistent with this interpretation, BG2-c6 cells treated with sNPF showed increased levels of cAMP in a time-dependent manner, peaking at 15 min (Figure S6B).

To find the Gα subunit of the sNPFR1 G-protein heterotrimer, we examined Gαs and Gαi, both of which modulate cAMP [20]. When transfected into BG2-c6 cells Gαs siRNA inhibited sNPF-induced cAMP whereas transfection with Gαi siRNA did not (Figure 2C), suggesting that Gαs is a Gα subunit of sNPFR1 that can modulate the cAMP-PKA pathway in Drosophila neuronal cells. Next, we examined the activation of the cAMP responding element binding protein (CREB), which is a PKA down-stream transcription factor [21]. sNPF stimulated the phosphorylation of CREB in control cells whereas Gαs siRNA transfection suppressed this sNPF dependent activation of CREB (Figure 2E). In addition, Gαs siRNA transfection completely blocked the induction of mnb by sNPF, but Gαi siRNA transfection did not (Figure 2G). These data indicate that Gαs is a key Gα subunit of the sNPFR1 G-protein as it regulates mnb expression. Taken together, these findings demonstrate that sNPF signaling effectively regulates mnb expression through the Gαs-cAMP-PKA-CREB pathway in Drosophila neuronal cells.
NPY-PKA-CREB-DYRK1A Signaling in Mouse Hypothalamic GT1-7 Cells
To compare the functional conservation of sNPF-sNPFR1-PKA-CREB-mnb signaling with the signaling of mammalian NPY, we conducted similar experiments with mouse GT1-7 hypothalamic cells [22]. NPY treatment increased Dyrk1a mRNA while the PKA inhibitor H89 strongly suppressed NPY-induced Dyrk1a expression (Figure 2B). NPY signaling activates Dyrk1a expression through PKA, much like the PKA mediated mnb expression by sNPF in fly neuronal cells. Next, we measured the cAMP level in the NPY treated GT1-7 cells. As expected, cAMP level increased time-dependently and peaked at 15 min (Figure S6C). Five NPY receptors (NPYR1, 2, 4, 5, and 6) mediate the NPY signal [23]. Among them, NPYR1, 2, and 5 receptors are broadly expressed in the mouse nervous system and mediate NPY-induced food intake [24]. We treated GT1-7 cells with chemical inhibitors against these receptors: BIBO3304 for NPYR1, BIIE0246 for NPYR2, and CGP71683 for NPYR5. The NPYR1 inhibitor BIBO3304 substantially decreased the NPY-induced cAMP level; little effect was seen for the inhibitors of NPYR2 and NPYR5 (Figure 2D). Thus, NPY appears to activate the cAMP-PKA pathway mainly through NPYR1 in GT1-7 hypothalamic cells. Next, we measured the CREB activation. As expected, inhibiting PKA or NPYR1 suppressed the NPY-induced activation of CREB (Figure 2F), confirming that NPY signal is mediated through NPYR1-cAMP-PKA-CREB. In addition, the NPYR1 inhibitor strongly suppressed NPY-induced Dyrk1a expression; this was not seen with the inhibitors of NPYR2 and NPYR5 (Figure 2H). Taken together, these findings indicate that NPY signaling regulates Dyrk1a expression mainly through the NPYR1-cAMP-PKA-CREB pathway in mouse hypothalamic cells. Importantly, this signal transduction pathway is conserved between fly neuronal cells and mammalian hypothalamic cells.
Genetic Interactions among sNPFR1, Gαs, PKA, CREB, and mnb Genes, and CREB ChIP Analysis
To study genetic interactions among sNPFR1, Gαs, PKA, CREB, and mnb genes, we suppressed Gαs, PKA, CREB, and mnb by RNAi and Dominant Negative (DN) forms in neurons that simultaneously overexpressed sNPFR1. Each of these suppression genotypes reduced the level of mnb mRNA compared with sNPFR1-Gal4 and UAS controls (Figure 3A and Figure S7A). In contrast to the strong induction of mnb produced by sNPFR1 overexpression alone (sNPFR1>sNPFR1), mnb induction was inhibited in genotypes where sNPFR1 overexpression occurred with each of the suppression constructs (sNPFR1>sNPFR1+Gαs-Ri, sNPFR1>sNPFR1+PKA-DN, sNPFR1>sNPFR1+CREB-DN, sNPFR1>sNPFR1+mnb-Ri) (Figure 3B). In sNPFR1 neurons of flies, as in isolated cells, Gαs, PKA, and CREB may work downstream of sNPFR1 to regulate mnb expression. The consequences of these interactions are also seen in terms of food intake. Gαs, PKA, CREB, and mnb suppression mutant flies have reduced food intake compared to those of the sNPFR1-Gal4 and UAS controls (Figure 3C and Figures S1C, S7B). Furthermore, increased food intake of sNPFR1 overexpression was suppressed by co-inhibition of Gαs, PKA, and CREB, respectively (Figure 3D). These results suggest that the sNPFR1 may regulate food intake through Gαs, PKA, CREB, and mnb.
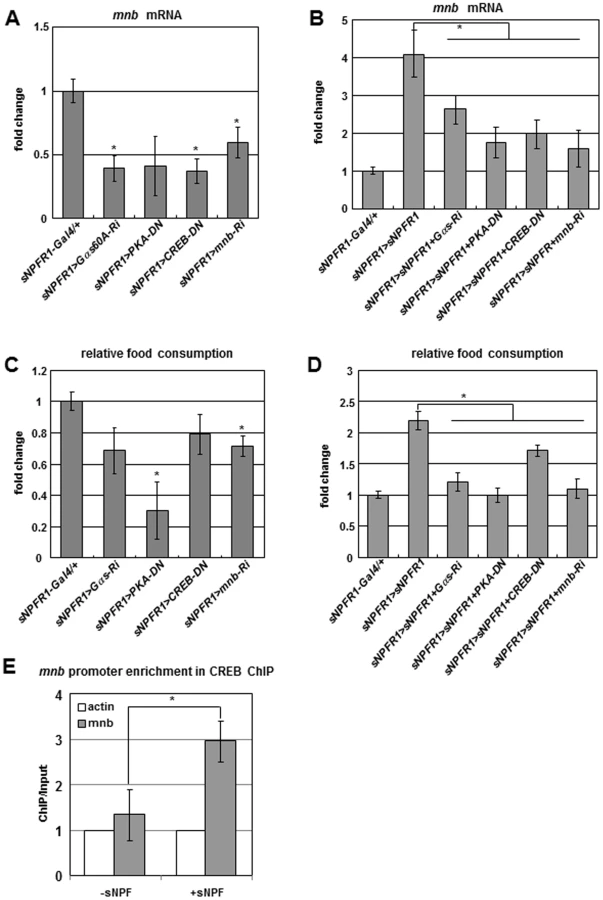
Based on promoter analysis of mnb genes from twelve Drosophila species, we found a conserved cAMP responding element (CRE) site (Figure S8). Interestingly, the promoters of human Dyrk1a and mouse Dyrk1a genes contain CRE [25]. To test whether CREB binds to the promoter of the mnb gene, we performed the chromatin immunoprecipitation (ChIP)-PCR analysis with the CREB antibody in sNPF treated Drosophila neuronal BG2-c6 cells. CREB binding was enriched at the sNPF treated promoter region of the mnb gene by 3-fold compared to the Act5C and sNPF non-treated controls (Figure 3E). Together these in vivo and in vitro findings indicate that sNPF-sNPFR1-Gαs-PKA-CREB pathway controls expression of the mnb target gene and regulates food intake in Drosophila.
Positive Regulation of sNPF/NPY by the Mnb/Dyrk1a-Sir2-FOXO Pathway
A possible avenue through which Mnb regulates food intake could involve Sirt1/Sir2. Notably, Dyrk1a kinase phosphorylates Sirt1 in HEK293T cells [26], and activated Sirt1 deacetylates FoxO1 to modulate the activity of this transcription factor in the rat hypothalamus [15]. Accordingly we determined if these interactions were present and associated in mouse hypothalamic GT1-7 cells. In cells transfected with Dyrk1a or treated with NPY, phosphorylation of Sirt1 was increased as detected by immunoprecipitation with Sirt1 antibody, followed by immunobloting with phospho-threonine (pThr) antibody. Sirt1 phosphorylation was reduced by Dyrk1a siRNA or Dyrk1a siRNA with NPY (Figure 4A). In addition, FoxO1 acetylation was reduced in cells transfected by Dyrk1a or treated with NPY, while FoxO1 acetylation was increased by Dyrk1a siRNA, Dyrk1a siRNA with NPY, or Dyrk1a transfection coupled with the Sirt1 inhibitor EX527 (Figure 4C). Importantly, NPY mRNA itself was increased in cells transfected with Dyrk1a or treated with NPY peptide, and NPY mRNA was decreased by Dyrk1a siRNA, Dyrk1a siRNA with NPY, or Dyrk1a overexpression in the presence of Sirt1 inhibitor (Figure 4B). In mouse hypothalamic GT1-7 cells, Dyrk1a phosphorylates Sirt1 and this activated Sirt1 appears to deacetylate FoxO1 which in turn positively regulates expression of NPY.

To study genetic interactions among mnb, Sir2, and dFOXO in an animal model, we manipulated Sir2 and dFOXO in the Drosophila mnb overexpression genotype. When mnb, Sir2, and dFOXO were overexpressed in sNPFR1-Gal4 neurons (sNPFR1>mnb, sNPFR1>Sir2, sNPFR1>dFOXO) (Figure S9A), sNPF mRNA and food intake were increased compared to sNPFR1-Gal4 and UAS controls (Figure 4D and 4E, Figure S7B and S7C). Conversely, when mnb, Sir2, and dFOXO were inhibited in sNPFR1 expressing neurons (sNPFR1>mnb-Ri, sNPFR1>Sir2-Ri, sNPFR1>dFOXO-Ri) (Figure S9B), the expression levels of sNPF and food intake were decreased or similar to those of sNPFR1-Gal4 and UAS controls (Figure 4D and 4E, Figure S7B and S7C). Finally the level of sNPF mRNA and food intake were reduced in adults when Sir2 or dFOXO were inhibited in sNPFR1 neurons that overexpressed mnb (sNPFR1>mnb+Sir2-Ri, sNPFR1>mnb+dFOXO-Ri) compared with flies only overexpressing mnb (sNPFR1>mnb). These data suggest that mnb may regulate sNPF expression and food intake through Sir2 and dFOXO.
Since fasting can stimulate food intake, we tested whether an acute period of food deprivation affected the expression of mnb and sNPF of adult flies. Levels of mnb and sNPF mRNA increased 2-fold after 12 h starvation (Figure 4F). We propose that dFOXO contributes to this expression of sNPF in starved flies. We identified a common dFOXO consensus binding site (RWWAACA) in the sNPF promoter from twelve Drosophila species (Figure S10) and performed a chromatin immunoprecipitation (ChIP)-tiled gene array analysis with dFOXO antibody in fed and starved adult flies. dFOXO binding was enriched at the promoter region of sNPF gene more than 3-fold in the starved flies compared to the Act5c and fed controls (Figure 4G). These results suggest that the dFOXO transcriptional factor regulates sNPF mRNA expression by direct binding to its promoter in Drosophila, as seen for FoxO1 regulation of NPY expression in mice [27].
Overall, these results from mouse hypothalamic GT1-7 cells and Drosophila indicate that the Mnb/Dyrk1a-Sir2-FOXO pathway positively regulates sNPF/NPY expression and food intake.
Negative Regulation of sNPF/NPY by Insulin Signaling
The positive feedback regulation of sNPF signaling we have described to this point must occur alongside a system to negatively regulate sNPF signaling. Insulin, one of several anorexigenic hormones, inhibits food intake through AKT-mediated FoxO1 inactivation in the hypothalamus [27]. In Drosophila, neuronal overexpression of Dilps negatively regulates larval food intake [28]. To understand the inhibitory mechanism of insulin on food intake, we analyzed the phosphorylation of FOXO and the expression of NPY and sNPF. In the mouse hypothalamic GT1-7 cells, insulin treatment increased FoxO1 phosphorylation and decreased NPY mRNA while insulin combined with AKT inhibitor co-treatment slightly decreased FoxO1 phosphorylation and increased NPY expression (Figure 5A, 5B). Likewise, in fly neuronal BG2-c6 cells, insulin with AKT inhibitor co-treatment increased sNPF mRNA (Figure 5C). Thus, in both models AKT-mediated insulin signaling increased FOXO phosphorylation and suppressed NPY or sNPF expression.

We extended these results with analyses of Drosophila with insulin and insulin receptor transgenes. Compared to Dilp2-Gal4 and sNPFR1-Gal4 controls, sNPF mRNA and food intake were decreased when Dilp2 was overexpressed in insulin producing cells (Dilp2>Dilp2) and when insulin receptor (InR) was overexpressed in sNPFR1 expressing neurons (sNPFR1>InRWT) (Figure 5D, 5E). On the other hand, sNPF expression and food intake were increased when InR was suppressed by a dominant negative construct expressed in sNPFR1 neurons (sNPFR1>InRDN) (Figure 5D, 5E). Fasting may contribute to sNPF expression and the propensity for food intake because fasting in the adult reduces the expression of several Dilps (Figure 5F), as previously observed to occur in Drosophila larvae [29].
Taken together, the results from mouse and Drosophila neuronal cells and from adult flies indicate that the insulin signaling negatively regulates sNPF/NPY expression and food intake.
Dyrk1a TG Mice Regulate Food Intake through the FOXO-NPY Pathway
To evaluate these Mnb/Dyrk1a-Sir2-FOXO-NPY interactions and consequences in a mammalian animal model, we examined FoxO1 acetylation and NPY expression in the hypothalamus of transgenic mice containing the human Dyrk1a BAC clone (hDyrk1a TG). As expected, in the Western blot, Dyrk1a in the hypothalamus was increased in hDyrk1a TG mice compared to controls (Figure 6A). On the other hand, FoxO1 in the hypothalamus was less acetylated in hDyrk1a TG mice compared to controls (Figure 6C). Hypothalamic NPY mRNA as well as serum NPY levels were elevated in in hDyrk1a TG mice compared to controls (Figure 6B). Thus, mammalian Dyrk1a appears to regulate FoxO1 acetylation and NPY expression in the mouse hypothalamus, as we have observed for this system in Drosophila sNPFR1 neurons.

To assess whether mammalian Dyrk1a also regulates food intake as seen for the homolog mnb of Drosophila, we monitored food intake in seven-week-old hDyrk1a TG mice. Daily food consumption was increased in the transgenic mice compared to littermate controls (Figure 6D) and the average food intake of hDyrk1a transgenic mice was elevated by 15% (Figure 6E). Correspondingly, the hDyrk1a transgenic mice presented slightly increased mass (Figure S11). Dyrk1a thus appears to regulate food intake through the expression of NPY mediated by FOXO in a molecular pathway that is evolutionarily conserved in Drosophila.
Discussion
The production of sNPF and NPY in sNPFnergic and hypothalamic neurons of flies and mammals respectively, is increased during fasting. These neuropeptides are secreted to produce paracrine and endocrine effects [24] but also feedback upon their synthesizing neurons where they respectively induce mnb and Dyrk1a gene expression through the PKA-CREB pathway (Figure 6F). This Mnb/Dyrk1a kinase phosphorylates and activates the Sir2/Sirt1 deacetylase, which in turn deacetylates and activates the FOXO transcription factor. Among its many potential targets, FOXO then increases sNPF/NPY mRNA expression. Negative controls modulate the positive feedback of sNPF/NPY. Feeding activates the insulin receptor-PI3K-AKT pathway. FOXO becomes phosphorylated and transcriptionally inactivated by translocation to the cytoplasm [30]. In this state the induction of sNPF/NPY by FOXO is decreased. Because sNPF and NPY are orexogenic, their positive feedback during fasting should reinforce the propensity for food intake whereas the negative regulation of sNPF and NPY mRNA during feeding condition would then contribute to satiety (Figure 6F).
FOXO family transcriptional factors are involved in metabolism, longevity, and cell proliferation [31]. FOXO is in part regulated in these processes by post-transcriptional modifications including phosphorylation and acetylation [30]. In many model systems, the ligand activated Insulin-PI3K-AKT pathway phosphorylates FOXO to inactivate this transcription factor by moving it to the cytoplasm. The cytoplasmic localization of FOXO is mediated by 14-3-3 chaperone proteins in Drosophila and mammals [32], [33]. FOXO may also be acetylated, as is FoxO1 of mice, by the CREB-binding protein (CBP)/p300 acetylase and this inhibits FOXO transcriptional function by suppressing its DNA-binding affinity. Such FoxO1 acetylation can be reversed by SirT1 to help activate the FoxO1 transcription factor [34]. Here we describe for Drosophila how dFOXO in sNPFR1 neurons regulates the expression of sNPF and food intake (Figure 4D, 4E). This mechanism parallels how hypothalamic FoxO1 regulates food intake through its control of orexigenic NPY and Agrp in rodents [12], [27]. Post-transcriptional modification of FOXO is central to these controls in both animals. sNPF and NPY expression is increased when FOXO is deacetylated by Sir2/Sirt1, while sNPF and NPY are decreased when FOXO is phosphorylated via the Insulin-PI3K-AKT pathway. Post-transcriptional modifications of FOXO proteins play a critical role for controlling food intake through the sNPF and NPY expression in flies and rodents.
Mnb/Dyrk1a has been described to participate in olfactory learning, circadian rhythm, and the development of the nervous system and brain [6]. Mnb and Dyrk1a proteins contain a nuclear targeting signal sequence, a protein kinase domain, a PEST domain, and a serine/threonine rich domain. The kinase domains are evolutionary well-conserved from flies to humans [35]. In Down syndrome (DS), chromosome 21 trisomy gives patients three copies of a critical region that includes the Mnb/Dyrk1a; trisomy of this region is associated with anomalies of both the nervous and endocrine systems [36]. DS patients often show high Body Mass Index due to the increased fat mass. Children with DS have elevated serum leptin coupled with leptin resistance, both of which contribute to the obesity risk common to DS patients [37], [38]. We now observe a novel function of Mnb/Dyrk1a that may underlay this metabolic condition of DS patients. Mnb/Dyrk1a regulates food intake in flies and mice. This is controlled by sNPF/NPY-PKA-CREB up-stream signaling and thus produces down-stream affects upon Sir2/Sirt1-FOXO-sNPF/NPY. Fasting not only increases the expression of mnb, but also of sNPF, suggesting that Mnb kinase activates a positive feedback loop where Sir2-dFOXO induces sNPF gene expression. Notably, fasting increases Sirt1 deacetylase activity and localizes FoxO1 to the nucleus in the orexogenic AgRP neurons of the mouse hypothalamus [15]. Increased dosage of Dyrk1a in DS patients may reinforce the positive feedback by NPY and disrupt the balance between hunger and satiety required to maintain a healthy body mass.
Insulin produced in the pancreas affects the hypothalamus to regulate feeding in mammals [1]. Insulin injected into the intracerebroventrical of the hypothalamus reduces food intake while inhibiting insulin receptors of the hypothalamic ARC nucleus causes hyperphasia and obesity in rodent models [39], [40]. Here we saw a similar pattern for Drosophila where overexpression of insulin-like peptide (Dilp2) at insulin producing neurons decreased food intake while food intake was increased by inhibiting the insulin receptor in sNPFR1 expressing neurons (Figure 5E). Likewise, during fasting, serum insulin and leptin levels are decreased in mammals [1], as is mRNA for insulin-like peptides of Drosophila [29], [41] (Figure 5F). Thus, the mechanism by which insulin and insulin receptor signaling suppresses food intake is conserved from fly to mammals in at least some important ways.
Previously, we reported how sNPF signaling regulates Dilp expression through ERK in IPCs and controls growth in Drosophila [3]. Here, we show that sNPF signaling regulates mnb expression through the PKA-CREB pathway in non-IPC neurons and controls food intake (Figure 1B, 1D–1G). Since sNPF works through the sNPFR1 receptor, sNPFR1 in IPCs and non-IPCs neurons might transduce different signals and thereby modulate different phenotypes. Four Dilps (Dilp1, 2, 3, and 5) are expressed in the IPCs of the brain [42]. Interestingly, levels of Dilp1 and 2 mRNA are reduced in the sNPF mutant, which has small body size [3], but here we find only Dilp3 and 5 mRNA levels are reduced upon 24 h fasting. Likewise, only Dilp5 is reduced when adult flies are maintained on yeast-limited diets [43]. In addition, Dilp1 and 2 null mutants show slight reduced body weights but Dilp3 and Dilp5 null mutants do not [44]. These results suggest that Dilp1 and 2 behave like a mammalian insulin growth factor for size regulation while Dilp3 and 5 act like a mammalian insulin for the regulation of metabolism. However, in the long term starvation, Dilp2 and Dilp5 mRNA levels are reduced and Dilp3 mRNA expression is increased [45].
During fasting, sNPF but not sNPFR1 mRNA expression was increased in samples prepared from fly heads (Figure 4F and Figure S9C), which increases food intake. On the other hand, in feeding, the high level of insulin signaling reduced sNPF but not sNPFR1 mRNA expression and suppressed food intake (Figure 5D and 5E, Figure S9D). Interestingly, in the antenna of starved flies, sNPFR1 but not sNPF mRNA expression is increased and induces presynaptic facilitation, which resulted in effective odor-driven food search. However, high insulin signaling suppresses sNPFR1 mRNA expression and prevents presynaptic facilitation in DM1 glomerulus [46]. These results indicate that starvation-mediated or insulin signaling-mediated sNPF-sNPFR1 signaling plays a critical role in Drosophila feeding behavior including food intake and food search even though the fine tuning is different.
In this study, we present a molecular mechanism for how sNPF and NPY regulate food intake in Drosophila and mice. We describe a system of positive feedback regulation for sNPF and NPY signaling that increases food intake and a mode of negative regulation for sNPF and NPY by the insulin signaling that suppresses food intake. Modifications of the FOXO protein play a critical role for regulating sNPF and NPY expression, resulting in the control of food intake.
Materials and Methods
Drosophila Culture and Stocks
Drosophila melanogaster were cultured and at 25°C on standard cornmeal, yeast, sugar, agar diet. Wild-type Canton-S, w-, and UAS-CREB-DN were obtained from the Bloomington stock center. sNPFc00448 was obtained from the Harvard stock center (Exelixis stock collection). UAS-sNPF, UAS-2XsNPF, UAS-sNPF-Ri, UAS-sNPFR1, UAS-sNPFR1-DN and sNPF-Gal4 transgenic flies were described in our previous reports [2], [3], [16]. The sNPFR1-Gal4 construct was generated from a 2.5 kb genomic DNA fragment of the 5′-untranslated region of the sNPFR1 gene. The full-length coding sequence of Drosophila minibrain-H (mnb, CG 42273) was subcloned into the pUAS vector to generate the pUAS-mnb construct. sNPFR1-Gal4 and UAS-mnb transgenic flies were obtained by the P-element-mediated germ line transformation [47]. mnbG1767, an EP line for minibrain, was purchased from the GenExel, Inc. (KAIST, Korea). UAS-sNPFR1-Ri (VDRC9379), UAS-mnb-Ri (VDRC28628), UAS-Sir2-Ri (VDRC23201) and UAS-FOXO-Ri (VDRC106097) were obtained from the Vienna Drosophila RNAi Center (VDRC). Dilp2-Gal4, UAS-Gαs-Ri, UAS-PKA-DN (a dominant-negative form of PKA), UAS-Sir2 transgenic flies were described previously [42], [48], [49], [50], [51]. To express these UAS lines, UAS-Gal4 system was used [52]. For minimizing the genetic background effect among tested Drosophila lines, all stocks were crossed with w- and then crossed to the second (w-; Bc, Elp/CyO) or third (w-; D/TM3, Sb) chromosome balancers, respectively. For making double mutants, w-; T(2 : 3) ApXa/CyO; TM3 was crossed with the flies containing UAS-X transgene to produce w-; UAS-X/CyO; +/TM3. Then, w-; +/CyO; UAS-Y/TM3 flies generated by the similar way were crossed with w-; UAS-X/CyO; +/TM3 to produce w-; UAS-X/CyO; UAS-Y/TM3.
Cell Culture, Stimulation, and Transfection
Drosophila BG2-c6 cells established by the single colony isolation of primary cells derived from the third instar larval central nervous system. This cell line synthesizes acetylcholine and expresses insect neuron specific glycans and a RNA-binding protein Elav [19]. BG2-c6 cells purchased from the Drosophila Genomics Resource Center (DGRC, Indiana University) were maintained at 26°C in Schneider medium supplemented with 10% bovine calf serum. Immortalized GT1-7 mouse hypothalamic neurons [22] were cultured in 4.5 g/l glucose Dulbecco's modified Eagle's medium (DMEM) supplemented with 10% fetal bovine serum, 2% of l-glutamine, 100 µU/ml penicillin and 100 µg/ml streptomycin in 5% CO2 at 37°C. The culture medium was changed every 2–3 days. Before peptide treatments, cells were starved for 8 h in the serum-free medium containing 0.5% BSA and pretreated with a chemical inhibitor or vehicle. PKA inhibitor H89 (10 µM, Calbiochem), ERK-specific kinase MEK inhibitor PD98059 (10 µM, Calbiochem), PKC inhibitor Chelerythrine chloride (1 µM, Sigma) were used. NPY1R inhibitor BIBO3304 (10 nM), NPY2R inhibitor BIIE0246 (50 nM), NPY5R inhibitor CGP71683 (1 µM) and Sirt1 inhibitor EX527 (10 µM) were purchased from Tocris. Then, cells were treated with 100 nM synthetic 19 amino acids sNPF2 or 100 nM human NPY 1–36 peptide (Sigma). For transfection, cells were cultured in the growth medium without antibiotics and transfected with small interfering RNA (siRNA) using Lipofectamine 2000 reagent (Invitrogen). Gαs and Gαi siRNA constructs were designed by the BLOCK-iT RNAi Designer and Dyrk1a siRNA was purchased from Invitrogen. The sequences of siRNA are caggauauucuucggugccguguuu for Gαs and cggcgggauacuaucuaaauucgcu for Gαi. The BLOCK-iT Fluorescent Oligo, which is a fluorescent-labeled dsRNA oligomer, was used as the non-targeting siRNA control. For the overexpression mouse Dyrk1a, a full-length mDyrk1a cDNA was cloned to pCDNA3.1 (Invitrogen).
Drosophila Food Intake Assay
We measured food intake of Drosophila in two ways. The CAFE assay [17] was performed with 3 day-old adult male flies. Twelve hours before the assay, ten flies were placed in the CAFE device [17] containing 5% sucrose solution in calibrated glass micropipettes (VWR, West Chester, PA). At time zero, the micropipettes with 5% sucrose solution were replaced and the amount of liquid consumed was measured every 6 h. A colorimetric food intake assay was modified from published methods [2], [53]. Since flies had most fed color food in the crop during first 30 min and started to excrete from 1 h (Figure S4C, S4D) [54], flies were starved in PBS-containing vials for 2 h and fed for 30 min in vials containing 0.05% Bromophenol Blue dye and 10% sucrose in yeast paste. Then, the flies were frozen, homogenized in PBS, and centrifuged twice for 25 min each. The supernatant was measured at 625 nm. Each experiment consisted of 20 flies, and the assay was repeated at least three times.
Mouse Food Intake Assay
Dyrk1a transgenic mice expressed the human Dyrk1a BAC clone in the C57BL/6 background [55]. Seven weeks-old male Dyrk1a TG and littermate control mice were used in the experiments (n = 7). The mice were housed individually in the standard plastic rodent cages. They were maintained at 22±2°C in a room with a 12-hour light/dark cycle and habituated to frequent handling. Food intake and body weight were measured within 30 min before the light turned on and off. Drinking water was available at all times. Food intake data were corrected with body weight.
Animal care and all experiments were conducted according to KRIBB Guidelines for the Care and Use of Laboratory Animals and Inje University Council.
Drosophila Starvation
Twenty w- female flies were starved overnight and fed for 2 h for the physiological synchronization. Then, starvations for the experiment were started. The heads from starved flies were collected for the Quantitative RT-PCR analysis. The experiments were repeated three times.
Measurement of Drosophila Body Weight
Eggs laid by five female flies for 6 h at 25°C were cultured to avoid over-crowding and lack of nutrition. For weight of individual fly, over 50 three day-old adult male flies were measured with the balancer (METTLER AJ100) and divided with the number of flies. At least three experiments were performed in each assay.
Quantitative RT–PCR Analysis
Adult heads from 20 flies were collected for RNA preparation. Total RNA was extracted using the easy-BLUE (TM) reagent (iNtRON biotechnology). All RNA samples were treated with RNase-free DNase (Promega). cDNA was synthesized using a SuperScript III First-Strand Synthesis System (Invitrogen). For quantitative RT-PCR analysis, ABI Prism 7900 Sequence Detection System (Applied Biosystems) and SyberGreen PCR Core reagents (Applied Biosystems) were used. mRNA levels were expressed as the relative fold change against the normalized rp49 mRNA. The comparative cycle threshold (Ct) method (User Bulletin 2, Applied Biosystems) was used to analyze the data. All experiments were repeated at least three times. The statistical significance was tested by Microsoft Excel-based application for the student t-test statistical analysis. Primers used in the RT-PCR analyses were listed in Table S2.
Generation of the Minibrain and sNPFR1 Antisera and Immunostaining in the Adult Brain of Drosophila
Minibrain antiserum was generated by the immunization of rabbits with the synthetic peptide (CQHRVRNWPTNGNQ) corresponding to the N-terminal sequence (75–88) of the Minibrain-H protein. Antiserum against sNPFR1 was generated by the immunization of rat with the synthetic peptide (GEAIGAGGGAELGRRIN) corresponding to the C-terminal sequence (585–600) of the sNPFR1 protein. For immunostaining, adult brain from newly eclosed flies (3 day old) was dissected in PBS, fixed in 4% paraformaldehyde, and blocked in 5% BSA and 5% normal goat serum. Primary antibodies were incubated two days at 4°C and secondary antibodies were incubated for 2 h at room temperature. The tissues were mounted in the DABCO solution (70% glycerol, 2.5% DABCO, Sigma, St Louis, MO) and fluorescence images were acquired by FluoView confocal microscope (Olympus). sNPF (1∶200), sNPFR1 (1∶200), and Minibrain (1∶200) primary antibodies, and anti-rat IgG Alexa 488, anti-rabbit IgG Alexa 488, or Alexa 594 (1∶200, Molecular Probes) and anti-guinea pig Cy5 (1∶200, Jackson ImmunoResearch) secondary antibodies were used.
Western Blot Analysis
The cells were lysed by the Lysis buffer (Cell signaling) containing NaF, PMSF and Na3VO4. Total cell lysates were immunoprecipitated with Sirt1 antibody (Cell signaling) and protein A-agarose (Pierce). The immunoprecipitates were washed three times with Lysis buffer and solubilized in the SDS sample buffer (63.5 mM Tris-HCl; pH 6.8, 2% w/v SDS, 10% glycerol, 50 mM DTT, 0.01% w/v bromphenol blue). Western blot analyses were performed as described previously [2]. Phospho-CREB, phospho-Threonine, FoxO1 (1∶1000, Cell signaling), Ac-FKHR (1∶1000, Santa Cruze), β-actin (1∶3000, Abcam) primary antibodies, and horseradish peroxidase-conjugated anti-rabbit IgG (1∶5000, Santa Cruze) and anti-mouse IgG secondary antibody (1∶5000, Sigma) were used.
cAMP Assay
Intracellular cAMP was measured with the cAMP Biotrak Enzyme Immunoassay Kit (GE Healthcare) by the manufacturer's instruction. Briefly, samples were incubated with anti-cAMP antibody, which was immobilized in the secondary antibody coated micro-plates. Following enzyme substrate conversion, an optical density was measured at 450 nm with microplate reader (Fluostar Optima, BMG labtech). cAMP concentration was expressed as the cAMP pM per mg of protein and converted to the fold change relative to the basal control value.
ChIP-on-chip and ChIP–PCR Analysis
About 250 of 3-day-old W[DAH] female flies were collected after 12 h starvation. Then, flies were homogenized and cross-linked in 1X PBS containing 1% formaldehyde. The ChIP protocol was performed as described in Teleman et al. [56]. Immunoprecipitation was performed using Dynal protean G beads (Invitrogen) and anti-dFOXO antibody (a gift from Heather Broihier). Purified DNA was amplified and labeled following Affymetrix ChIP Assay Protocol. Drosophila Tiling 2.0R Array was used to detect dFOXO binding enrichment. For ChIP-PCR analysis, about 108 of BG2-c6 cells were treated with sNPF2 peptide as described above. sNPF-treated and untreated cells were cross-linked with 1% formaldehyde. After immunoprecipitation with the CREB antibody (Cell signaling) and Protein A Sepharose CL-4B (GE Healthcare), quantitative RT-PCR analysis was performed using input DNA and immunoprecipitated DNA for the CREB binding site in the mnb promoter region and the 3rd axon of Actin5C.
Statistics
Values in the paper are presented as means ± s.e.m. Statistical significant of all data were evaluated by the One-way ANOVA test (GraphPad Prism software). P<0.05 was accepted as statistically significant.
Supporting Information
Zdroje
1. MortonGJCummingsDEBaskinDGBarshGSSchwartzMW 2006 Central nervous system control of food intake and body weight. Nature 443 289 295
2. LeeKSYouKHChooJKHanYMYuK 2004 Drosophila short neuropeptide F regulates food intake and body size. J Biol Chem 279 50781 50789
3. LeeKSKwonOYLeeJHKwonKMinKJ 2008 Drosophila short neuropeptide F signalling regulates growth by ERK-mediated insulin signalling. Nat Cell Biol 10 468 475
4. GuimeraJCasasCEstivillXPritchardM 1999 Human minibrain homologue (MNBH/DYRK1): characterization, alternative splicing, differential tissue expression, and overexpression in Down syndrome. Genomics 57 407 418
5. GuimeraJCasasCPucharcosCSolansADomenechA 1996 A human homologue of Drosophila minibrain (MNB) is expressed in the neuronal regions affected in Down syndrome and maps to the critical region. Hum Mol Genet 5 1305 1310
6. TejedorFZhuXRKaltenbachEAckermannABaumannA 1995 minibrain: a new protein kinase family involved in postembryonic neurogenesis in Drosophila. Neuron 14 287 301
7. SongWJSternbergLRKasten-SportesCKeurenMLChungSH 1996 Isolation of human and murine homologues of the Drosophila minibrain gene: human homologue maps to 21q22.2 in the Down syndrome “critical region” Genomics 38 331 339
8. DowjatWKAdayevTKuchnaINowickiKPalminielloS 2007 Trisomy-driven overexpression of DYRK1A kinase in the brain of subjects with Down syndrome. Neurosci Lett 413 77 81
9. FotakiVDierssenMAlcantaraSMartinezSMartiE 2002 Dyrk1A haploinsufficiency affects viability and causes developmental delay and abnormal brain morphology in mice. Mol Cell Biol 22 6636 6647
10. MollerRSKubartSHoeltzenbeinMHeyeBVogelI 2008 Truncation of the Down syndrome candidate gene DYRK1A in two unrelated patients with microcephaly. Am J Hum Genet 82 1165 1170
11. van BonBWHoischenAHehir-KwaJde BrouwerAPRuivenkampC 2011 Intragenic deletion in DYRK1A leads to mental retardation and primary microcephaly. Clinical Genetics 79 296 299
12. KitamuraTFengYKitamuraYIChuaSCJrXuAW 2006 Forkhead protein FoxO1 mediates Agrp-dependent effects of leptin on food intake. Nat Med 12 534 540
13. RamadoriGLeeCEBookoutALLeeSWilliamsKW 2008 Brain SIRT1: anatomical distribution and regulation by energy availability. J Neurosci 28 9989 9996
14. DietrichMOAntunesCGeliangGLiuZWBorokE 2010 Agrp neurons mediate Sirt1's action on the melanocortin system and energy balance: roles for Sirt1 in neuronal firing and synaptic plasticity. J Neurosci 30 11815 11825
15. CakirIPerelloMLansariOMessierNJVasletCA 2009 Hypothalamic Sirt1 regulates food intake in a rodent model system. PLoS ONE 4 e8322 doi:10.1371/journal.pone.0008322
16. LeeKSHongSHKimAKJuSKKwonOY 2009 Processed short neuropeptide F peptides regulate growth through the ERK-insulin pathway in Drosophila melanogaster. FEBS Lett 583 2573 2577
17. JaWWCarvalhoGBMakEMde la RosaNNFangAY 2007 Prandiology of Drosophila and the CAFE assay. Proc Natl Acad Sci U S A 104 8253 8256
18. McGuireSEMaoZDavisRL 2004 Spatiotemporal gene expression targeting with the TARGET and gene-switch systems in Drosophila. Sci STKE 2004 pl6
19. UiKNishiharaSSakumaMTogashiSUedaR 1994 Newly established cell lines from Drosophila larval CNS express neural specific characteristics. In Vitro Cellular and Developmental Biology Animal 30A 209 216
20. RitterSLHallRA 2009 Fine-tuning of GPCR activity by receptor-interacting proteins. Nat Rev Mol Cell Biol 10 819 830
21. MayrBMontminyM 2001 Transcriptional regulation by the phosphorylation-dependent factor CREB. Nat Rev Mol Cell Biol 2 599 609
22. MellonPLWindleJJGoldsmithPCPadulaCARobertsJL 1990 Immortalization of hypothalamic GnRH neurons by genetically targeted tumorigenesis. Neuron 5 1 10
23. BlomqvistAGHerzogH 1997 Y-receptor subtypes–how many more? Trends Neurosci 20 294 298
24. KamijiMMInuiA 2007 Neuropeptide y receptor selective ligands in the treatment of obesity. Endocr Rev 28 664 684
25. ZhangXOdomDTKooSHConkrightMDCanettieriG 2005 Genome-wide analysis of cAMP-response element binding protein occupancy, phosphorylation, and target gene activation in human tissues. Proc Natl Acad Sci U S A 102 4459 4464
26. GuoXWilliamsJGSchugTTLiX 2010 DYRK1A and DYRK3 promote cell survival through phosphorylation and activation of SIRT1. J Biol Chem 285 13223 13232
27. KimMSPakYKJangPGNamkoongCChoiYS 2006 Role of hypothalamic Foxo1 in the regulation of food intake and energy homeostasis. Nat Neurosci 9 901 906
28. WuQZhangYXuJShenP 2005 Regulation of hunger-driven behaviors by neural ribosomal S6 kinase in Drosophila. Proc Natl Acad Sci U S A 102 13289 13294
29. IkeyaTGalicMBelawatPNairzKHafenE 2002 Nutrient-dependent expression of insulin-like peptides from neuroendocrine cells in the CNS contributes to growth regulation in Drosophila. Current Biology 12 1293 1300
30. HuangHTindallDJ 2007 Dynamic FoxO transcription factors. J Cell Sci 120 2479 2487
31. PuigOMattilaJ 2011 Understanding Forkhead box class O function: lessons from Drosophila melanogaster. Antioxid Redox Signal 14 635 647
32. BrunetABonniAZigmondMJLinMZJuoP 1999 Akt promotes cell survival by phosphorylating and inhibiting a Forkhead transcription factor. Cell 96 857 868
33. NielsenMDLuoXBiteauBSyversonKJasperH 2008 14-3-3 Epsilon antagonizes FoxO to control growth, apoptosis and longevity in Drosophila. Aging Cell 7 688 699
34. MatsuzakiHDaitokuHHattaMAoyamaHYoshimochiK 2005 Acetylation of Foxo1 alters its DNA-binding ability and sensitivity to phosphorylation. Proc Natl Acad Sci U S A 102 11278 11283
35. ParkJSongWJChungKC 2009 Function and regulation of Dyrk1A: towards understanding Down syndrome. Cell Mol Life Sci 66 3235 3240
36. KorenbergJRChenXNSchipperRSunZGonskyR 1994 Down syndrome phenotypes: the consequences of chromosomal imbalance. Proc Natl Acad Sci U S A 91 4997 5001
37. MaggeSNO'NeillKLShultsJStallingsVAStettlerN 2008 Leptin levels among prepubertal children with Down syndrome compared with their siblings. J Pediatr 152 321 326
38. MelvilleCACooperSAMcGrotherCWThorpCFCollacottR 2005 Obesity in adults with Down syndrome: a case-control study. J Intellect Disabil Res 49 125 133
39. ObiciSFengZKarkaniasGBaskinDGRossettiL 2002 Decreasing hypothalamic insulin receptors causes hyperphagia and insulin resistance in rats. Nat Neurosci 5 566 572
40. SipolsAJBaskinDGSchwartzMW 1995 Effect of intracerebroventricular insulin infusion on diabetic hyperphagia and hypothalamic neuropeptide gene expression. Diabetes 44 147 151
41. VargheseJLimSFCohenSM 2010 Drosophila miR-14 regulates insulin production and metabolism through its target, sugarbabe. Genes Dev 24 2748 2753
42. RulifsonEJKimSKNusseR 2002 Ablation of insulin-producing neurons in flies: growth and diabetic phenotypes. Science 296 1118 1120
43. MinKJYamamotoRBuchSPankratzMTatarM 2008 Drosophila lifespan control by dietary restriction independent of insulin-like signaling. Aging Cell 7 199 206
44. GronkeSClarkeDFBroughtonSAndrewsTDPartridgeL 2010 Molecular evolution and functional characterization of Drosophila insulin-like peptides. PLoS Genet 6 e1000857 doi:10.1371/journal.pgen.1000857
45. McLeodCJWangLWongCJonesDL 2010 Stem cell dynamics in response to nutrient availability. Current Biology 20 2100 2105
46. RootCMKoKIJafariAWangJW 2011 Presynaptic facilitation by neuropeptide signaling mediates odor-driven food search. Cell 145 133 144
47. RubinGMSpradlingAC 1982 Genetic transformation of Drosophila with transposable element vectors. Science 218 348 353
48. GriswoldAJChangKTRunkoAPKnightMAMinKT 2008 Sir2 mediates apoptosis through JNK-dependent pathways in Drosophila. Proc Natl Acad Sci U S A 105 8673 8678
49. Iijima-AndoKWuPDrierEAIijimaKYinJC 2005 cAMP-response element-binding protein and heat-shock protein 70 additively suppress polyglutamine-mediated toxicity in Drosophila. Proc Natl Acad Sci U S A 102 10261 10266
50. OhlmeyerJTKalderonD 1997 Dual pathways for induction of wingless expression by protein kinase A and Hedgehog in Drosophila embryos. Genes Dev 11 2250 2258
51. UenoKKohatsuSClayCForteMIsonoK 2006 Gsalpha is involved in sugar perception in Drosophila melanogaster. J Neurosci 26 6143 6152
52. BrandAHPerrimonN 1993 Targeted gene expression as a means of altering cell fates and generating dominant phenotypes. Development 118 401 415
53. XuKZhengXSehgalA 2008 Regulation of feeding and metabolism by neuronal and peripheral clocks in Drosophila. Cell Metab 8 289 300
54. WongRPiperMDBlancEPartridgeL 2008 Pitfalls of measuring feeding rate in the fruit fly Drosophila melanogaster. Nat Methods 5 214 215 author reply 215
55. AhnKJJeongHKChoiHSRyooSRKimYJ 2006 DYRK1A BAC transgenic mice show altered synaptic plasticity with learning and memory defects. Neurobiol Dis 22 463 472
56. TelemanAAHietakangasVSayadianACCohenSM 2008 Nutritional control of protein biosynthetic capacity by insulin via Myc in Drosophila. Cell Metab 7 21 32
Štítky
Genetika Reprodukční medicínaČlánek vyšel v časopise
PLOS Genetics
2012 Číslo 8
- Kazuistika – Perspektivy využití precizované medicíny v rámci personalizované specifické terapie onkologických pacientů
- Nobelova cena za chemii pro genetické nůžky: Objev, který změní naši budoucnost?
- Technologie na bázi RNA v klinické praxi: od přebarvených petúnií k terapii vzácných a dosud jen obtížně léčitelných chorob u lidí
- „Nepředstavovali jsme si, že náš výzkum povede přímo ke vzniku nových léků, dokonce ještě za našeho života“
- Bezplatné služby pro diagnostiku ATTRv amyloidózy pro kardiology
Nejčtenější v tomto čísle
- Dissecting the Gene Network of Dietary Restriction to Identify Evolutionarily Conserved Pathways and New Functional Genes
- It's All in the Timing: Too Much E2F Is a Bad Thing
- A Quantitative Comparison of the Similarity between Genes and Geography in Worldwide Human Populations
- Variation of Contributes to Dog Breed Skull Diversity
Zvyšte si kvalifikaci online z pohodlí domova
Mazová zátka a její řešení
nový kurzVšechny kurzy