
Altered DNA Methylation in Leukocytes with Trisomy 21
The primary abnormality in Down syndrome (DS), trisomy 21, is well known; but how this chromosomal gain produces the complex DS phenotype, including immune system defects, is not well understood. We profiled DNA methylation in total peripheral blood leukocytes (PBL) and T-lymphocytes from adults with DS and normal controls and found gene-specific abnormalities of CpG methylation in DS, with many of the differentially methylated genes having known or predicted roles in lymphocyte development and function. Validation of the microarray data by bisulfite sequencing and methylation-sensitive Pyrosequencing (MS-Pyroseq) confirmed strong differences in methylation (p<0.0001) for each of 8 genes tested: TMEM131, TCF7, CD3Z/CD247, SH3BP2, EIF4E, PLD6, SUMO3, and CPT1B, in DS versus control PBL. In addition, we validated differential methylation of NOD2/CARD15 by bisulfite sequencing in DS versus control T-cells. The differentially methylated genes were found on various autosomes, with no enrichment on chromosome 21. Differences in methylation were generally stable in a given individual, remained significant after adjusting for age, and were not due to altered cell counts. Some but not all of the differentially methylated genes showed different mean mRNA expression in DS versus control PBL; and the altered expression of 5 of these genes, TMEM131, TCF7, CD3Z, NOD2, and NPDC1, was recapitulated by exposing normal lymphocytes to the demethylating drug 5-aza-2′deoxycytidine (5aza-dC) plus mitogens. We conclude that altered gene-specific DNA methylation is a recurrent and functionally relevant downstream response to trisomy 21 in human cells.
Published in the journal:
. PLoS Genet 6(11): e32767. doi:10.1371/journal.pgen.1001212
Category:
Research Article
doi:
https://doi.org/10.1371/journal.pgen.1001212
Summary
The primary abnormality in Down syndrome (DS), trisomy 21, is well known; but how this chromosomal gain produces the complex DS phenotype, including immune system defects, is not well understood. We profiled DNA methylation in total peripheral blood leukocytes (PBL) and T-lymphocytes from adults with DS and normal controls and found gene-specific abnormalities of CpG methylation in DS, with many of the differentially methylated genes having known or predicted roles in lymphocyte development and function. Validation of the microarray data by bisulfite sequencing and methylation-sensitive Pyrosequencing (MS-Pyroseq) confirmed strong differences in methylation (p<0.0001) for each of 8 genes tested: TMEM131, TCF7, CD3Z/CD247, SH3BP2, EIF4E, PLD6, SUMO3, and CPT1B, in DS versus control PBL. In addition, we validated differential methylation of NOD2/CARD15 by bisulfite sequencing in DS versus control T-cells. The differentially methylated genes were found on various autosomes, with no enrichment on chromosome 21. Differences in methylation were generally stable in a given individual, remained significant after adjusting for age, and were not due to altered cell counts. Some but not all of the differentially methylated genes showed different mean mRNA expression in DS versus control PBL; and the altered expression of 5 of these genes, TMEM131, TCF7, CD3Z, NOD2, and NPDC1, was recapitulated by exposing normal lymphocytes to the demethylating drug 5-aza-2′deoxycytidine (5aza-dC) plus mitogens. We conclude that altered gene-specific DNA methylation is a recurrent and functionally relevant downstream response to trisomy 21 in human cells.
Introduction
It is now 5 decades since Down syndrome (DS) was first shown to result from trisomy 21 [1], [2], and some progress has been made toward understanding the genes that contribute to the complex array of DS phenotypes – mostly by studying the effects of the trisomy on transcriptional profiles in humans and mice and by creating transgenic and trans-chromosomal mouse models [3], [4]. We are still far from understanding the mechanisms that underlie the complex spectrum of phenotypes in DS. Survival in DS can range from death in utero to late adulthood; cardiac defects are present in about 40% of cases, while cognitive disability is invariably present but can range from mild to severe. Additionally, there are multiple blood cell-related phenotypes including leukemoid reactions and childhood leukemias, macrocytosis with or without anemia, a markedly increased incidence of autoimmune disorders, and increased susceptibility to recurrent bacterial and viral infections [5]–[10].
All of these abnormalities must ultimately reflect the downstream responses of human cells and tissues to the chromosome 21 aneuploidy. In theory, one mechanism by which cells might respond to changes in gene dosage is altered DNA methylation. Gain of methylation at cytosines in CpG dinucleotides in promoter-associated CpG islands (CGI's) can enforce dosage compensation in X-inactivation, and methylation in other types of CG-rich sequences including intragenic sequences and insulator elements can affect expression and hence functional gene dosage at imprinted loci. With these simple ideas in mind we set out to ask whether gains or losses of genomic DNA methylation might occur as a downstream consequence of trisomy 21 in blood cells from adults with DS. Studies profiling mRNA expression in cells and tissues with trisomy 21 have shown that while many genes on chromosome 21 are over-expressed, subsets of genes on other chromosomes also show consistently altered expression in this background due to gene-gene interactions (for example [11]–[15]). So in testing for epigenetic changes downstream of trisomy 21 it is important to examine the whole genome. Here we show that a small group of genes, distributed across various chromosomes and not over-represented on chromosome 21, are consistently altered by recurrent gains or losses of DNA methylation in PBL of adults with DS. For a subset of these genes we find altered mRNA expression in DS versus control blood cells, and we show that this altered expression can be recapitulated by exposing normal lymphocytes to the demethylating drug 5aza-dC.
Results
Microarray-based profiling of DNA methylation in DS versus control PBL
To begin to ask whether PBL from adults with DS might differ epigenetically from this same tissue in normal adults we first profiled DS and normal control samples for DNA methylation genome-wide on high density microarrays, using 2 complementary platforms: MSNP and Infinium BeadChip assays. The MSNP method adapts Affymetrix SNP arrays for methylation analysis by incorporating an initial methylation-sensitive restriction digestion [16], and queries the methylation status of CpG dinucleotides in HpaII restriction sites roughly equally spaced along all human chromosomes in intragenic and intergenic regions (26,800 SNP-tagged loci reliably informative for CpG methylation in this experiment; see Methods). In contrast, the Infinium methylation assay utilizes bisulfite conversion of the genomic DNA and queries the percent methylation at each of 27,000 CpG dinucleotides concentrated in promoter regions of 14,000 human genes. We used MSNP on 250 K StyI SNP arrays to compare 5 DS PBL samples (4 individuals; one sampled at 2 time points 6 years apart) to 7 normal control PBL (7 individuals). After calculating the methylation indices (MIs; see Materials and Methods) and carrying out non-supervised hierarchical clustering of these data we could not distinguish the DS from the control PBL samples, suggesting that trisomy 21 does not cause widespread changes in DNA methylation in PBL. However, when we analyzed the methylation values by ANOVA followed by supervised hierarchical clustering, we found small sets of candidate loci with consistent differences in methylation in DS versus normal PBL (Figure 1 and Table S1).

We applied Infinium BeadChip methylation assays to a larger set of PBL DNA samples, comparing 29 individuals with DS to 20 normal controls spanning the same age range. This larger dataset included all the samples that we had run by MSNP plus additional cases and controls. Similar to the findings with MSNP, non-supervised hierarchical clustering of the methylation values (percent methylation at each CpG queried by the array) showed no evidence for widespread alterations in DNA methylation in DS (not shown), but again ANOVA and supervised clustering produced a list of candidate differentially methylated loci (Figure 1 and Table S2). The differentially methylated loci in DS versus normal PBL from both of these microarray screens were found to be distributed on most of the human autosomes, with no specific enrichment for genes on chromosome 21 (Tables S1 and S2).
The reliability of the Illumina Infinium data was shown by extremely close correlations in technical replicates (examples of x-y plots and correlation coefficients in Figure S1). To further test reliability, and to ask whether the sets of differentially methylated loci clearly distinguish between DS and normal PBL we classified samples using a logistic ridge regression and validated the robustness of the classification scheme using leave-one-out cross-validation. Ridge regression was chosen for the ability of this approach to control for the colinearity of the independent variables. Leave-one-out cross-validation demonstrated that the differentially methylated loci from the Infinium screen classified DS versus normal PBL with 100% sensitivity and specificity. Strikingly, we initially observed one apparently mis-classified sample among the 29 cases of DS (asterisk in Figure 1), but this individual proved to have mosaic trisomy 21, with less than 50% trisomic (+21) cells by karyotype. None of the other individuals analyzed in the microarray experiments showed mosaicism.
This statistical approach was not suitable for the MSNP screen with the smaller set of samples, but we directly tested and validated the results for 3 differentially methylated loci from MSNP, as well as 7 loci from the Infinium screen, using bisulfite sequencing and/or MS-Pyroseq (see below). As a further technical consideration, single nucleotide polymorphisms (SNPs) in the regions probed by the Infinium assays can in principle complicate the results for a minor subset of loci. However, the absence of common annotated SNPs detected in the candidate regions from our screen (dbSNP; http://www.ncbi.nlm.nih.gov/), the representation of several of the differentially methylated loci by multiple probes on the BeadChips and, more directly, our successful direct independent validations by bisulfite sequencing and MS-Pyroseq (see below) indicated that most if not all of these loci are true positives.
Validations of the microarray data by bisulfite sequencing
Next we sought to validate the gene-specific differential methylation in the same DS cases and normal controls using the independent and definitive methods of combined bisulfite restriction analysis (COBRA) and bisulfite sequencing. These validations were successful for 10/10 loci chosen from the lists of differentially methylated genes that had passed our ANOVA and fold-change criteria in the microarray data (3 loci from the MSNP screen and 7 loci from the Infinium screen). Importantly, the bisulfite sequencing showed that for each gene the differential methylation affected not only the index CpG sites queried on the microarrays but also multiple adjacent CpG dinucleotides (examples in Figure 2, Figures S2, S3 and S4).

Validations of differential methylation in DS versus control PBL by MS-Pyroseq
We next sought to determine the frequency and specificity of differential methylation in a larger series of individuals. To this end we used MS-Pyroseq, which measures the percent methylation at multiple CpGs downstream of the sequencing primer. We applied this assay to 9 of the candidate loci. For 8 of these loci, TMEM131, TCF7, SH3BP2, SUMO3, CPT1B, CD3Z, EIF4E and PLD6 (LOC201164) we found strikingly different distributions of methylation values (percent methylation averaged over multiple contiguous CpGs) in DS compared to normal PBL (Table 1 and Figure 3 and Figure S2). The distributions of methylation values were largely dichotomous, with only minimal overlap between DS and controls, for TMEM131, PLD6, EIF4E, CPT1B and CD3Z, while for TCF7, SUMO3, and SH3BP2 the distributions were more overlapping but nonetheless showed a clear shift in the mean values in DS versus controls. For all of these genes the inter-group differences in methylation were highly statistically significant (p<.0001; Table 1). MS-Pyroseq for the ninth gene tested, FAM62C, revealed a wide range of methylation in both groups (DS and controls) but the distribution of methylation still differed significantly, albeit less strongly, between the 2 groups (Table 1). In summary MS-Pyroseq in the larger case-control series validated the differential methylation for each of these 9 candidate loci, 3 from MSNP and 6 from the Infinium assays, thus giving high confidence in the quality of the primary methylation profiling data.


Age-dependence and stability of the gene-specific differential methylation
As methylation is known to be age-dependent for certain DNA sequences in some human tissues including the immune system [17], for 8 of the independently validated differentially methylated genes we plotted the percent methylation in DS cases and controls as a function of age (Figure 3 and Figure S2). For TMEM131, the average percent methylation clearly declined with age in the normal controls, but was uniformly low regardless of age in the adults with DS (Figure 3). Despite the decline with age in the controls, and our deliberate sampling of PBL from both young and elderly control individuals, the levels of methylation in this region, corresponding to a CG-rich internal promoter sequence of the TMEM131 gene, never reached the very low levels seen in DS. Similar analyses showed that for all 8 candidate genes tested the difference in methylation between DS and controls was significant both before and after adjusting for age (Table 1). As we had collected PBL samples from several of the study participants with DS at multiple time points spanning from 6 months up to 7 years, we were further able to ask whether the methylation abnormalities were stable over time in these individuals. As shown in Table S3, the degree of methylation as determined by MS-Pyroseq was generally stable over time.
Mosaicism for trisomy 21 can be found in a minor subset of individuals with DS, and this finding has been associated with less severe phenotypes. The large majority of DS cases in our series had complete trisomy 21, but 3 cases (one of which was run on the Infinium BeadChips and all three of which were analyzed by MS-Pyroseq) showed moderate to high mosaicism with cells disomic for chromosome 21 constituting >15% of the leukocytes in the peripheral blood. While the rarity of these mosaic cases precluded a statistical analysis, as shown in Table S4 the cases with the greatest percentage of normal diploid cells (high level mosaics) showed methylation values closer to the normal range.
The abnormal DNA methylation in DS PBL is not due to altered cell counts
Abnormalities of B - and T-lineage lymphocytes, either functional, numerical or both, have been reported in children and adults with DS [18]–[25]. We therefore considered whether grossly altered blood cell differential counts with normal cell type-specific variation in DNA methylation might trivially account for our findings of altered methylation in DS. We first performed automated complete blood counts for 4 of the DS blood samples, all of which showed strongly reduced methylation of the internal promoter of TMEM131 and the upstream region of TCF7 and increased methylation of the upstream portion of the SH3BP2 CGI. We found that the numbers and percentages of polymorphonuclear leukocytes (PMNs) and total lymphocytes were all within the normal range for our clinical laboratory (Table S5). The percentages of monocytes were slightly increased (range in the 4 DS cases 6.4–11.9 percent; normal range 4–8 percent, Table S5) but as measurements of DNA methylation linearly average over all cells in a given sample, this slight increase in a minor cell population would not be sufficient to account for the altered methylation in DS PBL. We next fractionated several normal PBL samples into mononuclear cells (PBMCs) versus PMNs on Ficoll gradients and performed COBRA and MS-Pyroseq on the genomic DNAs. This analysis revealed cell type-specific methylation levels, but we found no evidence for differences in methylation of TMEM131, SH3BP2, EIF4E, or TCF7 between these 2 cell populations with a direction and magnitude that could account for the altered methylation observed in DS, even if cell numbers were altered (Figure 2A and Figure S4). Only for one of the differentially methylated genes, CD3Z, did we observe a difference in methylation in PBMC compared to PMN with a magnitude and direction that could possibly account for the observed differential methylation in DS versus normal PBL based on abnormal lymphocyte numbers. However, we were able to exclude this trivial explanation for CD3Z by showing that its CpG methylation is specifically altered in purified T-cells from DS versus controls (below). Lastly, given that one of the reported findings in adults with DS is an increase in the minor sub-population of T-lineage lymphocytes with the immunophenotype of natural killer (NK) cells, we did a further control assessing the methylation of TMEM131 in DNA from NK cells immunopurified from normal individuals. This analysis showed that the critical region of the TMEM131 gene is in fact slightly hypermethylated in normal NK cells; a pattern opposite to the hypomethylation seen in whole blood from DS (Figure 2A). Similar results excluding the possibility that the observed alterations in methylation might be trivially due to increased numbers of normal NK cells were obtained for the TCF7 and SH3BP2 genes (Figure S4).
Gene-specific abnormalities in DNA methylation in T-lymphocytes from DS
To directly assess CpG methylation within an important lymphocyte subset, we next prepared genomic DNA from T-cells immuno-purified from PBL of 12 individuals with DS and 15 control individuals, and measured SUMO3, CD3Z and SH3BP2 promoter methylation, as well as methylation of the TMEM131 internal promoter region, by MS-Pyroseq. This procedure confirmed that all of these loci are differentially methylated between DS and normal controls, not only in whole PBL but also in the T-cell preparations, thus arguing against our findings in DS PBL being trivially due to altered numbers of (epigenetically normal) T-cells (Figure S5). To obtain genome wide methylation data in this cell type, we next profiled promoter methylation in T-cell DNAs from 4 normal adults and 6 adults with DS for which sufficient DNA was available, using the Infinium BeadChips. Similar to our findings using total PBL, ANOVA followed by supervised clustering of the methylation values revealed a small set of differentially methylated loci (140 CpGs, located in 134 different genes) in this DS versus normal T-cell comparison (Figure 1 and Table S6). Among the 108 genes (118 probes) identified as differentially methylated in our Infinium data from DS versus normal total PBL, a large subset, 17 genes (19 probes), were also found to be differentially methylated in this genome-wide analysis with the T-cell preparations. This observation of gene-specific differential methylation in purified T-cells from DS versus control individuals further supports our conclusion that the epigenetic changes reported here reflect bona fide abnormalities within specific cell types and cannot be trivially accounted for by altered percentages of the major types of leukocytes.
Altered expression of TMEM131, TCF7, and NPDC1 in DS PBL
DNA methylation in cis-acting regulatory sequences can affect gene transcription, with hypermethylation of CG-rich promoter regions causing or consolidating transcriptional repression and methylation in insulator or repressor elements sometimes causing an opposite phenomenon of increased gene expression. Total RNA was available from some, though not all, of the PBL samples in this study, and we measured mRNA transcript levels in these samples by Q-PCR. As shown in Figure 4, isoform-specific Q-PCR revealed, as predicted, greater amounts of mRNA initiating from the internal promoter region of TMEM131 in the DS PBL samples (in which this region is relatively hypomethylated) compared to normal PBL (in which this region has substantial methylation). In contrast, expression of the longer TMEM131 mRNA isoform initiating from the upstream CGI-associated promoter, which was uniformly unmethylated in both DS and normal PBL, did not differ between these 2 groups (Figure S6). As a second example, NPDC1 was among the genes that showed consistent promoter hypomethylation in DS compared to normal PBL by the Infinium assays (Table S2) and Q-PCR for NPDC1 mRNA revealed that the DS PBL samples showed, on average, greater expression of this gene than the normal PBL samples (Figure 4). A third example was TCF7, for which Q-PCR revealed that DS PBL samples have, on average, significantly less expression of mRNA from this gene than the normal PBL samples (Figure 4). This somewhat unexpected finding suggested that the evolutionarily conserved region 5 kb upstream of the TCF7 promoter, which is hypomethylated in many of the DS PBL samples (Table 1, Figure 3 and Figure S2), might be acting as a negative regulatory element with greater repressive function when hypomethylated. Further insight was obtained by assessing DNA methylation directly at the upstream border of the promoter-associated CGI of this gene by MS-Pyroseq, which revealed a statistically significant tendency toward hypermethylation in DS compared to normal PBL (Figure S7). Thus individuals with DS often have substantial hypomethylation of the conserved region 5 kb upstream of the TCF7 transcriptional initiation site, and also show a significant though weaker trend toward hypermethylation of the upstream border of the TCF7 CGI, located closer to the transcription initiation site.

Overall, these data are consistent with regulation of mRNA expression at these 3 loci by DNA methylation – a conclusion further supported by functional experiments using a demethylating drug (below). However, in interpreting the relatively wide range of expression in the primary PBL samples it is important to take into account that the TMEM131, TCF7 and NPDC1 genes are all known to be highly inducible in response to signaling in NK cells and probably in other lymphocyte classes (microarray data in NCBI/GEO, accessions GDS751 and ref. [26]), so the net expression in a given sample is likely determined by the interaction between acute environmental signals (cytokines and cell-cell interactions) and the baseline methylation status of the locus. Consistent with the acute inducibility of these genes and hence the wide range of expression in primary blood samples from both DS and normal individuals, the differences in expression that we observed were highly statistically significant in the overall comparisons between DS and normal controls (Figure 4), and hence correlated strongly on average with the extent of methylation, but we could not detect strong correlations between the extent of methylation and the expression level among individuals within each group.
Recapitulation of the abnormal gene expression by exposing normal human T-cells to the demethylating drug 5aza-dC
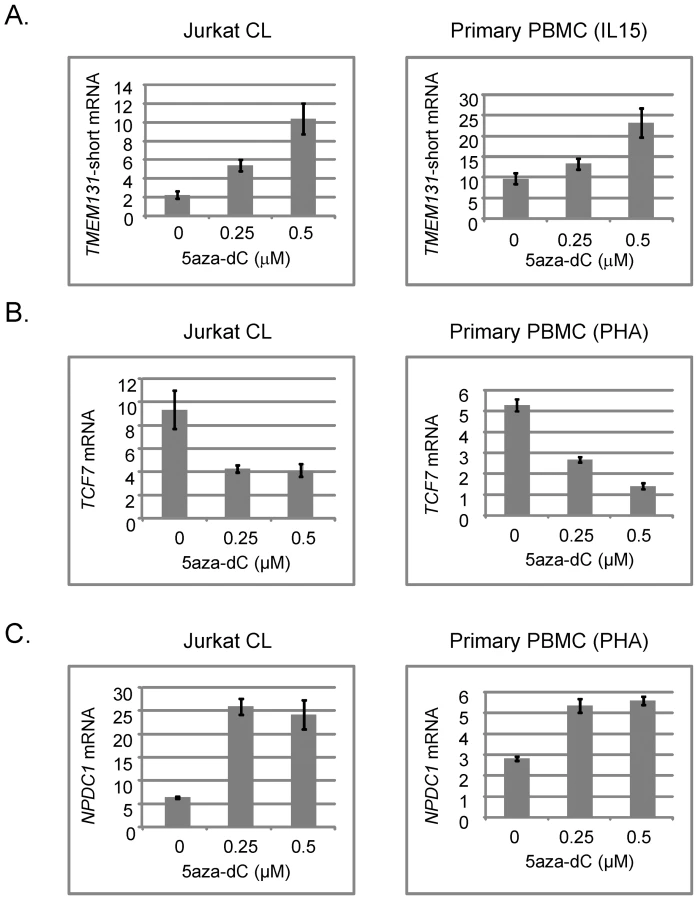
To test more directly for a functional relationship of methylation with alterations in gene expression we examined TMEM131, TCF7, NOD2, SUMO3, CPT1B, CD3Z and NPDC1 mRNA expression in a well controlled cell culture system using the demethylating drug 5aza-dC. We exposed a proliferating T-cell line (Jurkat) and, more importantly, normal PBMCs isolated from fresh peripheral blood samples and expanded with a cytokine (IL-15) that induces proliferation of cytotoxic T-lymphocytes and NK cells, or with a general T-cell mitogen (phytohemaglutinin; PHA), to 5aza-dC for 3 days. We then prepared DNA and RNA from these cells and measured DNA methylation and mRNA expression of these 7 genes. In the absence of drug we found more robust expression of TMEM131 when the PBMCs were expanded with IL-15, while expression of TCF7, NOD2 and NPDC1 was higher when these cells were expanded with PHA. All 4 genes were readily detected in the proliferating Jurkat cells without cytokines. In experiments using the appropriate mitogens (IL-15 for analyzing TMEM131 and PHA for analyzing TCF7, NOD2 and NPDC1) we found that TMEM131 short isoform mRNA, NOD2 mRNA and NPDC1 mRNA levels increased, while TCF7 mRNA levels decreased, as a function of exposure to 5aza-dC, both in the Jurkat cells and in the primary PBMCs (Figure 5 and Figure 6). Also shown in Figure 6 are our independent validations of the Infinium data for NOD2 by bisulfite sequencing, which confirm the relative loss of methylation in T-cells from DS patients, compared to T-cells of normal adults in the (non-CGI) promoter region of this gene. These data are consistent with a functional role for DNA methylation in modulating the expression of these genes in lymphocytes (and possibly in monocytes as well) and for the 3 genes from the PBL screen the directions of their changes in expression upon demethylation (increased for TMEM131 and NPDC1 and decreased for TCF7) match the predictions based on the differences of their average expression levels in DS versus normal PBL (Figure 4). For another two genes, NOD2 and CD3Z, our analysis of mRNA expression is still in progress but the aggregate results so far are consistent with these two genes being functionally regulated by promoter methylation. The DNA methylation data (both genes hypomethylated in DS T-cells compared to normal T-cells) and 5aza-dC response (significantly increased expression of both genes on exposure of normal PHA-stimulated PBMC to the demethylating drug) are consistent with a functional role for CpG methylation in down-modulating expression of these genes in normal T-cells (Figure 6 and data not shown). Furthermore, in a small number of purified T-cell samples analyzed so far (7 DS T-cell and 8 normal T-cell preparations) both of these genes are over-expressed on average in the DS T-cells compared to normal T-cells (2-fold for NOD2 and 2.5-fold for CD3Z). However, these Q-PCR data have shown high inter-sample variability and have not yet reached statistical significance by T-tests.

In contrast to the positive data obtained for TMEM131, TCF7, NOD2, CD3Z and NPDC1, the two remaining differentially methylated genes that we tested, SUMO3 and CPT1B, have shown negative data or paradoxical correlations between CpG methylation, mRNA expression and response to 5aza-dC. For the SUMO3 gene, located on chromosome 21, we found by Q-PCR that the mean expression level in DS PBL is about 1.5-fold greater than in normal PBL, thus being consistent with a simple physical gene dosage effect, with no obvious compensatory effect of the promoter hypermethylation (data not shown). For the CPT1B gene Q-PCR revealed a paradoxical correlation between promoter hypermethylation and significant over-expression of CPT1B mRNA in DS PBL. This paradoxical relationship was not clarified by examining the response of CPT1B transcription to 5aza-dC, as the demethylating drug caused a slight increase, not a decrease, in its mRNA levels both in Jurkat cells and in normal PBMC (data not shown).
Discussion
The primary cause of DS, namely trisomy 21, has been known since 1959, but the pathogenesis of the diverse phenotypic features of this syndrome, not only in brain and cardiac development but also in a range of blood cell-related phenotypes including macrocytic anemia, autoimmunity, and recurrent infections, remains incompletely understood. Profiling of mRNA in cells and tissues with +21 has revealed widespread changes in gene expression, mostly small in magnitude, both for genes on chromosome 21 and for large groups of genes on other chromosomes. However sorting out the importance of any given gene has been difficult. Mice with partial trisomies, transgenic mice, and recently mice engineered to carry human chromosome 21, are useful experimental tools for assigning or excluding roles of specific genes and regions on chromosome 21 in conferring the diverse features of DS [27]. But additional experimental approaches are needed to understand the complex genomic, cellular and tissue response to this simple chromosomal aneuploidy.
Previously Chango et al. used a combination of methylation-sensitive arbitrarily primed polymerase chain reaction (MS-AP-PCR) and quantitation of DNA fragments to find 6 fragments that were hypermethylated in PBL from 8 individuals with DS, compared to 8 normal controls [28]. The authors suggested that the observed differences might provide a mechanism to silence constitutively over expressed genes in DS, but the methods did not allow the DNA sequence of these fragments to be determined. Here we have taken a genome-wide screening approach using 2 independent platforms that are entirely distinct in how they query methylation and are complementary and largely non-overlapping in their coverage of CpG sites. MSNP uses methylation-sensitive restriction digestion as the initial step to query the methylation status of CpG dinucleotides in HpaII restriction sites in intragenic and intergenic regions, most of which are not promoter-associated; in contrast the Infinium methylation assay utilizes bisulfite conversion of the genomic DNA as the initial step and queries the percent methylation of CpG's in promoter regions, including many CpG islands as well as a large number of non-island promoter sequences. These genome-wide microarray-based screens, with validations by independent methods in a larger series of DS cases and controls, show that there are highly recurrent gene-specific epigenetic changes in this common chromosomal disorder.
Our results are from analyzing blood cells, so it is important to consider what is known about the effects of trisomy 21 in this cell lineage. There are indications from studying mosaicism over time that trisomy 21 is weakly but continually selected against in hematopoietic cells [29]–[31]. Related findings in well controlled mouse models include strongly reduced growth capacity of bone marrow stem cells in the partial trisomy Ts65Dn model of DS [32], defects in hematopoietic progenitor cells and macrocytosis in a related partial trisomy mouse model, Ts1Cje [33], as well as hematopoietic abnormalities in the more recently created Tc1 trans-chromosomal model [34]. Combining these observations with our current data, one possibility is that there may be biological selection over time for specific patterns of altered DNA methylation in hematopoietic stem/progenitor cells that affect net cellular proliferation in this aneuploid genetic background. Ongoing biological selection acting on stochastic variations in DNA methylation could result in altered DNA methylation, as observed here, and changes in biological properties, such as the reported functional abnormalities in NK cells [22]. In considering alternative explanations for our findings, major changes in the DNA methylation machinery are less likely, given that the microarray data show only gene-specific and not widespread alterations in DNA methylation.
Immunological abnormalities are prominent in DS, and many of the differentially methylated genes in Table 1, Tables S1 and S2 have known or predicted roles in the immune system. Among the genes that we have focused on for downstream analyses in this study several (TCF7, SH3BP2, CD3Z and NOD2) are already known to be essential for normal lymphocyte development and function, while another group (TMEM131, PLD6, NPDC1and EIF4E) are interesting candidates for such a role. TMEM131 methylation in the internal promoter region is strikingly and consistently different in DS versus normal PBL, and this gene, encoding a transmembrane protein, has been shown to be cytokine-inducible in NK cells, together with another gene that we have studied here, NPDC1 (microarray data in NCBI/GEO, accession GDS751; ref. [26]). These genes are therefore intriguing biological candidates for contributing to the pathogenesis of NK cell defects in DS. Little information is available on the function of TMEM131 but this gene was reported to be sharply up-regulated between the multipotent progenitor and pro-T cell stages of differentiation, along with only a few other genes, strikingly including another gene which we have shown here to be abnormally methylated in DS, namely the transcription factor gene TCF7 [35], which is known to be essential for normal NK cell function [36]–[39]. While these genes are evidently co-regulated in development, they can respond oppositely to acute exposures to cytokines: expression of TMEM131 and NPDC1 in NK cells is up-regulated by IL-2/PHA while TCF7 expression is down-regulated (microarray data in NCBI/GEO accession GDS751 [26]). This fact is interesting in view of the inverse abnormalities in expression of TMEM131 and NPDC1 (increased) compared to TCF7 (decreased) in DS PBL, which is paralleled by the inverse responses of these genes to DNA demethylation in our experiments using 5aza-dC.
Considering the possible functions of some of the other differentially methylated genes, NOD2 encodes a pathogen recognition receptor that is often studied in monocytes and macrophages but it is also expressed by CD34+ hematopoietic stem/progenitor cells and FOXP3-positive T regulatory cells [40]. SH3BP2 codes for a pleckstrin homology domain - and Src homology 2 (SH2) domain-containing adaptor protein that is preferentially expressed in hematopoietic tissues including macrophages, NK, T-, and B-cells. It is involved in leukocyte signaling downstream Src/Syk-kinases and plays a crucial role in signaling during cell differentiation [41]. PLD6, encoding a member of the phospholipase-D family, has not yet been studied for its role in lymphocyte physiology but other phospholipase-D family members are known to be crucial for signaling downstream of the T-cell receptor [42]. EIF4E, encoding a translational initiation factor that is rate-limiting for expression of numerous proliferation-related cellular proteins, is up-regulated during T-cell activation and promotes lymphocyte chemotaxis [43], [44]. SUMO3 is one of a family of small sumo proteins that modify the activities of other cellular proteins by post-translational sumoylation – a process that is known to affect lymphocyte physiology including regulation of immunoglobulin production by B-cells [45] and mitogenesis and cytokine production in T-cells [46], [47]. The biological role of the protein encoded by the NPDC1 gene is not yet known, and knockout mice lacking this gene did not show an obvious developmental phenotype [48]. Based on our findings of altered methylation and expression of this gene in DS PBL, and the observation of its induction during NK cell activation noted above, it would be interesting to study immune system function in the Npdc1-deficient mice. Tables S1 and S2 contain additional examples of differentially methylated genes encoding cytokines, receptors and transcription factors that also warrant examination for roles in the normal immune system and in the immunological abnormalities associated with DS.
In summary, our findings show that recurrent gene-specific alterations in CpG methylation are a stereotypical cellular response to trisomy 21, with functional consequences in gene regulation. Interesting gene candidates for the immune dysfunction in DS are already emerging from these data, and as insights from studying DS as a model system have often shed light on physiological mechanisms in the general population it will also be important to dissect the roles in the normal immune system of the genes from our screen. Additional screens, including analysis of other tissues such as heart and brain, will be useful for pinpointing loci that are recurrently altered by gains or losses of DNA methylation in other cell types that contribute to key aspects of DS such as cardiac defects and cognitive disability. A more general corollary of our findings, beyond trisomy 21, is that there may be recurrent and predictable epigenetic consequences of other chromosomal copy number aberrations - for example in several types of human cancers, such as leukemias, Wilms tumors, and sarcomas, that frequently have simple aneuploid karyotypes.
Materials and Methods
Study subjects and diagnosis
This study was approved by Institutional Review Boards of the New York State Institute for Basic Research and Columbia University Medical Center. Participants with DS were ascertained through the New York State developmental disability service system as well as agencies in New Jersey, Connecticut and Northern Pennsylvania and have been assessed comprehensively including full medical chart reviews. The participants were recruited through responsible state and private service agencies, who contacted the participant's families or correspondents for permission for us to recruit. Informed consent was provided by either a parent or correspondent, and assent was obtained from the participant. The distribution of age, level of intellectual disability and residential placement did not differ between those participating and those who refused. Age-matched control participants were laboratory volunteers and participants in the Washington Heights-Inwood Community Aging Project who gave informed consent for genetic studies. Confirmation of trisomy 21 by G-banded karyotypes was available for 98% of the study participants with DS, with 100% concordance between cytogenetics and the clinical diagnosis of DS. Of those karyotyped, the large majority had complete trisomy 21. However, 7 cases exhibited low level mosaicism with most of the cells having trisomy 21 and less than 15% of the cells showing a diploid chromosome complement, 3 cases showed higher level mosaicism with greater than 15 percent of cells having 46 chromosomes (disomic for chromosome 21) and six cases presented with Robertsonian translocations, which in each case produced complete trisomy for the euchromatic region of chromosome 21 in all cells.
MSNP and Infinium assays for profiling DNA methylation
MSNP on Affymetrix 250 K StyI arrays was carried out essentially as previously described [16], [49], [50]. Each biological sample (total peripheral blood leukocyte DNA) was analyzed by hybridizing the arrays with genomic representations (probes) made according to the Affymetrix protocol, with the following pre-digestions of the genomic DNA as the first step in the procedure: StyI (S), StyI+HpaII (SH), StyI+MspI (SM). All other steps subsequent to the genomic pre-digestions were according to the Affymetrix protocol. The S, and SH representations were prepared and hybridized in duplicate for each biological sample; the SM representations were single for each sample. Infinium Human Methylation27 BeadChip (Illumina) assays, based on bisulfite conversion of genomic DNA followed by primer extension on the BeadChips to query the methylation status of defined CpG dinucleotides, were performed according to the protocol from the manufacturer.
Microarray data analysis
The MSNP data (.cel files) were processed in dChip ([51]; http://biosun1.harvard.edu/complab/dchip/) by normalization, model-based expression, and chromosome analysis. We assigned a numerical ploidy of 2 to the S arrays from the normal PBL samples, leaving the ploidy field blank for all other arrays. This strategy allowed us to visualize, using the chromosome view in dChip, the methylation status of HpaII sites flanking a given SNP-tagged locus as the extent of reduction in signal intensity in the SH representations, compared to the S representations. As MspI is the methylation-insensitive isoschizomer of HpaII, the signal intensities observed in the SM representations allowed us to determine the reliability of the Class 2 SNPs (those with adjacent HpaII sites thus informative for methylation status [16], [49], [50]), with reliable Affymetrix probe sets indicated by strong reduction in signal in SM compared to S. For the 26,800 Class 2 loci with SMav/Sav<0.5 we calculated the methylation index (MI) as the fractional preservation of intensity in SH compared to S. Similar lists of candidate differentially methylated genes were obtained when we first subtracted SMav as background and then calculated the methylation index.
The Infinium BeadChip data were processed using Genome Studio software, which calculates the percent methylation at each CpG queried by the arrays. The numerical values for methylation index (MSNP) and percent methylation (Infinium) were imported to dChip as external data and analyzed by ANOVA and supervised hierarchical clustering after removing all probes for genes on the X or Y chromosome, and applying fold-change and absolute difference criteria (Results and Figure 1 legend). To statistically validate the Infinium data we classified DS versus normal PBL using the % methylation of the differentially methylated loci in Table S2 using a logistic ridge regression. The ridge parameter was set to 10−8. Leave-one-out cross-validation was used to demonstrate that the classifier was not over trained to our particular test samples. The ridge regression, sensitivity, and specificity calculations were performed using Weka 3.4.
COBRA, bisulfite sequencing, and MS-Pyroseq
Genomic DNA, 0.6 to 1 microgram, was bisulfite-converted using the EpiTect Bisulfite Kit (QIAGEN) according to the instructions of the manufacturer. Sequences including or adjacent to the index SNPs or Infinium CpG dinucleotides were amplified by PCR, using primers designed in MethPrimer [52]. PCR conditions, primer sequences, and corresponding unconverted genomic sequences are in Table S7. For COBRA we identified restriction sites in the converted sequences that differed according to methylation status of specific CpG dinucleotides and we digested the bisulfite PCR products with these enzymes followed by electrophoresis on 1.5% agarose gels. For bisulfite sequencing the PCR products were cloned using the TopoTA Cloning System (Invitrogen) and >12 plasmids sequenced for each gene in a given individual. MS-Pyroseq was performed by bisulfite converting genomic DNA samples, followed by PCR with gene-specific primers (designed in MethPrimer) and Pyrosequencing of the resulting PCR products at EpigenDx (Worcester, MA) using a Qiagen PSQ instrument. The methylation indices from MS-Pyroseq were calculated as the average percent methylation of ≥8 successive CpG dinucleotides between the primers (Table S7).
Quantitative reverse transcription PCR (Q-PCR)
Q-PCR was performed using a 7300 Fast Real-Time PCR System (Applied Biosystems). Reactions were performed in triplicate in 96-well optical reaction plates. Each reaction contained cDNA reverse transcribed from 5 ng total RNA, 1X Power SYBR Green PCR master mix (Applied Biosystems) and 0.2 µM of each specific primer pair, which were designed using online D-Lux (Invitrogen) or Primer Express 3.0 software (Applied Biosystems). The thermal cycling conditions were primer annealing at 50°C for 2 min and an initial denaturation for 10 min at 95°C, followed by 40 cycles of 15 s at 95°C for denaturation and 1 min at 60°C for annealing and extension. The relative expression level of a target gene in a particular sample was calculated by the delta-CT method as described [53].
Purification of NK cells and T-cells
NK cells were purified from human blood to >90% purity using immunomagnetic beads as previously described [54]. T-cells were isolated from blood of adults with DS and normal adult controls to >80% purity using a RosetteSep Kit (Sigma) according to the manufacturer's instructions.
Supporting Information
Zdroje
1. LejeuneJ
GautierM
TurpinR
1959 Study of somatic chromosomes from 9 mongoloid children. C R Hebd Seances Acad Sci 248 1721 1722
2. LejeuneJ
TurpinR
GautierM
1959 Mongolism; a chromosomal disease (trisomy). Bull Acad Natl Med 143 256 265
3. WisemanFK
AlfordKA
TybulewiczVL
FisherEM
2009 Down syndrome—recent progress and future prospects. Hum Mol Genet 18 R75 83
4. AntonarakisSE
EpsteinCJ
2006 The challenge of Down syndrome. Trends Mol Med 12 473 479
5. NespoliL
BurgioGR
UgazioAG
MaccarioR
1993 Immunological features of Down's syndrome: a review. J Intellect Disabil Res 37 Pt 6 543 551
6. KarlssonB
GustafssonJ
HedovG
IvarssonSA
AnnerenG
1998 Thyroid dysfunction in Down's syndrome: relation to age and thyroid autoimmunity. Arch Dis Child 79 242 245
7. Du VivierA
MunroDD
1975 Alopecia areata, autoimmunity, and Down's syndrome. Br Med J 1 191 192
8. GillespieKM
DixRJ
WilliamsAJ
NewtonR
RobinsonZF
2006 Islet autoimmunity in children with Down's syndrome. Diabetes 55 3185 3188
9. BookL
HartA
BlackJ
FeoloM
ZoneJJ
2001 Prevalence and clinical characteristics of celiac disease in Downs syndrome in a US study. Am J Med Genet 98 70 74
10. WachtelTJ
PueschelSM
1991 Macrocytosis in Down syndrome. Am J Ment Retard 95 417 420
11. RozovskiU
Jonish-GrossmanA
Bar-ShiraA
OchshornY
GoldsteinM
2007 Genome-wide expression analysis of cultured trophoblast with trisomy 21 karyotype. Hum Reprod 22 2538 2545
12. PrandiniP
DeutschS
LyleR
GagnebinM
Delucinge VivierC
2007 Natural gene-expression variation in Down syndrome modulates the outcome of gene-dosage imbalance. Am J Hum Genet 81 252 263
13. LiCM
GuoM
SalasM
SchupfN
SilvermanW
2006 Cell type-specific over-expression of chromosome 21 genes in fibroblasts and fetal hearts with trisomy 21. BMC Med Genet 7 24
14. MaoR
WangX
SpitznagelELJr
FrelinLP
TingJC
2005 Primary and secondary transcriptional effects in the developing human Down syndrome brain and heart. Genome Biol 6 R107
15. GiannoneS
StrippoliP
VitaleL
CasadeiR
CanaiderS
2004 Gene expression profile analysis in human T lymphocytes from patients with Down Syndrome. Ann Hum Genet 68 546 554
16. KerkelK
SpadolaA
YuanE
KosekJ
JiangL
2008 Genomic surveys by methylation-sensitive SNP analysis identify sequence-dependent allele-specific DNA methylation. Nat Genet 40 904 908
17. IssaJP
2003 Age-related epigenetic changes and the immune system. Clin Immunol 109 103 108
18. de HinghYC
van der VossenPW
GemenEF
MulderAB
HopWC
2005 Intrinsic abnormalities of lymphocyte counts in children with down syndrome. J Pediatr 147 744 747
19. MaccarioR
UgazioAG
NespoliL
AlberiniC
MontagnaD
1984 Lymphocyte subpopulations in Down's syndrome: high percentage of circulating HNK-1+, Leu 2a+ cells. Clin Exp Immunol 57 220 226
20. AnnerenG
MagnussonCG
LiljaG
NordvallSL
1992 Abnormal serum IgG subclass pattern in children with Down's syndrome. Arch Dis Child 67 628 631
21. LohRK
HarthSC
ThongYH
FerranteA
1990 Immunoglobulin G subclass deficiency and predisposition to infection in Down's syndrome. Pediatr Infect Dis J 9 547 551
22. CossarizzaA
OrtolaniC
FortiE
MontagnaniG
PaganelliR
1991 Age-related expansion of functionally inefficienT-cells with markers of natural killer activity in Down's syndrome. Blood 77 1263 1270
23. NobleRL
WarrenRP
1988 Analysis of blood cell populations, plasma zinc and natural killer cell activity in young children with Down's syndrome. J Ment Defic Res 32 Pt 3 193 201
24. MahmoudSA
Lowery-NordbergM
ChenH
ThurmonT
UrsinS
2005 Immune defects in subjects with dysmorphic disorders. Allergy Asthma Proc 26 373 381
25. NurmiT
HuttunenK
LassilaO
HenttonenM
SakkinenA
1982 Natural killer cell function in trisomy-21 (Down's syndrome). Clin Exp Immunol 47 735 741
26. HannaJ
BechtelP
ZhaiY
YoussefF
McLachlanK
2004 Novel insights on human NK cells' immunological modalities revealed by gene expression profiling. J Immunol 173 6547 6563
27. TybulewiczVL
FisherEM
2006 New techniques to understand chromosome dosage: mouse models of aneuploidy. Hum Mol Genet 15 Spec No 2 R103 109
28. ChangoA
Abdennebi-NajarL
TessierF
FerreS
DoS
2006 Quantitative methylation-sensitive arbitrarily primed PCR method to determine differential genomic DNA methylation in Down Syndrome. Biochem Biophys Res Commun 349 492 496
29. JenkinsEC
SchupfN
GenoveseM
YeLL
KapellD
1997 Increased low-level chromosome 21 mosaicism in older individuals with Down syndrome. Am J Med Genet 68 147 151
30. PercyME
MarkovicVD
DaltonAJ
McLachlanDR
BergJM
1993 Age-associated chromosome 21 loss in Down syndrome: possible relevance to mosaicism and Alzheimer disease. Am J Med Genet 45 584 588
31. WilsonMG
TownerJW
ForsmanI
1980 Decreasing mosaicism in Down's syndrome. Clin Genet 17 335 340
32. JablonskaB
FordD
TrislerD
PessacB
2006 The growth capacity of bone marrow CD34 positive cells in culture is drastically reduced in a murine model of Down syndrome. C R Biol 329 726 732
33. CarmichaelCL
MajewskiIJ
AlexanderWS
MetcalfD
HiltonDJ
2009 Hematopoietic defects in the Ts1Cje mouse model of Down syndrome. Blood 113 1929 1937
34. AlfordK
SlenderA
VanesL
LiZ
FisherEM
Perturbed hematopoiesis in the Tc1 mouse model of Down Syndrome. Blood
35. TydellCC
David-FungES
MooreJE
RowenL
TaghonT
2007 Molecular dissection of prethymic progenitor entry into the T lymphocyte developmental pathway. J Immunol 179 421 438
36. HeldW
KunzB
Lowin-KropfB
van de WeteringM
CleversH
1999 Clonal acquisition of the Ly49A NK cell receptor is dependent on the trans-acting factor TCF-1. Immunity 11 433 442
37. KunzB
HeldW
2001 Positive and negative roles of the trans-acting T cell factor-1 for the acquisition of distinct Ly-49 MHC class I receptors by NK cells. J Immunol 166 6181 6187
38. IoannidisV
KunzB
TanamachiDM
ScarpellinoL
HeldW
2003 Initiation and limitation of Ly-49A NK cell receptor acquisition by T cell factor-1. J Immunol 171 769 775
39. GuoY
MaillardI
ChakrabortiS
RothenbergEV
SpeckNA
2008 Core binding factors are necessary for natural killer cell development and cooperate with Notch signaling during T-cell specification. Blood 112 480 492
40. RahmanMK
MidtlingEH
SvingenPA
XiongY
BellMP
TungJ
SmyrkT
EganLJ
FaubionWAJr
2010 The pathogen recognition receptor NOD2 regulates human FOXP3+ T cell survival. J Immunol 184 7247 7256
41. ChenG
DimitriouID
La RoseJ
IlangumaranS
YehWC
DoodyG
TurnerM
GommermanJ
RottapelR
2007 The 3BP2 adapter protein is required for optimal B-cell activation and thymus-independent type 2 humoral response. Mol Cell Biol 8 3109 3122
42. MorA
CampiG
DuG
ZhengY
FosterDA
2007 The lymphocyte function-associated antigen-1 receptor costimulates plasma membrane Ras via phospholipase D2. Nat Cell Biol 9 713 719
43. MaoX
GreenJM
SaferB
LindstenT
FredericksonRM
1992 Regulation of translation initiation factor gene expression during human T cell activation. J Biol Chem 267 20444 20450
44. MurookaTT
RahbarR
PlataniasLC
FishEN
2008 CCL5-mediated T-cell chemotaxis involves the initiation of mRNA translation through mTOR/4E-BP1. Blood 111 4892 4901
45. DobrevaG
DambacherJ
GrosschedlR
2003 SUMO modification of a novel MAR-binding protein, SATB2, modulates immunoglobulin mu gene expression. Genes Dev 17 3048 3061
46. TeruiY
SaadN
JiaS
McKeonF
YuanJ
2004 Dual role of sumoylation in the nuclear localization and transcriptional activation of NFAT1. J Biol Chem 279 28257 28265
47. GaraudeJ
FarrasR
BossisG
CharniS
PiechaczykM
2008 SUMOylation regulates the transcriptional activity of JunB in T lymphocytes. J Immunol 180 5983 5990
48. EvrardC
CaronS
RougetP
2004 Functional analysis of the NPDC-1 gene. Gene 343 153 163
49. JiangL
GondaT
GambleM
SalasM
SeshanV
2008 Global hypomethylation of genomic DNA in cancer-associated myofibroblasts. Cancer Res 68 9900 9908
50. YuanE
HaghighiF
WhiteS
CostaR
McMinnJ
2006 A single nucleotide polymorphism chip-based method for combined genetic and epigenetic profiling: validation in decitabine therapy and tumor/normal comparisons. Cancer Res 66 3443 3451
51. LinM
WeiLJ
SellersWR
LieberfarbM
WongWH
2004 dChipSNP: significance curve and clustering of SNP-array-based loss-of-heterozygosity data. Bioinformatics 20 1233 1240
52. LiLC
DahiyaR
2002 MethPrimer: designing primers for methylation PCRs. Bioinformatics 18 1427 1431
53. LivakKJ
SchmittgenTD
2001 Analysis of relative gene expression data using real-time quantitative PCR and the 2(-Delta Delta C(T)) Method. Methods 25 402 408
54. HattaK
van den HeuvelMJ
CroyBA
2009 NK cells detect changes in adaptive immunity within mouse decidua from gestation day eight. Placenta 30 501 506
Štítky
Genetika Reprodukční medicínaČlánek vyšel v časopise
PLOS Genetics
2010 Číslo 11
- Kazuistika – Perspektivy využití precizované medicíny v rámci personalizované specifické terapie onkologických pacientů
- Nobelova cena za chemii pro genetické nůžky: Objev, který změní naši budoucnost?
- Technologie na bázi RNA v klinické praxi: od přebarvených petúnií k terapii vzácných a dosud jen obtížně léčitelných chorob u lidí
- „Nepředstavovali jsme si, že náš výzkum povede přímo ke vzniku nových léků, dokonce ještě za našeho života“
- Bezplatné služby pro diagnostiku ATTRv amyloidózy pro kardiology
Nejčtenější v tomto čísle
- Genome-Wide Association Study Identifies Two Novel Regions at 11p15.5-p13 and 1p31 with Major Impact on Acute-Phase Serum Amyloid A
- Analysis of the 10q11 Cancer Risk Locus Implicates and in Human Prostate Tumorigenesis
- The Parental Non-Equivalence of Imprinting Control Regions during Mammalian Development and Evolution
- Genome-Wide Effects of Long-Term Divergent Selection
Zvyšte si kvalifikaci online z pohodlí domova
Mazová zátka a její řešení
nový kurzVšechny kurzy