
Evidence for Community Transmission of Community-Associated but Not Health-Care-Associated Methicillin-Resistant Strains Linked to Social and Material Deprivation: Spatial Analysis of Cross-sectional Data
Community associated MRSA variants, rather than hospital associated ones, are more readily transmitted and this is where control programs should focus to limit both hospital and community infections.
Published in the journal:
. PLoS Med 13(1): e32767. doi:10.1371/journal.pmed.1001944
Category:
Research Article
doi:
https://doi.org/10.1371/journal.pmed.1001944
Summary
Community associated MRSA variants, rather than hospital associated ones, are more readily transmitted and this is where control programs should focus to limit both hospital and community infections.
Introduction
In recent years, systematic health inequalities and the uneven distribution of adverse health outcomes have been found to affect a wide array of infectious diseases, not just chronic diseases or signature infections of social determinants such as tuberculosis or human immunodeficiency virus (HIV) [1–3]. In 2004, a study in the UK showed that the incidence of postoperative infection with methicillin-resistant Staphylococcus aureus (MRSA) was 7-fold higher in patients whose residential postcode was located in the most deprived areas [4]. Following the recognition that individuals with lower socioeconomic status are disproportionately affected by infections in every European Union member state [1], addressing the social determinants of infectious diseases has become a public health priority in recent years [5,6].
The epidemiology of MRSA is complex, particularly given the coexistence of two genetically and epidemiologically distinct classifications. Until the emergence of community-associated MRSA (CA-MRSA) in the late 1990s [7,8], infection was predominantly due to health-care-associated (HA) strains associated with advanced age, comorbidities, surgical procedures, or indwelling medical devices [9–12]. CA-MRSA later emerged as a cause of infection in the community in previously healthy individuals of all ages, with no history of hospital contact and none of the risk profiles that are typical of health care exposure [7,8]. Recently, however, CA-MRSA strains have emerged as a cause of health-care-associated infection in some parts of the world [13], challenging definitions of CA-MRSA based on clinical epidemiology and where disease manifests [14–16] in favour of genotype-based definitions [17–19]. Nonetheless, CA-MRSA strains retain a number of important characteristics, notably the association with infection in previously healthy individuals in the community [7,8,12,16,20].
Health care settings are regarded as the epicentre for MRSA transmission in Europe [21,22]. Consequently, to date the predominant focus in the UK has been HA-MRSA and minimising the threat to patients through rigorous infection control practice and universal admission screening [10,23–25]. However, it is increasingly recognised that this approach is at odds with the shifting epidemiology of MRSA, which makes it necessary to consider both HA - and CA-MRSA transmission dynamics together [26]. Whilst application of advanced spatial statistical methods may be useful to characterise transmission dynamics of MRSA [21,27,28], application of these models to describe the epidemiology in relation to social determinants and health care exposure is lacking.
The objectives of this study are 2-fold: first, to investigate the relationship between socioeconomic deprivation and both CA - and HA-MRSA in South East London and to identify whether social determinants are associated with carriage of either MRSA classification and, second, to identify the main transmission niches for HA - and CA-MRSA (i.e., community versus health care setting) and whether niches are distinct or shared. For the first time, we fit spatial models and account for hospital attendance in each geography to establish the relative contribution of spatial effects and account for any potential confounding.
Methods
Study Population
A description of the study population has been reported previously [29]. Briefly, over a 4-mo period (from 1 November 2011 to 29 February 2012), we collected all MRSA isolates identified by a hospital cohort that serves a population of 867,254 usual residents [30] and provides microbiology diagnostic services to all inpatients, outpatients, and community patients in the Lambeth, Southwark, and Lewisham boroughs in South East London (Fig 1). Participant centres included four acute tertiary hospitals in two NHS Trusts (Guy’s and St Thomas’ NHS Foundation Trust [GSTT]; King’s College NHS Foundation Trust) and one acute district general hospital (University Hospital Lewisham; Lewisham and Greenwich NHS Trust).

Laboratory Methods
MRSA isolates were submitted to the Centre for Clinical Infection and Diagnostics Research (CIDR) at GSTT and were included in the study if confirmed as MRSA by culture on chromogenic agar (Oxoid Brilliance) and rapid latex agglutination test (Staphaurex, Remel) [29]. Relevant clinical, geographic, and demographic anonymised patient-level details were submitted with each specimen and recorded in the study database [29]. Whole genome sequencing (WGS) was conducted on the first confirmed MRSA isolate from each individual at each unique health care setting (i.e., whenever an individual was admitted as inpatient to a new hospital or received care in a new outpatient clinic or community service during the study period), implying availability of follow-up genomic information when patients received care at multiple settings. Genomic DNA quantification, DNA sample preparation, and library pooling for paired-end 150-cycle sequencing on the Illumina HiSeq 2500 platform in rapid run mode was conducted as per manufacturer’s instructions and as described previously [29]. Following de novo assembly of contigs [29], draft assemblies were analysed in silico to determine the multilocus sequence type (MLST), staphylococcal cassette chromosome mec (SCCmec) type and carriage of the Panton-Valentine leukocidin (PVL) using BWA [31] and BLAST [32]. Isolates were classified as HA-MRSA if they were PVL negative and contained SCCmec types I, II, or III, and as CA-MRSA if they were PVL positive or contained type IV, V, or nontypeable SCCmec [19,29,33]. Exceptions were ST22-IV isolates and ST5-IV isolates, which were classified as HA unless they were PVL positive [19,29,33]. WGS data are available from the European Nucleotide Archive database under accession number PRJEB11177.
Data Collection
The study included the subset of all individuals who had a confirmed MRSA isolate, but also a residential postcode within the catchment areas (Fig 1). Eligible individuals with MRSA were then classed as CA - or HA-MRSA based on the WGS analysis. Persons with both CA - and HA-MRSA in repeated samplings were classified as having a mixed infection and excluded from analyses of CA - and HA-MRSA but included in the analysis of all MRSA. Boundary data for mapping 2011 small geographies (named Lower Layer Super Output Areas [LSOAs]) in catchment areas were obtained from the Office for National Statistics, UK [34]. An LSOA is a geography for the collection and publication of small area statistics in England and Wales; each LSOA has 1,500 residents and 650 households on average. MRSA cases were then mapped to LSOAs following conversion of the residential postcode into a LSOA using GeoConvert [35]. Publicly available small-area-level aggregated data for each LSOA within the Lambeth, Southwark, and Lewisham catchment areas (n = 513) were obtained from the English Indices of Deprivation 2010 [36] and the 2011 England and Wales census [30]. Demographic data (population census and age and gender population structure) were also obtained from the 2011 census. Publicly available data from these sources that were included in the analysis of potential risk factors of MRSA are given in Box 1. The individual patient-level and aggregated LSOA-level metadata analysed in this study are available in S1 and S2 Text, respectively.
Box 1. Description of Publicly Available Area-Level Data Utilised in Ecological Regression Models to Assess Risk Factors for Health-Care-Associated (HA-) and Community-Associated (CA-) MRSA
Summary statistics for area-level variables are given in S1 Table.
The English Indices of Deprivation 2010 [36]
The Index of Multiple Deprivation (IMD) is a wide measure of multiple deprivation for Lower Layer Super Output Area (LSOA) geographies in England. It is conceptualized as a weighted area-level aggregation of seven deprivation domain indices (DDIs): (1) income, (2) employment, (3) health and disability, (4) education, skills, and training, (5) barriers to housing and services, (6) crime, and (7) living environment. Most of the weight in the IMD comes from income and employment (45.00%) followed by health and education (27.00%) DDIs. The remaining DDIs contribute 9.30% weight each. Of note, the indicators used to construct DDIs in the IMD 2010 are different from those used in the 2011 census to classify households by deprivation dimension. Barriers to housing and services is composed of two sub-DDIs. First, “wider barriers” is a combined measure of numbers of homeless residents—as informed by the rate of acceptances for housing assistance under the homelessness provisions of the 1996 Housing Act—the proportion of households aged under 35 whose income means they are unable to afford to enter owner occupation, and the proportion of households judged to have insufficient space to meet the household’s needs (i.e., overcrowding). Second, “geographical barriers sub-DDI” is a combined measure of the mean distance to the closest general practitioner (GP) surgery, supermarket or general store, primary school, and post or sub-post office for people living in the LSOA. Living environment DDI is also composed of two sub-DDIs. First, “indoors living environment” measures the quality of housing as the combined proportion of homes that fail to meet the decent homes standard or do not have central heating. Second, “outdoors living environment” is a combined measure of air quality (based on modelled estimates of the atmospheric concentration of four pollutants) and road traffic accidents involving pedestrians and cyclists.
The 2011 England and Wales Census [30]
Households by deprivation dimensions is a less broad indicator of deprivation in England and Wales at the LSOA level. It classifies households by four deprivation dimensions, namely (1) employment (deprived if any member of the household [not a full-time student] is either unemployed or long-term sick), (2) education (deprived if no person in the household has at least level 2 education and no person aged 16–18 y is a full-time student), (3) health and disability (deprived if any person in the household has general health that is “bad or very bad” or has a long-term health problem), and (4) housing status (deprived if the household’s accommodation is either overcrowded with an occupancy rating −1 or less, is in a shared dwelling, or has no central heating). A household may be classified as being deprived in none or one to four of these dimensions in any combination. Study variables are based on the “percentage of households deprived in one or several dimensions” in each LSOA. Population density is the “number of persons per hectare” in each LSOA. Health variables are based on percentage of usual residents who, following self-assessment, reported “bad/very bad general health” or “day-to-day activities ‘very’/’a little’ limited” due to disability or a long-term health problem lasting more than 12 mo, in the census questionnaire. Household overcrowding variables are based on bedroom occupancy rating data in which the ages of the household members and their relationships to each other are used to derive the number of bedrooms they require. An “occupancy rating of −1” implies that a household has one fewer bedroom than required. An “occupancy rating of −2 or less” implies there are at least two fewer bedrooms than required. Variables for usual residents living in communal establishments (CEs) refer to the percentage of residents who live in managed residential accommodation with ten or more beds. “Any communal establishment” includes all CEs that meet the definition above. “Communal care homes” includes all medical and care CEs that are managed by local authorities or other and are classed as a “care home” with or without nursing. “Other communal medical and care establishments” include hospitals, mental health hospitals/units, children’s homes, and medical and care establishments other than care homes, which are managed by the National Health Service (NHS), local authorities, registered social landlord or housing associations, or other. Ethnic group variables relate to percentage of usual residents who reported “White,” “Asian,” “Black,” (including Black-African and Black-Caribbean subcategories) or “Arab” ethnicity in the census questionnaire. Household spaces by dwelling type are the percentage of households located in purpose-built blocks of flats or tenements as opposite to in, for example, detached or semidetached properties amongst other. Length of residence in the UK shows the percentage of usual residents who have lived in the UK “less than 2 y,” “2 y or more but less than 5 y,” or “5 y or more but less than 10 y.” It is derived from the date that a person last arrived to live in the UK and excludes short visits and usual residents born in the UK who have emigrated and since returned.
The Health and Social Care Information Centre (HSCIC, UK) provided hospital attendance data for catchment areas from the Hospital Episode Statistics (HES) Database [37]. This was defined as the percentage of usual residents of at least 1 y of age in each LSOA who had attended any London Accident and Emergency department or had been admitted to any London hospital (i.e., inside or outside catchment areas) as inpatients between 1 April 2011 and 31 March 2012.
Statistical Analysis
Hierarchical models to investigate the spatial epidemiology of HA - and CA-MRSA were developed and fitted to the observed data using an integrated nested Laplace approximation (INLA) approach [38] in R-INLA package (www.r-inla.org) within R-3.1.1 statistical software [39]. INLA is a computationally efficient approach to Bayesian inference for latent Gaussian models. The latter are very wide and flexible class models that include spatial and spatial-temporal models [40,38]. Several examples in the literature have recently demonstrated the successful application of INLA to mapping of disease incidence and prevalence [41–43].
Based on counts of observed cases within LSOAs, we adopted a model-based approach to obtain reliable estimates of LSOA-level local risks of HA-, CA-, or any MRSA with or without consideration of available area-level statistics. A model-based approach provides a mechanism to “borrow information” across small LSOAs to improve local risk estimates, resulting in the smoothing of extreme risks based on small local sample sizes. It also enables consideration of the spatial setting by borrowing more information from neighbouring rather than distant areas and by smoothing local rates toward local (neighbouring) values where appropriate.
Numbers of MRSA cases in each LSOA were modelled as Poisson random variables by using a logarithmic link and accounting for the age-and-gender standardised expected count of MRSA cases in each LSOA. We considered models without covariates (i.e., disease mapping) and with covariates (i.e., ecological regression). To estimate local risks of MRSA, we examined models of increasing hierarchical complexity to account for the hierarchy of different populations in the analysis. We fitted models to the observed data with unstructured random effects only (independent random noise “iid” model), spatially structured random effects only (“Besag” model), and both structured and unstructured random effects (“Besag, York, and Mollie [BYM]” model) [44]. A model with unstructured random effects only induces some correlation among the observations but does not specifically induce spatial correlation. In other words, all the LSOA-specific risk estimates are a weighted average of the observed data in each LSOA and the global overall mean. On other hand, spatially structured random effects result in local estimates being a weighted average of the local data and an average of observations in neighbouring regions. Hence, such an approach borrows information locally, rather than globally. Structured random effects were modelled using an intrinsic conditional autoregressive structure (ICAR), in which neighbouring geographical areas for each LSOA were accounted for as described previously [45]. See S1 Methods for details. The set of neighbours for each LSOA was obtained from the shape file of the study region using the R packages “maptools” [46] and “spdep” [47,48].
We adopted uninformative priors for the model parameters of interest. We assigned vague normal priors for the fixed effects parameters with zero mean and large variance (equal to 104) and exponential distributions with various rates for the structured and unstructured random effects precision parameters. For the “iid” and “Besag” models, priors on the precision corresponded to a gamma distribution with (1, 5e-05) shape and scale parameters respectively. For BYM, priors on the unstructured and structured effect precisions corresponded to a gamma distribution with parameters (1, 5e-04).
Structured random effects account for variation in the response variable that is due to the spatial arrangement of LSOAs, whilst unstructured effects account for unobserved heterogeneity that is not explained by the covariates or the spatial effects. For HA-, CA-, and any MRSA separately, the most appropriate random effect structure for disease mapping and ecological regression models was chosen based on examination of R-INLA built-in model selection tools in combination with inspection of the variation attributable to spatial effects and of the effects of different levels of spatial smoothing on the spatial field imposed by alternative prior parameters during prior sensitivity analyses. Model selection tools included the deviance information criterion (DIC) and the mean logarithmic score, and, given that DIC is accurate only when the number of effective parameters in the model is small compared to the total number of independent observations [49], the ratio of total observations (n = 513 LSOAs) to the number of effective parameters was also examined.
The potential for associations between MRSA and area-level socioeconomic and demographic profiles was examined in separate unadjusted ecological regression models and models adjusted by LSOA-level quintile-stratified hospital attendance data. Several transformations of each variable were examined, including untransformed (continuous) and two two-level dichotomous transformations reflecting classifications above and below the catchment area median or above and below a cut-off point that minimised the within group variance for each classification. Small-area-level estimates of MRSA and measures of association for the fixed terms (i.e., predictor variables), were summarized by relative risks (RRs). Significant predictor variables were those in which 95% credible intervals for MRSA RR estimates did not overlap with 1 in adjusted analyses. Out of all significant variables identified, we report the RR and 95% credible interval for the variable with lowest DIC within each group of variable transformations and/or “synonymous” variable indicators, to aid readability and interpretability of results. Synonymous variable indicators were considered for deprivation, health, household overcrowding, and usual residents by length of residency in the UK (S1 Table). For robustness, results from ecological regressions were validated across alternative random effect models and the range of prior scale parameters tested. Further details are given in S1 Methods.
Choropleth maps, in which areas are shaded in proportion to the quantile measurement of the variable being displayed, were used to show the posterior mean for LSOA-specific RRs of HA - and CA-MRSA compared to the whole catchment area and to show the distribution of significant covariates. Spatial correlations abound in disease mapping studies and can make the implementation of multiple regression impossible. In this study, we examined the effect of multiple indicators of social and material deprivation independently and following adjustment for hospital attendance data in each area. We then examined pairwise correlation coefficients between significant predictors of MRSA using the function “correlog” of the “ncf” package [50] to aid interpretability of adjusted and unadjusted results. A correlation network summarising the relationship between variables was produced using the “igraph” package [51].
Ethics
This research was conducted following approval from the National Research Ethics Service (NRES Committee North West–Greater Manchester West; Research Ethics Committee [REC] reference 11/NW/0733). Approval and waived consent was obtained from NHS research and development departments at Guy’s and St Thomas’ NHS Foundation Trust, King’s College Hospital NHS Foundation Trust, and University Hospital Lewisham, now part of Lewisham and Greenwich NHS Trust.
Results
MRSA Cases in the Study Areas
Eight-hundred and thirty-nine MRSA positive patients were identified, of which 56.14% (n = 471) had a residential postcode within the three boroughs. Of the patients living in these boroughs, 79.41% (374/471) had MRSA identified in a single health care episode, whilst the remaining 20.59% (97/471) had MRSA identified in multiple episodes. Overall, 635 MRSA positive episodes in 471 individuals were identified, of which 43.31% (275/635) were inpatient, 39.37% (250/635) outpatient, and 17.32% (110/635) community episodes from GPs. MRSA cases were detected in 52.63% (270/513) of LSOAs in target boroughs.
Of the 471 individuals with MRSA with a residential postcode in the three boroughs, 83.23% (392/471) could be genotypically categorised into HA - or CA-MRSA based on genome sequencing, whilst the remaining 16.77% (79/471) were unclassified. 71.68% of classified cases (281/392) were HA-MRSA, and 26.28% (103/392) were CA-MRSA. Both CA - and HA-MRSA were identified in 2.04% of individuals (8/392). These proportions were similar to those observed for the whole study population (of 696/839 patients with MRSA genotypic characterisation, 74.28% had HA-MRSA (n = 517); 23.85% CA-MRSA (n = 166) and 1.87% mixed-MRSA (n = 13)).
Population Structure in Catchment Areas
The number of usual residents in LSOAs ranged from 1,043 to 2,551, with substantial variation in age and gender population structure across areas (S2 Table). Only a minority of usual residents in the 513 LSOA in Lambeth, Southwark, and Lewisham were aged 65 y or more (between 0.58% and 18.77%), and 50.61% were female.
Description of Area-Level Variables Considered in the Study
Summary statistics are given in S1 Table. There was substantial heterogeneity in the ethnicity makeup and factors of social and material deprivation across LSOAs, with ethnicities localising to different areas. The percentage of households deprived in 1–4 dimensions ranged from 26.64% to 83.33%, and the percentage of household spaces in purpose-built blocks of flats ranged from 1.10% to 97.70%. Cross-area differences were also evident for health indicators despite the relatively low percentage of residents aged 65 y or above in the same areas. The percentage of usual residents self-reporting bad or very bad health ranged from 0.48% to 10.13%, and that of residents reporting limited daily activities due to poor health ranged from 2.73% to 23.84%.
A large proportion of residents aged 1 y or older had attended a London hospital accident and emergency department or had been admitted to a hospital as an inpatient around the study period. The mean percentage of residents attending a hospital was 33.10% but ranged from 17.31% to 48.94% (S1 Table).
Distribution of Genotypically Defined MRSA Types in Catchment Areas in Relation to Area-Level Hospital Attendance
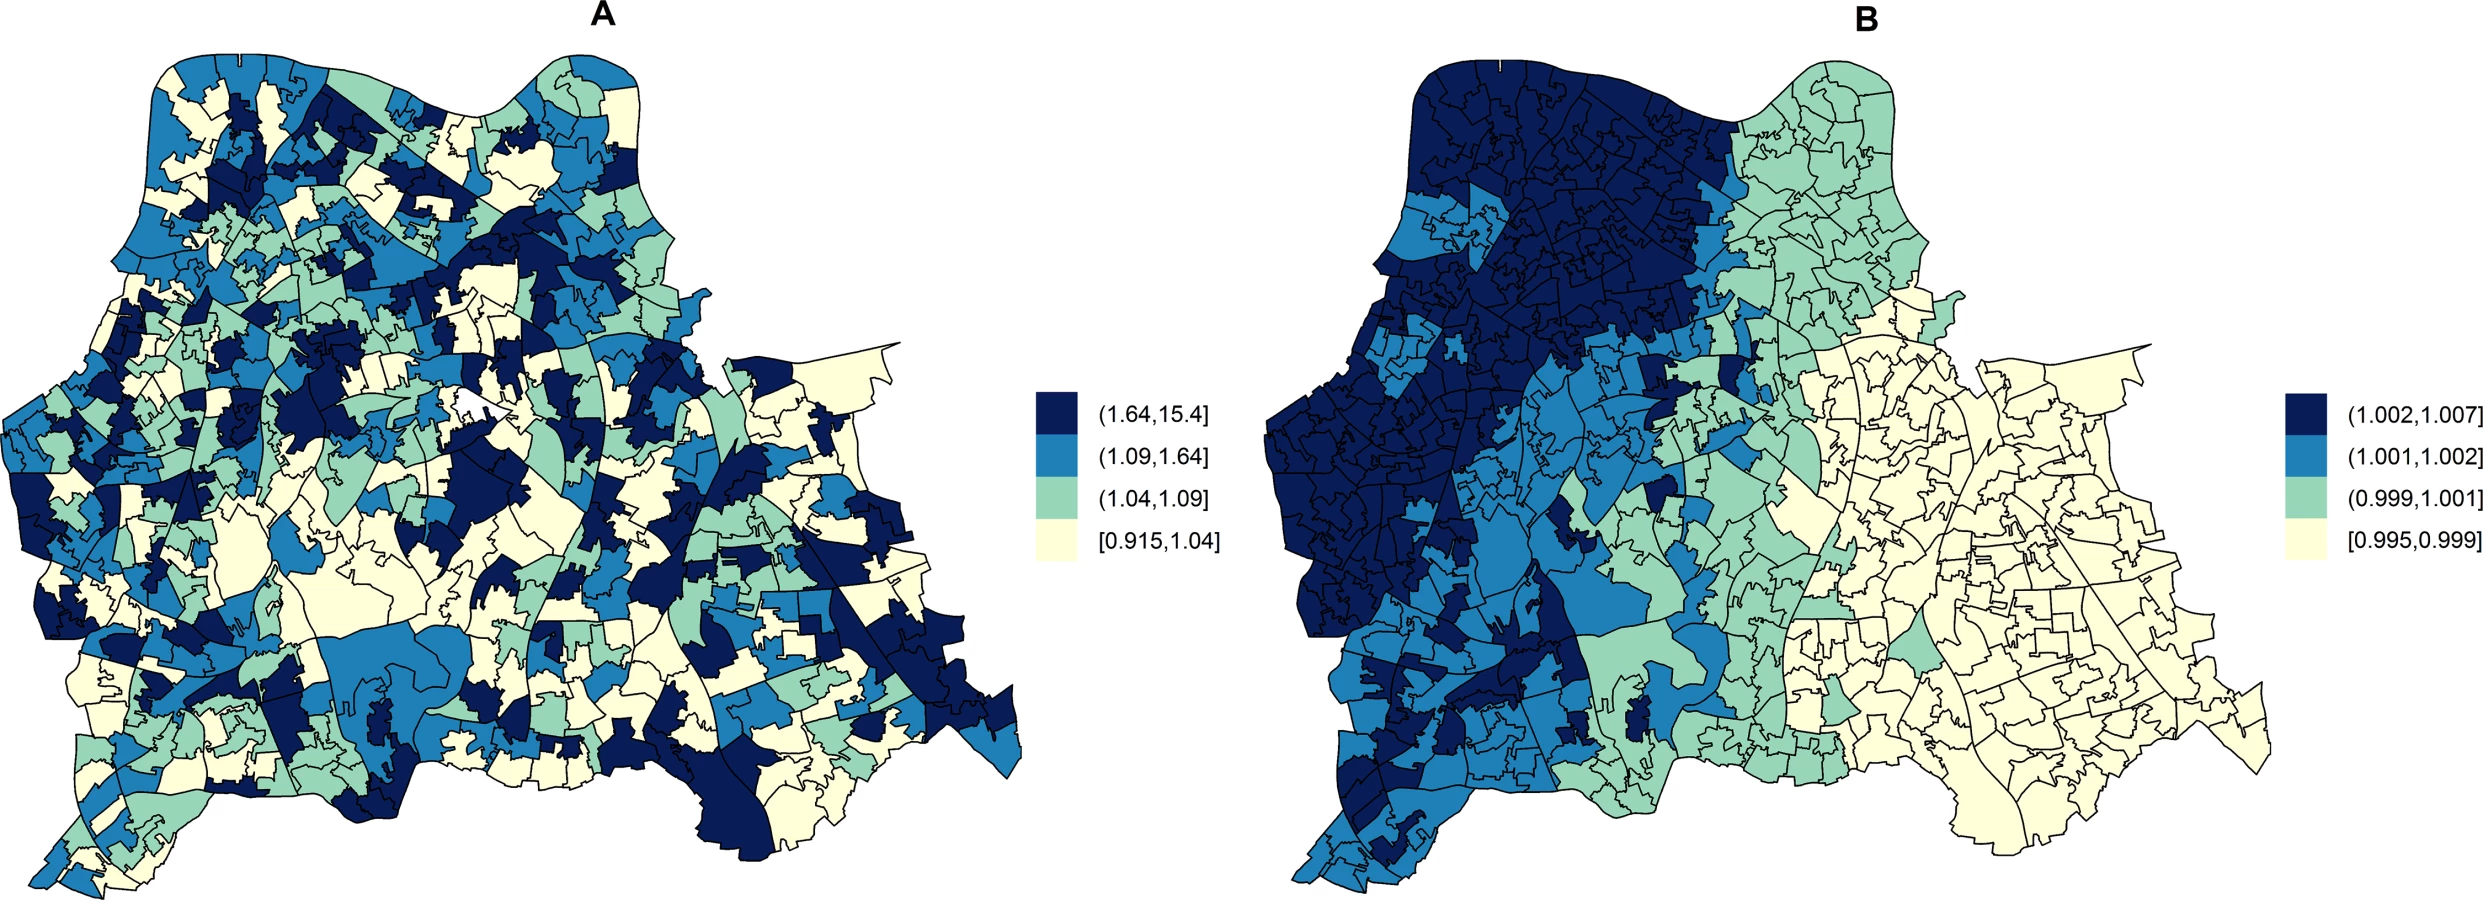
For HA-MRSA (n = 281), and for all MRSA combined (HA-, CA - and unclassified; n = 471), the contribution of spatial (structured) effects to explaining the variance in RRs between LSOAs within the three boroughs was negligible (unadjusted model: 0.10%; model adjusted for area-level hospital attendance: 0.09%), with 99.90% variation attributable to unobserved heterogeneity alone (unstructured effects). In contrast, substantial variation in small area-level RRs of CA-MRSA within the three boroughs was attributable to the spatial arrangement of LSOAs (unadjusted model: 27.67%; adjusted model: 28.67%).
In unadjusted models, the RR of HA-MRSA across the three boroughs ranged from 0.92 to 15.40 depending on the LSOA and that of CA-MRSA ranged from 1.00 to 1.01. Fig 2 shows the area-specific RRs of HA - and CA-MRSA compared to the whole catchment area in unadjusted models.
Area-level hospital attendance was an important predictor of the RR of MRSA. Specifically, the risk was only increased in areas where >37.16% of residents had attended hospital (fifth quintile), as compared to areas where hospital attendance was noted for ≤29.00% of usual residents (first quintile). In fifth quintile areas, the RR of HA-MRSA increased by 74.00% (1.74; 95% CI = 1.13–2.71) and that of CA-MRSA by 249.00% (2.49; 95% CI = 1.34–4.87).
Combining all MRSA (n = 471), the RR in catchment areas estimated from unadjusted models ranged from 0.84 to 8.39. The RR of any MRSA increased by 98.00% (1.98; 95% CI = 1.40–2.80) in areas where more than 37.16% of usual residents had attended a hospital (fifth quintile).
Associations between Area-Level Social Determinants and Genotypically Defined MRSA Types
Ecological regression analyses to evaluate the effect of variables individually or after adjusting by quintile-stratified hospital attendance are shown in Tables 1 and 2 for HA-MRSA (n = 281) and CA-MRSA (n = 103), respectively. All significant predictors identified in adjusted analyses were also significant in unadjusted analyses. In addition, no variables were identified that were significant in adjusted analyses alone. HA - and CA-MRSA were both positively associated with household deprivation (i.e., percentage of households deprived in two to four dimensions or one to two dimensions), with black or black African ethnicities, and with a greater percentage of household spaces in purpose-built blocks of flats or tenements. In addition, HA-MRSA was positively associated with areas where greater percentages of usual residents had reported having very limited daily activities because of poor health and areas where greater percentages of usual residents resided in communal care homes.


No indicators of poor health or residency in communal establishments (i.e., care homes) were positively associated with CA-MRSA. Instead, the RR of CA-MRSA was higher in areas with a greater percentage of overcrowded households and more deprivation according to the 2010 wider barriers score. The RR for CA-MRSA was also higher where more usual residents had immigrated to the UK within the 2 y preceding the 2011 census. The proportion of variance in CA-MRSA explained by the spatial structure component of the models presented in Table 2 ranged from 26.24% to 27.66%.
Analyses considering all 471 MRSA cases in catchment areas (Table 3) showed that variables significantly increasing the RR of any MRSA were a combination of HA-MRSA and CA-MRSA predictors (i.e., poor health, residency in care homes, and household overcrowding). A negative association was only identified in the combined analysis (n = 471). The RR of any MRSA decreased by about 30% in areas where more usual residents were of white ethnicity (36.30% unadjusted model; 26.20% adjusted model). See Table 3.

The area-specific RRs of MRSA compared to the whole catchment area in adjusted models accounting for hospital attendance and households deprived in 2–4 dimensions (HA-MRSA) or 1–2 dimensions (CA-MRSA) are shown in Fig 3. The overall RR of HA-MRSA ranged from 0.82 to 12.46 depending on the LSOA and that of CA-MRSA from 0.99 to 1.01. The RR for all MRSA combined (n = 471) in a model adjusted for hospital attendance and households deprived in 2–4 dimensions ranged from 0.76 to 6.70 depending on the LSOA.

Correlations of Area-Level Predictors of Genotypically Defined MRSA Types
Moderate (Pearson correlation coefficient [PCC] ≥ 0.70 or ≤ −0.70) to strong (PCC > 0.80 or < −0.80) correlations amongst significant predictors of HA-MRSA, CA-MRSA, or any MRSA are presented for the catchment areas in Fig 4. Of note, the percentage of usual residents living in communal care homes or having moved to the UK within the 2 y preceding the 2011 census were not correlated with deprivation or any other significant predictors of MRSA.


Discussion
To the best of our knowledge, this is the first study to use spatial models to describe the epidemiology of MRSA and to investigate genetically defined CA - and HA-MRSA classifications separately in relation to social determinants and transmission niches. Multiple reports had previously linked MRSA rates to postcode or neighbourhood data [52–59], but only classical tests [4,54], nonspatial regression [52,53,55–61], or cluster detection methods [52,58] had been used to determine the impact of socioeconomic indicators. Here for the first time, we provide unprecedented insight into the epidemiology of HA - and CA-MRSA in the UK, by accounting for spatial effects—and hence the potential for impact from neighbouring geographies—and confounding hospital attendance.
We specifically conducted the study in three adjacent boroughs of South East London to take advantage of the wide variation that exists in population traits across LSOAs. Our work suggests that the most deprived areas are at greater risk of MRSA but that the causality of this association differs depending on the MRSA genetic classification. We hypothesise that relevant risk factors must lie within the deprivation domains considered in the 2011 census (i.e., households deprived in any dimension). In contrast, a lack of association with the 2010 IMD overall score suggests that such a wide scoring predominantly weighted by income and employment (45.00%) with lesser contribution of wider barriers and household overcrowding is less helpful at describing the spatial epidemiology of MRSA in the UK.
Vast analytical complexity arises from disease mapping studies in which spatial correlations abound, which can result in spurious associations. We found that areas with a higher percentage of deprived households correlated closely with various other identified risk factors for MRSA, especially black or black African ethnicity, poor housing, poor health, and hospital attendance. In this context, we sought to address whether the most important precursor for acquiring MRSA is living in deprived conditions or attending a hospital as a result of being deprived and whether it is the hospital or the community that presently constitutes the main transmission site for MRSA.
We found that 26.24% to 28.67% of area-level variation in CA-MRSA could be explained by the spatial arrangement of LSOAs, implying that residents in locations neighbouring high-risk areas are themselves at higher risk of infection and/or colonisation compared to more distant locations. In contrast, no spatial patterns were observed for HA-MRSA, suggesting that little or no transmission of hospital lineages occurs in the community. These findings indicate that the predominant transmission route for genetically classified CA-MRSA in the UK is still the community, whilst transmission of HA-MRSA continues to be hospital led, with little evidence for transmission outside the health care or care home setting. The implications are 2-fold. The first implication is that an association between HA-MRSA and deprivation may result from the increased likelihood of attending a hospital as a result of being deprived rather than from living in deprived conditions alone. This is supported by additional markers of poor health (i.e., daily activities very limited) and the percentage of usual residents living in communal care homes being significant predictors for HA-MRSA and by the lack of an independent association with wider barriers and/or household overcrowding alone. Of note, previous studies reporting a link between socioeconomic deprivation and S. aureus bacteraemia [56], postoperative MRSA infection [4], or HA-MRSA [55] had not adjusted for area-level attendance at hospitals. Secondly, there is an implication that an association between CA-MRSA and deprivation most likely arises from living in deprived conditions, rather than from attending a hospital as a result of being deprived. This is supported by the lack of association between CA-MRSA and markers of poor health (e.g., daily activities very limited because of poor health) or residency in care homes. Instead, CA-MRSA is associated with wider barriers (a combination of homelessness, low income, and household overcrowding) and with the percentage of households with bedroom occupancy rates reflecting overcrowding. We hypothesise that in the UK an association with hospital attendance may be spurious, due to more persons in deprived areas attending a hospital, although evidence of ongoing or limited transmission of CA-MRSA in the hospital setting is lacking. CA-MRSA has previously been linked to socioeconomic deprivation [54,55,57,58,60], public housing [52], and alternative housing (e.g., shelters) [53,59] in studies outside the UK. A link between CA-MRSA and household overcrowding has been shown in some non-UK studies [54,61] but not others [52].
These findings are important because whilst the overall burden of MRSA in Europe is declining [62], due to decline in HA-MRSA lineages [23,63,64], CA-MRSA lineages are emerging in every continent [17,65,66]. The prevalence of CA-MRSA in Europe is thought to be increasing [7] partly through continuous importation from endemic regions [67,68]. Our work suggests that the prevalence of CA-MRSA in South East London is significant (26.28% of cases were CA-MRSA), and may be increasing based on observations that community-level transmission from deprived areas to neighbouring areas is ongoing and that importation of CA-MRSA is linked with recent immigration to the UK.
An advantage to our study is that it has provided a representative sample of usual residents receiving care in the catchment areas. The vast majority of biological samples from public and private patients residing in the study areas are analysed by laboratories in the cohort, whilst the contribution of other diagnostic providers is negligible. This is in contrast to studies in which a sample may be restricted to a particular population layer, such as patients with medical insurance. There are several limitations to our study. Firstly, analyses of aggregated data risk the “ecological fallacy” whereby relationships apparent at the group level are spuriously assumed to operate at the individual level. This bias is a result of the fact that, unlike individual‐level studies, group‐level studies do not link individual outcome events to individual exposure histories [69,70]. We therefore recognise the need for parallel analysis of individual level data to revisit the impact of socioeconomic deprivation and demographic indicators on risk of HA - and CA-MRSA infection or colonisation in Europe. Secondly, choosing small values for the scale parameter of priors, the LSOA-specific RRs for CA-MRSA compared to the whole catchment area, suggested an almost constant risk across the area (RRs: 0.99–1.01). The apparent “flat risk,” however, almost undoubtedly resulted from the very low numbers of observed CA-MRSA cases in each LSOA (minimum = 0; maximum = 3) and from comparing individual LSOA RRs against the average as opposite to against other/neighbouring LSOAs. Increasing the scale parameter for the prior on the spatial effect precision, and hence increasing the weight of small observations, significant differences in CA-MRSA LSOA-specific RRs were apparent, with LSOA-specific posterior probabilities indicating excess risk for some of the areas. Moreover, greater percentage variation attributable to spatial effects was also observed at greater values of the scale parameter. This was in sharp contrast with HA-MRSA, with which effects of different levels of spatial smoothing on the spatial field imposed by alternative prior parameters had little influence on LSOA RRs, and percentage variation attributable to spatial effects remained negligible regardless of prior choice. Consequently, we argue that, unlike HA-MRSA, the distribution of CA-MRSA cases was spatially structured.
In summary, this study shows that the predominant transmission niches for HA - and CA-MRSA in South East London are specific to each genetic classification. HA-MRSA lineages originate from hospitals, and there is no evidence that active transmission of these lineages occurs outside the health care setting. We present evidence that CA-MRSA strains are spreading in the community from the most deprived areas where favourable conditions are met. There is also importation from recent immigration. The extent to which CA-MRSA is transmitting within health care premises is unknown, particularly in the context of declining overall MRSA prevalence in UK hospitals due to stringent control measures. However, in some countries, CA-MRSA is increasingly implicated in nosocomial infections [13,16], has begun to spread within hospitals [13], and may have the capacity to displace HA-MRSA in these settings [71–73], particularly given repeated community admissions [26] coupled with poor adaptability of HA-MRSA to persist in the community [21,63]. In this context, we show that factors are at play in the UK that could result in the displacement of HA-MRSA lineages in favour of CA-MRSA in the future. We propose that future efforts to master sustained control of MRSA in hospitals and the community should focus on prevention of community spread within deprived areas. Future reviews of UK hospital admission screening policies for MRSA should carefully consider the growing threat of importation of CA-MRSA lineages into hospitals.
Supporting Information
Zdroje
1. Semenza JC, Giesecke J. Intervening to reduce inequalities in infections in Europe. American journal of public health. 2008;98(5):787–92. doi: 10.2105/AJPH.2007.120329 18381991
2. Semenza JC. Strategies to intervene on social determinants of infectious diseases. Euro surveillance: bulletin Europeen sur les maladies transmissibles = European communicable disease bulletin. 2010;15(27):32–9.
3. Gillespie IA, Mook P, Little CL, Grant KA, McLauchlin J. Human listeriosis in England, 2001–2007: association with neighbourhood deprivation. Euro surveillance: bulletin Europeen sur les maladies transmissibles = European communicable disease bulletin. 2010;15(27):7–16.
4. Bagger JP, Zindrou D, Taylor KM. Postoperative infection with meticillin-resistant Staphylococcus aureus and socioeconomic background. Lancet. 2004;363(9410):706–8. 15001331
5. Commission of the European Communities. White paper. Together for Health: A strategic approach for the EU 2008–2013. Brussels; 2007. http://ec.europa.eu/health-eu/doc/whitepaper_en.pdf
6. Semenza JC, Suk JE, Tsolova S. Social determinants of infectious diseases: a public health priority. Euro surveillance: bulletin Europeen sur les maladies transmissibles = European communicable disease bulletin. 2010;15(27):2–4.
7. Otter JA, French GL. Molecular epidemiology of community-associated meticillin-resistant Staphylococcus aureus in Europe. The Lancet Infectious diseases. 2010;10(4):227–39. doi: 10.1016/S1473-3099(10)70053-0 20334846
8. Herold BC, Immergluck LC, Maranan MC, Lauderdale DS, Gaskin RE, Boyle-Vavra S, et al. Community-acquired methicillin-resistant Staphylococcus aureus in children with no identified predisposing risk. Jama. 1998;279(8):593–8. 9486753
9. Lowy FD. Staphylococcus aureus infections. New Engl J Med. 1998;339 : 520–32. 9709046
10. Coia JE, Duckworth GJ, Edwards DI, Farrington M, Fry C, Humphreys H, et al. Guidelines for the control and prevention of meticillin-resistant Staphylococcus aureus (MRSA) in healthcare facilities. The Journal of hospital infection. 2006;63 Suppl 1:S1–44. 16581155
11. Harbarth S, Sax H, Fankhauser-Rodriguez C, Schrenzel J, Agostinho A, Pittet D. Evaluating the probability of previously unknown carriage of MRSA at hospital admission. The American journal of medicine. 2006;119(3):275 e15-23.
12. Naimi TS, LeDell KH, Como-Sabetti K, Borchardt SM, Boxrud DJ, Etienne J, et al. Comparison of community - and health care-associated methicillin-resistant Staphylococcus aureus infection. Jama. 2003;290(22):2976–84. 14665659
13. Egea AL, Gagetti P, Lamberghini R, Faccone D, Lucero C, Vindel A, et al. New patterns of methicillin-resistant Staphylococcus aureus (MRSA) clones, community-associated MRSA genotypes behave like healthcare-associated MRSA genotypes within hospitals, Argentina. International journal of medical microbiology: IJMM. 2014;304(8):1086–99. doi: 10.1016/j.ijmm.2014.08.002 25240872
14. Popovich KJ, Weinstein RA. Commentary: The graying of methicillin-resistant Staphylococcus aureus. Infection control and hospital epidemiology. 2009;30(1):9–12. doi: 10.1086/592709 19046052
15. Popovich KJ, Weinstein RA, Hota B. Are community-associated methicillin-resistant Staphylococcus aureus (MRSA) strains replacing traditional nosocomial MRSA strains? Clinical infectious diseases: an official publication of the Infectious Diseases Society of America. 2008;46(6):787–94.
16. Otter JA, French GL. Community-associated meticillin-resistant Staphylococcus aureus strains as a cause of healthcare-associated infection. The Journal of hospital infection. 2011;79(3):189–93. doi: 10.1016/j.jhin.2011.04.028 21741111
17. Chua K, Laurent F, Coombs G, Grayson ML, Howden BP. Antimicrobial resistance: Not community-associated methicillin-resistant Staphylococcus aureus (CA-MRSA)! A clinician's guide to community MRSA—its evolving antimicrobial resistance and implications for therapy. Clinical infectious diseases: an official publication of the Infectious Diseases Society of America. 2011;52(1):99–114.
18. Millar BC, Loughrey A, Elborn JS, Moore JE. Proposed definitions of community-associated meticillin-resistant Staphylococcus aureus (CA-MRSA). The Journal of hospital infection. 2007;67(2):109–13. 17669546
19. Otter JA, French GL. Community-associated meticillin-resistant Staphylococcus aureus: the case for a genotypic definition. The Journal of hospital infection. 2012;81(3):143–8. doi: 10.1016/j.jhin.2012.04.009 22622448
20. Zetola N, Francis JS, Nuermberger EL, Bishai WR. Community-acquired meticillin-resistant Staphylococcus aureus: an emerging threat. The Lancet Infectious diseases. 2005;5(5):275–86. 15854883
21. Grundmann H, Aanensen DM, van den Wijngaard CC, Spratt BG, Harmsen D, Friedrich AW. Geographic distribution of Staphylococcus aureus causing invasive infections in Europe: a molecular-epidemiological analysis. PLoS Med. 2010;7(1):e1000215. doi: 10.1371/journal.pmed.1000215 20084094
22. Tiemersma EW, Bronzwaer SL, Lyytikainen O, Degener JE, Schrijnemakers P, Bruinsma N, et al. Methicillin-resistant Staphylococcus aureus in Europe, 1999–2002. Emerging infectious diseases. 2004;10(9):1627–34. 15498166
23. Johnson AP, Davies J, Guy R, Abernethy J, Sheridan E, Pearson A, et al. Mandatory surveillance of methicillin-resistant Staphylococcus aureus (MRSA) bacteraemia in England: the first 10 years. The Journal of antimicrobial chemotherapy. 2012;67(4):802–9. doi: 10.1093/jac/dkr561 22223229
24. Derde LP, Cooper BS, Goossens H, Malhotra-Kumar S, Willems RJ, Gniadkowski M, et al. Interventions to reduce colonisation and transmission of antimicrobial-resistant bacteria in intensive care units: an interrupted time series study and cluster randomised trial. The Lancet Infectious diseases. 2014;14(1):31–9. doi: 10.1016/S1473-3099(13)70295-0 24161233
25. Lee AS, Cooper BS, Malhotra-Kumar S, Chalfine A, Daikos GL, Fankhauser C, et al. Comparison of strategies to reduce meticillin-resistant Staphylococcus aureus rates in surgical patients: a controlled multicentre intervention trial. BMJ open. 2013;3(9):e003126. doi: 10.1136/bmjopen-2013-003126 24056477
26. Harris SR, Cartwright EJ, Torok ME, Holden MT, Brown NM, Ogilvy-Stuart AL, et al. Whole-genome sequencing for analysis of an outbreak of meticillin-resistant Staphylococcus aureus: a descriptive study. The Lancet Infectious diseases. 2013;13(2):130–6. doi: 10.1016/S1473-3099(12)70268-2 23158674
27. Bastin L, Rollason J, Hilton A, Pillay D, Corcoran C, Elgy J, et al. Spatial aspects of MRSA epidemiology: a case study using stochastic simulation, kernel estimation and SaTScan. Int J Geogr Inf Sci. 2007;21(7):811–36.
28. Gray RR, Tatem AJ, Johnson JA, Alekseyenko AV, Pybus OG, Suchard MA, et al. Testing Spatiotemporal Hypothesis of Bacterial Evolution Using Methicillin-Resistant Staphylococcus aureus ST239 Genome-wide Data within a Bayesian Framework. Mol Biol Evol. 2011;28(5):1593–603. doi: 10.1093/molbev/msq319 21112962
29. Hughes J, Stabler R, Gaunt M, Karadag T, Desai N, Betley J, et al. Clonal variation in high - and low-level phenotypic and genotypic mupirocin resistance of MRSA isolates in south-east London. The Journal of antimicrobial chemotherapy. 2015. dkv248–. doi: 10.1093/jac/dkv248
30. UK Data Service Census Support. Office for National Statistics, 2011 Census: Aggregate data (England and Wales). http://infuse.mimas.ac.uk. Licensed under the terms of the Open Government Licence. [http://www.nationalarchives.gov.uk/doc/open-government-licence/version/2].
31. Li H, Durbin R. Fast and accurate short read alignment with Burrows-Wheeler transform. Bioinformatics. 2009;25(14):1754–60. doi: 10.1093/bioinformatics/btp324 19451168
32. Altschul SF, Gish W, Miller W, Myers EW, Lipman DJ. Basic local alignment search tool. Journal of molecular biology. 1990;215(3):403–10. 2231712
33. Miller CE, Batra R, Cooper BS, Patel AK, Klein J, Otter JA, et al. An association between bacterial genotype combined with a high-vancomycin minimum inhibitory concentration and risk of endocarditis in methicillin-resistant Staphylococcus aureus bloodstream infection. Clinical infectious diseases: an official publication of the Infectious Diseases Society of America. 2012;54(5):591–600.
34. Office for National Statistics, 2011 Census: Digitised Boundary Data (England and Wales). UK Data Service Census Support. http://www.ons.gov.uk/ons/guide-method/geography/products/census/index.html
35. UK Data Service Census Support. Office for National Statistics. GeoConvert. http://geoconvert.mimas.ac.uk/.
36. English indices of deprivation 2010. Department for Communities and Local Government—Publications—GOV.UK. https://www.gov.uk/government/statistics/english-indices-of-deprivation-2010.
37. Health and Social Care Information Centre (HSCIC). Hospital Episode Statistics. http://www.hscic.gov.uk/hes.
38. Rue H, Martino S, Chopin N. Approximate Bayesian inference for latent Gaussian models by using integrated nested Laplace approximations. J R Stat Soc B. 2009;71 : 319–92.
39. R Core Team. R: A Language and Environment for Statistical Computing Vienna, Austria: R Foundation for Statistical Computing; 2013. http://www.r-project.org/
40. Rue H, Martino S. Approximate Bayesian inference for hierarchical Gaussian Markov random field models. J Stat Plan Infer. 2007;137(10):3177–92.
41. Roos M, Held L. Sensitivity analysis in Bayesian generalized linear mixed models for binary data. Bayesian Anal. 2011;6(2):259–78.
42. Schrodle B, Held L, Riebler A, Danuser J. Using integrated nested Laplace approximations for the evaluation of veterinary surveillance data from Switzerland: a case-study. J R Stat Soc C-Appl. 2011;60 : 261–79.
43. Blangiardo M, Cameletti M, Baio G, Rue H. Spatial and spatio-temporal models with R-INLA. Spatial and spatio-temporal epidemiology. 2013;7 : 39–55. 24377114
44. Besag J, York J, Mollie A. Bayesian Image-Restoration, with 2 Applications in Spatial Statistics. Ann I Stat Math. 1991;43(1):1–20.
45. S B. Revisiting Spherical Trigonometry with Orthogonal Projectors. Math Assoc Am Coll Math J. 2004;35 : 375–81.
46. Bivand R, Lewin-Koh N. Maptools: Tools for reading and handling spatial objects. 2014. http://cran.r-project.org/package=maptools
47. Bivand R, Hauke J, Kossowski T. Computing the Jacobian in Gaussian Spatial Autoregressive Models: An Illustrated Comparison of Available Methods. Geogr Anal. 2013;45(2):150–79.
48. Bivand R, Piras G. Comparing Implementations of Estimation Methods for Spatial Econometrics. J Stat Softw. 2015;63(18):1–36.
49. Rue H MS, Chopin N, Sara Martino NC. Implementing approximate Bayesian inference for latent Gaussian models using integrated nested Laplace approximations: A manual for the inla-program. J R Stat Soc Ser B (Statistical Methodol). 2009(71):319–92.
50. Bjornstad ON. Ncf: spatial nonparametric covariance functions. 2013. http://cran.r-project.org/package=ncf
51. Csardi G NT. The igraph software package for complex network research. InterJournal. 2006;Complex Systems:1695. http://igraph.org
52. Hota B, Ellenbogen C, Hayden MK, Aroutcheva A, Rice TW, Weinstein RA. Community-associated methicillin-resistant Staphylococcus aureus skin and soft tissue infections at a public hospital: do public housing and incarceration amplify transmission? Archives of internal medicine. 2007;167(10):1026–33. 17533205
53. Popovich KJ, Smith KY, Khawcharoenporn T, Thurlow CJ, Lough J, Thomas G, et al. Community-associated methicillin-resistant Staphylococcus aureus colonization in high-risk groups of HIV-infected patients. Clinical infectious diseases: an official publication of the Infectious Diseases Society of America. 2012;54(9):1296–303.
54. Bratu S, Landman D, Gupta J, Trehan M, Panwar M, Quale J. A population-based study examining the emergence of community-associated methicillin-resistant Staphylococcus aureus USA300 in New York City. Annals of clinical microbiology and antimicrobials. 2006;5 : 29. 17137512
55. Casey JA, Cosgrove SE, Stewart WF, Pollak J, Schwartz BS. A population-based study of the epidemiology and clinical features of methicillin-resistant Staphylococcus aureus infection in Pennsylvania, 2001–2010. Epidemiology and infection. 2013;141(6):1166–79. doi: 10.1017/S0950268812001872 22929058
56. Huggan PJ, Wells JE, Browne M, Richardson A, Murdoch DR, Chambers ST. Population-based epidemiology of Staphylococcus aureus bloodstream infection in Canterbury, New Zealand. Internal medicine journal. 2010;40(2):117–25. doi: 10.1111/j.1445-5994.2009.01910.x 19226421
57. Tong SY, van Hal SJ, Einsiedel L, Currie BJ, Turnidge JD. Impact of ethnicity and socio-economic status on Staphylococcus aureus bacteremia incidence and mortality: a heavy burden in Indigenous Australians. BMC infectious diseases. 2012;12 : 249. doi: 10.1186/1471-2334-12-249 23043704
58. Tong SY, Bishop EJ, Lilliebridge RA, Cheng AC, Spasova-Penkova Z, Holt DC, et al. Community-associated strains of methicillin-resistant Staphylococcus aureus and methicillin-susceptible S. aureus in indigenous Northern Australia: epidemiology and outcomes. The Journal of infectious diseases. 2009;199(10):1461–70. doi: 10.1086/598218 19392622
59. Popovich KJ, Weinstein RA, Aroutcheva A, Rice T, Hota B. Community-associated methicillin-resistant Staphylococcus aureus and HIV: intersecting epidemics. Clinical infectious diseases: an official publication of the Infectious Diseases Society of America. 2010;50(7):979–87.
60. Murphy CR, Hudson LO, Spratt BG, Elkins K, Terpstra L, Gombosev A, et al. Predictors of hospitals with endemic community-associated methicillin-resistant Staphylococcus aureus. Infection control and hospital epidemiology. 2013;34(6):581–7. doi: 10.1086/670631 23651888
61. Golding GR, Levett PN, McDonald RR, Irvine J, Nsungu M, Woods S, et al. A comparison of risk factors associated with community-associated methicillin-resistant and -susceptible Staphylococcus aureus infections in remote communities. Epidemiology and infection. 2010;138(5):730–7. doi: 10.1017/S0950268809991488 20092664
62. Johnson AP. Methicillin-resistant Staphylococcus aureus: the European landscape. The Journal of antimicrobial chemotherapy. 2011;66 Suppl 4:iv43–iv8. doi: 10.1093/jac/dkr076 21521706
63. Ellington MJ, Hope R, Livermore DM, Kearns AM, Henderson K, Cookson BD, et al. Decline of EMRSA-16 amongst methicillin-resistant Staphylococcus aureus causing bacteraemias in the UK between 2001 and 2007. The Journal of antimicrobial chemotherapy. 2010;65(3):446–8. doi: 10.1093/jac/dkp448 20035019
64. Edgeworth JD. Has decolonization played a central role in the decline in UK methicillin-resistant Staphylococcus aureus transmission? A focus on evidence from intensive care. The Journal of antimicrobial chemotherapy. 2011;66 Suppl 2:ii41–7. doi: 10.1093/jac/dkq325 20852273
65. David MZ, Daum RS. Community-associated methicillin-resistant Staphylococcus aureus: epidemiology and clinical consequences of an emerging epidemic. Clinical microbiology reviews. 2010;23(3):616–87. doi: 10.1128/CMR.00081-09 20610826
66. DeLeo FR, Otto M, Kreiswirth BN, Chambers HF. Community-associated meticillin-resistant Staphylococcus aureus. Lancet. 2010;375(9725):1557–68. doi: 10.1016/S0140-6736(09)61999-1 20206987
67. Bartels MD, Kristoffersen K, Boye K, Westh H. Rise and subsequent decline of community-associated methicillin resistant Staphylococcus aureus ST30-IVc in Copenhagen, Denmark through an effective search and destroy policy. Clinical microbiology and infection: the official publication of the European Society of Clinical Microbiology and Infectious Diseases. 2010;16(1):78–83.
68. Urth T, Juul G, Skov R, Schonheyder HC. Spread of a methicillin-resistant Staphylococcus aureus ST80-IV clone in a Danish community. Infection control and hospital epidemiology. 2005;26(2):144–9. 15756884
69. Greenland S, Morgenstern H. Ecological bias, confounding, and effect modification. International journal of epidemiology. 1989;18(1):269–74. 2656561
70. Greenland S. Divergent biases in ecologic and individual-level studies. Statistics in medicine. 1992;11(9):1209–23. 1509221
71. Gonzalez BE, Rueda AM, Shelburne SA, 3rd, Musher DM, Hamill RJ, Hulten KG. Community-associated strains of methicillin-resistant Staphylococccus aureus as the cause of healthcare-associated infection. Infection control and hospital epidemiology. 2006;27(10):1051–6.
72. Agata EM, Webb GF, Horn MA, Moellering RC, Jr., Ruan S. Modeling the invasion of community-acquired methicillin-resistant Staphylococcus aureus into hospitals. Clinical infectious diseases: an official publication of the Infectious Diseases Society of America. 2009;48(3):274–84.
73. Skov RL, Jensen KS. Community-associated meticillin-resistant Staphylococcus aureus as a cause of hospital-acquired infections. The Journal of hospital infection. 2009;73(4):364–70. doi: 10.1016/j.jhin.2009.07.004 19786313
Štítky
Interní lékařstvíČlánek vyšel v časopise
PLOS Medicine
2016 Číslo 1
- Omeprazol a mechanismus hojení krvácení z peptického vředu
- Diosmin a hesperidin: Co ukazuje farmakokinetika?
- Genetický výzkum potvrdil asociaci mezi autismem a střevními obtížemi
- Intermitentní hladovění v prevenci a léčbě (nejen) civilizačních chorob
- Porovnání farmakologických vlastností mikronizovaného diosminu a hesperidinu v terapii chronické žilní insuficience a hemoroidů
Nejčtenější v tomto čísle
- Cotrimoxazole Prophylaxis Discontinuation among Antiretroviral-Treated HIV-1-Infected Adults in Kenya: A Randomized Non-inferiority Trial
- Sharing Individual Participant Data (IPD) within the Context of the Trial Reporting System (TRS)
- “Real-Time” Monitoring of Under-Five Mortality: A Vision Tempered by Reality
- Pharmaceutical Industry Off-label Promotion and Self-regulation: A Document Analysis of Off-label Promotion Rulings by the United Kingdom Prescription Medicines Code of Practice Authority 2003–2012
Zvyšte si kvalifikaci online z pohodlí domova
Mazová zátka a její řešení
nový kurzVšechny kurzy