
Spatial and Temporal Heterogeneity in High-Grade Serous Ovarian Cancer: A Phylogenetic Analysis
In this study, James Brenton and colleagues demonstrate that quantitative measures of intratumoural heterogeneity may have predictive value for survival after chemotherapy treatment in high-grade serous ovarian cancer.
Published in the journal:
. PLoS Med 12(2): e32767. doi:10.1371/journal.pmed.1001789
Category:
Research Article
doi:
https://doi.org/10.1371/journal.pmed.1001789
Summary
In this study, James Brenton and colleagues demonstrate that quantitative measures of intratumoural heterogeneity may have predictive value for survival after chemotherapy treatment in high-grade serous ovarian cancer.
Introduction
Intra-tumour genetic heterogeneity in cancer has been investigated for almost half a century [1,2], and recent advances in genomic technology have demonstrated diverse genetic changes within a single epithelial cancer [3–14]. Multiple sampling of primary and metastatic sites in breast, pancreas, and renal carcinoma has catalogued genetic divergence and shown that metastases from the same site can show organ-specific phylogenetic branches [5–8,12]. Deep sequencing of epithelial tumours has revealed the clonal compositions of individual clinical samples and has shown how major and minor subclones may co-exist [5,7,8,12,14,15]. These data extend earlier observations showing that there is significant intra-tumour heterogeneity in solid tumours, and suggest that tumours with sufficient heterogeneity may be able to explore the fitness landscape widely enough during selection pressure from chemotherapy to repopulate with a resistant subclone [16,17]. Although this phenomenon has been extensively demonstrated in haematological cancers [18,19], the sequence of clonal expansions (CEs) has not been comprehensively described in epithelial tumours or correlated with clinical outcome.
High-grade serous ovarian cancer (HGSOC) is genomically characterised by a ubiquitous TP53 mutation, high-frequency somatic copy number alterations (CNAs), and whole genome duplications [20–22]. Oncogenic mutations are rare, and most nonsynonymous changes are seen in tumour suppressor genes, including somatic mutations in TP53, BRCA1, BRCA2, RB1, and NF1 [22]. Loss of NF1, an inhibitor of RAS signalling, may occur by point mutation or structural rearrangement and may be present in subclonal populations [23–27]. The typical clinical presentation of HGSOC is with extensive abdominal disease, involving multiple implantation sites throughout the abdomen. Intra-tumour heterogeneity may contribute to acquired resistance in HGSOC [3,4,28–30], but quantitation of the degree of heterogeneity and its relationship to changes in the course of treatment or the development of resistance is unknown.
Accurately reconstructing the evolutionary history of cancer cells in an unbiased manner improves the quantification of tumour heterogeneity. However, inferring phylogenetic trees in cancers that have highly frequent somatic CNAs is particularly difficult because of the unknown phasing of parental alleles and the horizontal dependencies between adjacent genomic loci. Previous work has used ad hoc thresholds or visual analysis [15,31]. We recently developed the Minimum Event Distance for Intra-tumour Copy Number Comparisons (MEDICC) algorithm, which provides accurate estimates of evolutionary distances between tumour samples by determining the optimum phasing of major and minor alleles from copy number or whole genome sequencing (WGS) data [32]. A numerical measure of the degree of heterogeneity can also be derived by transforming the pairwise minimum event distances [32].
To address the hypothesis that quantitative measures of intra-tumour heterogeneity could predict outcome in HGSOC, we collected multiple spatially and temporally separated tumour samples from 14 women undergoing chemotherapy for HGSOC, and used formal methods to reconstruct the evolutionary history of the disease within each patient from whole genome copy number profiles.
Materials and Methods
Ethical Consent
Tissue samples were obtained from the prospective CTCR-OV03 and CTCR-OV04 clinical studies, which were designed to collect imaging, blood, and tissue samples for exploratory biomarker studies. All patients provided written, informed consent for participation in these studies and for the use of their donated tissue, blood specimens, and anonymized data for the laboratory studies carried out. The CTCR-OV03 and CTCR-OV04 studies were approved by the Suffolk Local Research Ethics Committee (reference 05/Q0102/160) and Cambridgeshire Research Ethics Committee (reference 08/H0306/61).
SNP Arrays
DNA extraction was performed using the DNeasy Blood & Tissue Kit (Qiagen) following the manufacturer’s instructions. In total, 177 samples from 18 patients were profiled for copy number aberrations using Affymetrix Genome-Wide SNP 6.0 arrays (S1 Table). Hybridisation of DNA to SNP 6.0 arrays was performed by AROS Applied Biotechnology following the manufacturer’s protocol. Array data are available online at the NCBI Gene Expression Omnibus under accession number GSE40546. The datasets were segmented using PICNIC [33] (using the “primary” option), which further corrects for cellularity and estimates integer major and minor copy numbers.
Evolutionary Inference and Tree Robustness
The MEDICC algorithm and methods for copy number reconstruction and quantification of heterogeneity have been described previously [32]. We determined the CE and temporal heterogeneity (TH) indices as described for patients with more than three samples and where paired biopsy and surgery samples were available.
Paired-End Sequencing and Breakpoint Validation
DNA extracted from tumour samples and from matched normal blood was processed using the Illumina Paired-End Sample Prep Kit. Paired-end WGS (41 bp; in some cases 50 bp trimmed to 41 bp) was performed on the Illumina Genome Analyzer IIx, where the median number of read pairs for each library was 153 million and the median sequencing depth was ×16.7. Sequencing data were processed using analysis pipelines as previously described [34]. Briefly, reads were aligned using BWA [35] and Novoalign (Novocraft Technologies), and discordantly mapped read pairs were used to identify putative structural variants using a custom pipeline. PCR primers for validating structural variants were designed using Primer3 [36].
Deletion and insertion breakpoints from WGS were considered confirmed if there was >50% reciprocal overlap of copy number decrease or increase in the SNP array data. Additionally, deletion, insertion, inter-chromosomal, and inversion breakpoints were considered confirmed if both ends of a breakpoint were within 10 kb of copy number breakpoints in any of the sequenced samples of the tumour.
Mutation Detection by Resequencing
The coding sequences of TP53, BRCA1, BRCA2, PTEN, PIK3CA, EGFR, and APC were sequenced using the TAm-Seq method using the Fluidigm Access Array 48.48 platform as described previously [37] with minor modifications: pre-amplification steps were omitted, as high-molecular-weight DNA was extracted from fresh-frozen tumour specimens, and 50 ng of sample DNA and multiplexed primers was used in the target-specific amplification step. Primer sequences are available upon request. Sequencing data analysis and variant verification was performed using an in-house-developed pipeline and IGV software as previously described [37,38].
Digital PCR
Digital PCR was performed using the Fluidigm Biomark microfluidic system according to the manufacturer’s instructions. Primers were designed spanning the NF1 deletion (forward: 5′-TTTTGTTTACGAGCACAGATAACC-3′; reverse: 5′-GAAACAGAAGATGACAGCAAAGAA-3′). Reaction mixes were prepared containing 1× TaqMan Gene Expression Master Mix (Applied Biosystems), 1× EvaGreen DNA binding dye (Biotium), 1× DNA Binding Dye Sample Loading Reagent (Fluidigm), and 10 nM primers and template DNA. Prior to loading into a 12.765 Fluidigm digital chip, reactions were heated to 95°C for 1 min and placed on ice. Reactions were thermocycled at 50°C for 2 min, 95°C for 10 min, followed by 55 cycles of 95°C for 15 s and 56°C or 60°C for 1 min. Digital PCR was also performed on the same samples using an assay for the p.R175H mutation in TP53 as previously described [39] (forward: 5′-CCATCTACAAGCAGTCAC-3′; reverse: 5′-GTCACCATCGCTATCTGAG-3′; mutant-specific probe: [6FAM]-TTGTGAGGCACTGCCCCC-[BHQ1]; wild-type-specific probe: [HEX]-TTGTGAG-GCGCTGCCCCC-[BHQ1]). The proportion of tumour cells with the NF1 deletion was calculated from the estimated counts of the assays for both the NF1 deletion and mutant TP53 p.R175H.
Study Design
Cases were retrospectively selected from available tumour samples from the CTCR-OV03 and CTCR-OV04 studies. The CTCR-OV03 study has been previously described [40] and was a prospective, single-institution, protocol-driven study with eligibility criteria of (a) clinical diagnosis of advanced ovarian cancer (International Federation of Gynecology and Obstetrics stage 3 or higher), (b) gynaecology-oncology multidisciplinary team recommendation for neoadjuvant chemotherapy treatment before interval debulking surgery, (c) measurable disease at staging based on computed tomography of the abdomen and pelvis, and (d) no contraindications to MRI [40]. Samples were stored in RNAlater (Life Technologies) immediately after acquisition and later histologically examined and scored for cellularity by a specialist gynaecological pathologist (M J.-L.). When selecting cases for analysis, 14/28 CTCR-OV03 patients were excluded from the planned analysis (six had tumours that were not HGSOC histology, five had no research tissue available, and three had samples from only one time point or one metastatic site), leaving 14 for genomic profiling. Four additional “convenience” cases were obtained from the CTCR-OV04 study and were selected by availability of ≥3 spatially discrete, fresh-frozen tumour biopsies. All patients were enrolled between 20 July 2007 and 22 October 2009. The follow-up was censored after 26 October 2013, with median duration of 31 mo (interquartile range [IQR] 22–46 mo; range 7–53 mo). Progression-free survival (PFS) was defined as the interval between the date of the original pathology report confirming ovarian cancer and the date of progression measured by RECIST 1.1, Gynecologic Cancer Intergroup CA 125 criteria, or symptomatic progression. Overall survival (OS) was defined as the interval between the date of the original pathology report confirming ovarian cancer and the date of death from any cause. Clinical details, including CA 125 measurements, stage, and residual disease after debulking surgery, were abstracted from clinical records by research staff.
Statistical Analysis Methods
A detailed transcript of all statistical analyses using R and Sweave is provided in S1 Protocol.
Results
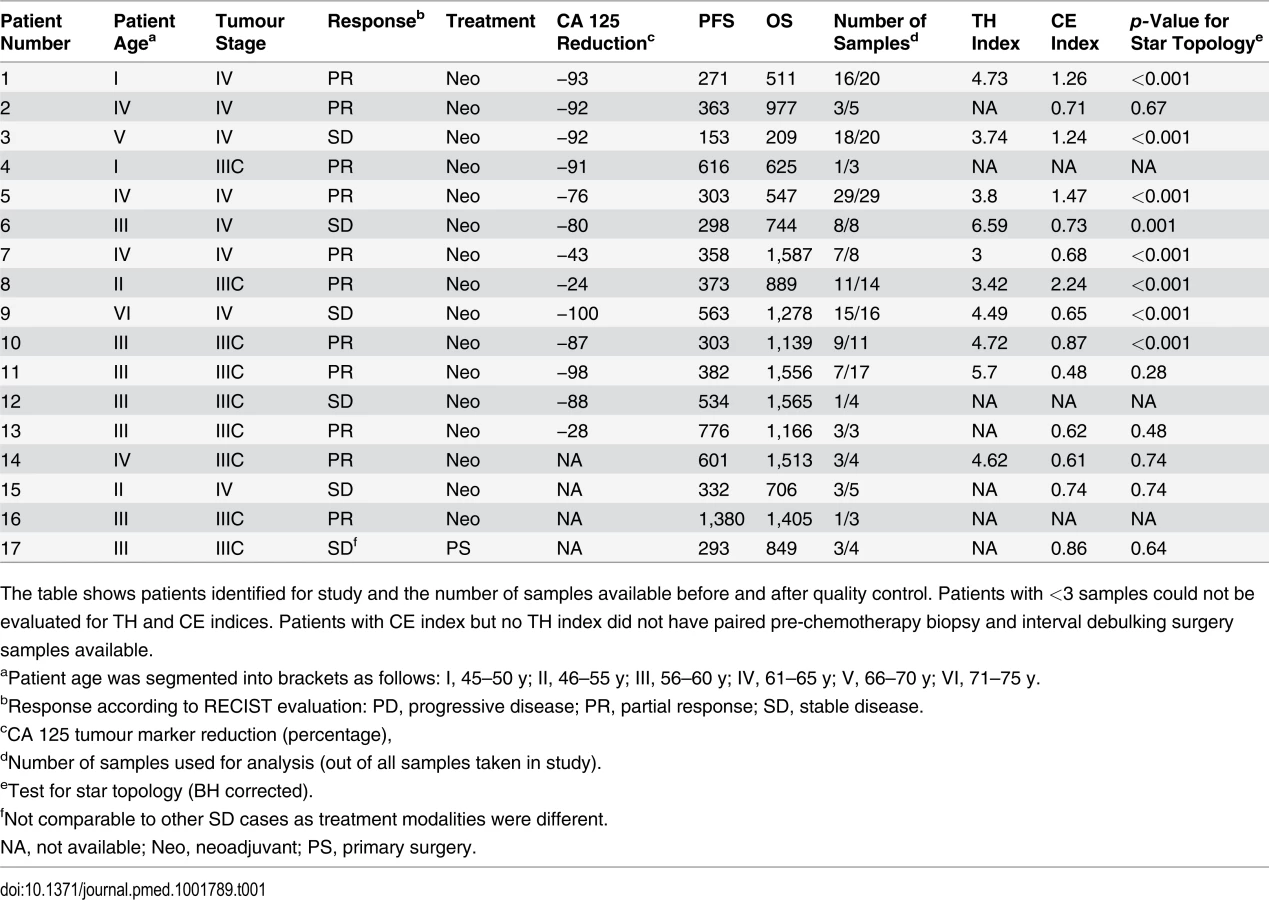
We collected 177 temporally and spatially distinct HGSOC samples from 18 patients undergoing platinum-based chemotherapy (Fig. 1A). Copy number profiles were obtained with Affymetrix Genome-Wide SNP6.0 arrays (Table 1) and segmented using PICNIC [33]. Of the 18 patients, 17 had neoadjuvant chemotherapy (Table 1). The median number of chemotherapy cycles prior to interval debulking surgery was three (range 3–7). One patient had primary surgery followed by adjuvant chemotherapy. Data from 39/177 arrays were excluded after profiling because of tumour cellularity < 50% or high noise, resulting in removal of one patient from the analysis (6/6 samples excluded), leading to a final total of 17 patients included in the following analyses. In all, 31/39 excluded arrays were from samples obtained from interval debulking surgery following pre-operative chemotherapy (S1 Table). Analyses of clonal evolution were performed using whole genome bi-allelic integer copy number profiles of 135 tumour samples from 14 patients who had ≥3 samples. Ten patients had samples both from biopsy prior to chemotherapy treatment and from interval debulking surgery, allowing for comparison of temporal effects. Two patients had relapsed ascites samples (S1 Table).

To exclude potential confounding effects on heterogeneity, we performed a detailed pathology review of all paraffin blocks from each patient. No significant differences in morphology or growth pattern were observed between metastatic sites in any patient (S1 Fig). In addition, we performed tagged-amplicon resequencing of tumour tissue for genes commonly somatically mutated in HGSOC. BRCA1 and BRCA2 were also included in the sequencing panel as OS is significantly improved in women with germ line mutations. In all, 15/17 patients had a mutation in TP53 consistent with HGSOC (Table 2) [20]. Of the two wild-type TP53 cases, patient 12 had strong nuclear p53 protein accumulation consistent with p53 dysfunction, and patient 3 was reclassified as a synchronous HGSOC and high-grade uterine serous papillary carcinoma (based on simultaneous invasive uterine and ovarian lesions together with positive WT1 immunohistochemistry). No germ line mutations in BRCA1 and BRCA2 were identified. Patient 14 had a nonsense mutation in BRCA2, and patient 2 showed variants of uncertain significance in BRCA1 somatic nonsense mutation in BRCA2, and patient 2 showed variants of uncertain significance in BRCA1 and BRCA2 (Table 2). We examined the copy number profiles for evidence of specific mutator phenotypes that would alter the propensity for evolutionary change, but did not find any patient with features of the tandem duplicator phenotype [34,41].

We recently developed the MEDICC package [32] to reconstruct patient-specific evolutionary trees and quantify heterogeneity in tumour samples using methods that employ a minimum evolution criterion to measure the genetic divergence between copy number profiles. This algorithm estimates evolutionary distances between samples based on the minimum number of segmental amplifications and deletions needed to transform one genomic profile into another using optimised allele-specific assignment of major and minor copy numbers. Using MEDICC we reconstructed evolutionary trees for 14 patients with three or more samples (Fig. 1A). Circos plots and evolutionary trees for all patients can be found in S3–S16 Figs.
Patient-Specific Copy Number Changes Cluster by Anatomical Site
As expected, CNAs were highly patient-specific. A tree reconstructed from applying MEDICC to all 135 samples grouped samples by patient (Fig. 1B). However, no clustering into subgroups with HGSOC resistant or sensitive to a second line of treatment was evident by this analysis (outer colour bar, Fig. 1B). We next applied MEDICC to each patient individually. Copy number changes within each patient showed strong divergence overall, with a median of 54.5 (IQR 32.5–65.6) genomic events. Divergence from the hypothetical normal genome was, as expected, larger, with a median of 104 events (IQR 57.8–112). Three patients showed less marked changes; reconstruction of events for patients 1 and 8 had limited phylogenetic signal owing to low divergence or limited numbers of samples, and in patient 1 we found very high heterogeneity and strong CE (discussed below).
Metastasis of HGSOC is thought to occur by physical shedding from the invasive lesions in the fallopian tube onto pelvic structures and into the abdomen, where physiological recirculation of ascites fluid facilitates widespread seeding of tumour cells. Evolutionary clades in the patient-specific trees often agreed with the anatomical sites where the sample was taken (see Fig. 2 and individual trees in S3–S16 Figs.). For example, patient 9 showed clear separation of omentum and small bowel mesentery samples (Fig. 2D), with right paracolic gutter and peritoneum as the respective out-groups. Genetic markers of this divergent evolution included Chromosomes 2q and 3p as well as amplifications on Chromosome 10 (Fig. 2C). Higher resolution analyses with paired-end WGS on samples from six patients confirmed additional divergent genetic change at higher resolution. For example, in patient 9, there were three deletion breakpoints and an insertion breakpoint that were present only in the omentum sample, and three deletion breakpoints that were only in the peritoneal sample (S18 Fig).

Analysis of Tree Topologies Suggests Metastasis-to-Metastasis Spread with Changing Evolutionary Rates
We next considered whether the observed spatial heterogeneity arose from metastasis-to-metastasis spread or by successive metastases from the primary cancer site by examining the pattern of the evolutionary relationships between metastatic samples within each patient. Given a fixed number of metastases, two scenarios are possible: if only the primary tumour gives rise to metastatic clones, the resulting evolutionary tree will have a star topology (Fig. 3A). By contrast, if cells retain their metastatic potential after metastasis, ongoing spread and associated genetic change will lead to a fully branched evolutionary tree (Fig. 3B).

We used MEDICC to test the null hypothesis for each patient that the evolutionary distances were derived from a star topology [32]. To verify and visualise the findings we applied the neighbour-net method [42], which captures non-tree-like evolutionary signals in distance data. From nine patients with ≥3 samples, eight showed significant branching (p < 0.05, chi-squared test for goodness of fit with Benjamini and Hochberg correction for false discovery rate), supporting the model of metastasis-to-metastasis spread. Patient 11 showed only a weak tree structure, and the null hypothesis could not be rejected (p = 0.22; Fig. 3A).
Next we compared evolutionary distances within each patient to investigate whether evolutionary change occurs at a constant rate (clock-like evolution). After correction for multiple testing, two out of 14 patients (14.3%) showed significant non-clock-like evolutionary trajectories (p < 0.05). We conclude that HGSOC shows metastasis-to-metastasis spread and that heterogeneity is generated through ongoing clonal evolution with potentially unknown mutator phenotypes present.
Small Changes in Heterogeneity Occur during Neoadjuvant Therapy
As most metastases are established before onset of treatment, we next investigated the rate of ongoing clonal evolution by examining samples before and after neoadjuvant chemotherapy. The average genomic change during treatment (TH index) was quantified using MEDICC. To ensure that differences were not due to cellularity, we compared histopathology estimates between the pre-chemotherapy biopsies and surgical specimens and found no significant differences (t-test, p = 0.7). MEDICC measures TH by mapping genomes into a high-dimensional space, termed the “mutational landscape” [16,17], in which distances correspond to evolutionary distances between genomes. The TH index is then calculated as the distance between the robust centres of mass of the biopsy and surgery samples [32], leading to a robust estimate of change during treatment. Visual analysis of Circos plots showed strong overall conservation, indicating that the main karyotypes for each cancer were established before onset of treatment. Quantitative analysis with MEDICC detected genomic differences between biopsy and surgery samples, showing on average 46 (standard deviation 13) new genomic events (Figs. 2A, 2C, and S3–S16). For example, for patient 6 there was a profound difference between the two sample subgroups (TH index 0.66), with early and long branching of the pre-treatment omental biopsy sample away from the remaining omental samples, indicating divergent evolution (Fig. 2A and 2B). The copy number events responsible for this divergence included deletions on Chromosomes 1p, 1q, 3p, 7q, 9q, and 11p. In patient 9, one of the three omentum samples differed in 18.1% of its genome from the omentum samples at surgery (Fig. 2C and 2D). We concluded that HGSOC shows detectable changes during neoadjuvant chemotherapy (median 75 d), but these are minor compared to the overall changes from the onset of the disease.
HGSOC is Frequently Polygenomic and Shows Variable Clonal Expansion
It has previously been shown in breast cancer that CEs of minor subpopulations of cells lead to polygenomic tumours, while other tumours appear monogenomic [6]. These CEs are potentially modulated by selection pressure from chemotherapy (or other factors) and might have prognostic value. Using MEDICC allowed statistical quantification of the degree of CE on a continuous scale (CE index) by testing for local spatial clustering of genomes in the mutational landscape [32].
We found the CE index to be variable across the cohort (median 0.73, IQR 0.65–1.24). As there was no clinically defined cutoff point for CE, the median value was used to divide patents into two groups (CE-low versus CE-high). Patients with in the CE-low group, for example patient 11, showed linear emission of samples throughout the tree and had homogenous branch lengths (S12 Fig). By contrast, patients 5 and 8, in the CE-high group, showed marked CE (CE index 1.47 and 2.24, respectively), with multiple samples in strongly diverging subclades (Fig. 4).

Patients with Tumours with High Clonal Expansion Show Short Survival and Resistant Relapse
It has been proposed that for a tumour to overcome the selection pressure applied by chemotherapy, it needs to be able to efficiently explore the mutational landscape [17]. Therefore, we hypothesized that polygenomic tumours that have already undergone CEs are likely to be at an advantage for acquiring other mutations for survival during treatment.
We used the log-rank test to test for differences in PFS and OS between the CE-low and CE-high groups (Fig. 5). Survival was shorter in patients in the CE-high group (PFS 12.7 versus 10.1 mo, p = 0.009; OS 42.6 versus 23.5 mo, p = 0.003; Fig. 5). Being in the CE-high group was an independent predictor of survival in a multivariable Cox hazard regression analysis that included patient age, tumour stage, and residual disease after debulking surgery (PFS, p = 0.001; OS, p = 0.004). Survival differences were not significant between patients with low or high TH index (S1 Protocol).

We tested CE as a continuous variable in a Cox proportional hazard model, which assumes a linear relationship between CE and survival. In univariable analysis, the quantitative CE index had a borderline significant association with OS with hazard ratio (HR) = 2.7 (95% CI 0.96, 7.8; p = 0.06), but no significant association with PFS. In multivariable models that considered CE, patient age, tumour stage, and residual disease, CE as a quantitative variable was not significantly associated with OS or PFS (coefficient p = 0.64 and p = 0.76, respectively). We examined potential nonlinear effects of CE on survival using cubic spline methods. For PFS and OS, the relationship between CE and relative hazard was nonlinear, showing a step function effect with marked increase in hazard seen at CE values greater than 0.7–0.8 (Fig. 5B; S1 Protocol), similar to the median cut point. Given the small size of the patient cohort, we performed tests of robustness using bootstrap analysis with 10,000-fold resampling to test whether the HR for the CE-high group was likely to be greater than one (deleterious for outcome). The differences in PFS and OS remained significant (p < 0.05) in 82% and 92%, respectively, of the perturbed datasets. The bootstrapped derived median HR values for PFS and OS were HR = 7.1 (95% CI > 1) and HR = 11.4 (95% CI > 1), respectively.
Resistant Subclonal Populations Are Present in Pre-Treatment Disease
The survival analyses suggested that the degree of CE could have effects on PFS and OS consistent with the hypothesis that cancers with high CE may have increased genetic diversity favouring the emergence of drug-resistant clones. We were able to explore this hypothesis in patients 5 and 8, who had additional samples collected at progression. Patient 8 had symptomatic progressive disease, with the development of ascites at 12 mo after completing chemotherapy. The phylogenetic reconstruction of her cancer showed early divergence of the ascites sample from the root (Fig. 4). Examination of the relapsed copy number profile revealed a new focal deletion at NF1 that was not present in the pre-chemotherapy and interval debulking surgery samples (Fig. 4). NF1 is recurrently mutated in HGSOC [22,23], which suggests this was unlikely to be a passenger event. As copy number profiles detect the dominant clone in a sample, we investigated the population structure of earlier samples using WGS to map the new NF1 deletion, and digital PCR to accurately estimate the number of cells containing the NF1 deletion in each sample. To prevent confounding effects from differences in tumour cellularity, the counts for the NF1 deletion were expressed as a proportion of all mutant TP53 counts. The NF1 deletion was detected at 5% and 26% in the pre-treatment samples (absolute cellularity 80% and 41%) and in 25%–100% of the interval debulking samples (median cellularity 49%). Histological analysis of the left fallopian tube specimen removed at interval debulking confirmed a tubal primary site (S1 Fig). We therefore extended the digital PCR analysis to DNA from microdissected tissues from formalin-fixed tissue blocks including the left fallopian tube fimbria. The NF1 deletion was present in 1.2% of the primary invasive carcinoma in the fallopian tube and 7.9% of the biopsy from the adjacent left ovarian metastasis (S2 Table).
In patient 5, inspection of the tree showed that the relapsed ascites sample also diverged early, with a long branch (Fig. 4) indicating marked divergent evolution. This divergence was associated with deletions on Chromosomes 1q, 15q, and 18q (S6A Fig). In summary, the NF1 deletion, while part of the dominant subpopulation at relapse, was already present pre-treatment. As it is highly unlikely that this specific deletion arose twice independently in the course of tumour evolution, we conclude that the relapse was a CE of a minor subclone of pre-chemotherapy disease.
Discussion
In this work, we tested the hypothesis that intra-tumour heterogeneity in HGSOC is correlated with survival. We also assessed whether certain subclonal populations contribute to treatment failure. Our experimental design combined two approaches: first, we analysed spatially and temporally separate tumour samples from 14 women undergoing chemotherapy. This approach estimates the genetic complexity of the cancer burden in an individual more accurately than sampling from a single location and time point [5,12,13,25]. Second, we applied formal methods (MEDICC) to infer the most parsimonious representation of genetic evolution in each patient’s cancer [32]. Importantly, our methods are fully unsupervised and are derived independently of the clinical data.
Our analyses showed marked differences in CE between patients and negative effects of high CE on survival. In two patients with very high CE, we demonstrated that clonal populations detected at relapse arose from early branching events, followed by divergent evolution and CE. Indeed, digital PCR of a NF1 deletion that marked the predominant clonal population at relapse conclusively showed that this deletion was present at very low fraction in pre-treatment samples including the tubal primary site. We further showed that HGSOC generally evolves and spreads in a branching process with frequently changing rates of evolution. Taken together, these findings are consistent with previous data from cell-based studies and circulating tumour DNA assays that suggested that CE occurs between diagnosis and relapse in HGSOC [28,37].
Although the number of HGSOC samples studied here is relatively large compared to those of other publications, the size of the patient cohort prevents strong conclusions about effect sizes and clinical impact. We used a median value for CE as an unbiased cut point to avoid strong assumptions about the relationship between CE and survival, but given the limited sample size, it is likely that our analyses overestimate the prognostic effect of CE. It is notable that the majority of the samples that failed quality assurance (and were therefore excluded from estimations of heterogeneity) were taken after chemotherapy treatment, suggesting that these samples may have had better response to treatment [28]. This implies that the samples from which our heterogeneity measures were calculated may be enriched for more chemoresistant disease. We have not defined the minimum number of samples per case that are required for accurate estimates of CE, and this will require larger patient studies. Collecting these samples remains a major challenge for heterogeneity research, owing to the difficulties of collecting multiple fresh tissue samples at different treatment time points and the costs of detailed genomic profiling. Further technological development to use shallow WGS data from formalin-fixed, paraffin-embedded samples may be a useful approach to increasing statistical power in future studies.
Comparison of the effects of CE and TH on survival showed that TH was not predictive of PFS or OS. This was surprising, as we expected strong TH effects to be correlated with response, and therefore survival. There are several factors that may explain our finding. First, we were unable to take samples from the same tumour deposit before and after chemotherapy treatment. Therefore, apparent differences in TH could be confounded by spatial differences in tumour heterogeneity, rather than representing intrinsic changes in subclonal populations caused by chemotherapy treatment. Second, the time window for evolutionary changes to occur during chemotherapy was short compared to the genetic lifespan of each cancer. Third, both CE and TH showed moderate correlation with sample size (S1 Protocol). Sample size was not significant in a multivariable Cox model, but could potentially contribute to the predictive power of CE (S1 Protocol).
Our results are in disagreement with recent findings where the analysis of nonsynonymous mutations did not show effects of ongoing evolutionary change in HGSOC [43]. These findings were based upon exome sequencing of three patients, and the power of this assay for evolutionary inference is dependent upon the depth of sequencing achieved. It is also likely that the majority of nonsynonymous changes detected by exome sequencing are passenger or private mutations, which may explain why other studies have not found evidence of the strong evolutionary patterns that we see using CNAs.
Our phylogenetic reconstructions further allowed us to assess the robustness of the evolutionary trees, and thereby the certainty of placement of a sample in the tree. With this we addressed the question of when in the course of disease the relapse clone evolved. In both patients 5 and 8, we were able to determine an early branching point as the origin of relapse that shared an immediate ancestor with a pre-treatment sample. In larger datasets these methods could be applied to the identification of early driver events and may mitigate the difficulties of identifying therapeutically relevant CNAs in heterogeneous patients.
In summary, our approach has been to define the evolutionary trajectories of HGSOC using robust and accurate methods to reconstruct the phylogenetic trees for individual patients. This approach has the potential to act as a patient-specific prognostic indicator and may be a powerful tool to identify and calibrate surrogate genomic markers of CE.
Supporting Information
Zdroje
1. Nowell PC (1976) The clonal evolution of tumor cell populations. Science 194 : 23–28. 959840
2. Dexter DL, Kowalski HM, Blazar BA, Fligiel Z, Vogel R, et al. (1978) Heterogeneity of tumor cells from a single mouse mammary tumor. Cancer Res 38 : 3174–3181. 210930
3. Khalique L, Ayhan A, Weale ME, Jacobs IJ, Ramus SJ, et al. (2007) Genetic intra-tumour heterogeneity in epithelial ovarian cancer and its implications for molecular diagnosis of tumours. J Pathol 211 : 286–295. 17154249
4. Khalique L, Ayhan A, Whittaker JC, Singh N, Jacobs IJ, et al. (2009) The clonal evolution of metastases from primary serous epithelial ovarian cancers. Int J Cancer 124 : 1579–1586. doi: 10.1002/ijc.24148 19123469
5. Shah SP, Morin RD, Khattra J, Prentice L, Pugh T, et al. (2009) Mutational evolution in a lobular breast tumour profiled at single nucleotide resolution. Nature 461 : 809–813. doi: 10.1038/nature08489 19812674
6. Navin N, Krasnitz A, Rodgers L, Cook K, Meth J, et al. (2010) Inferring tumor progression from genomic heterogeneity. Genome Res 20 : 68–80. doi: 10.1101/gr.099622.109 19903760
7. Campbell PJ, Yachida S, Mudie LJ, Stephens PJ, Pleasance ED, et al. (2010) The patterns and dynamics of genomic instability in metastatic pancreatic cancer. Nature 467 : 1109–1113. doi: 10.1038/nature09460 20981101
8. Navin N, Kendall J, Troge J, Andrews P, Rodgers L, et al. (2011) Tumour evolution inferred by single-cell sequencing. Nature 472 : 90–94. doi: 10.1038/nature09807 21399628
9. Marusyk A, Almendro V, Polyak K (2012) Intra-tumour heterogeneity: a looking glass for cancer? Nat Rev Cancer 12 : 323–334. doi: 10.1038/nrc3261 22513401
10. Vermaat JS, Nijman IJ, Koudijs MJ, Gerritse FL, Scherer SJ, et al. (2012) Primary colorectal cancers and their subsequent hepatic metastases are genetically different: implications for selection of patients for targeted treatment. Clin Cancer Res 18 : 688–699. doi: 10.1158/1078-0432.CCR-11-1965 22173549
11. Wu X, Northcott PA, Dubuc A, Dupuy AJ, Shih DJH, et al. (2012) Clonal selection drives genetic divergence of metastatic medulloblastoma. Nature 482 : 529–533. doi: 10.1038/nature10825 22343890
12. Gerlinger M, Rowan AJ, Horswell S, Larkin J, Endesfelder D, et al. (2012) Intratumor heterogeneity and branched evolution revealed by multiregion sequencing. N Engl J Med 366 : 883–892. doi: 10.1056/NEJMoa1113205 22397650
13. Shah SP, Roth A, Goya R, Oloumi A, Ha G, et al. (2012) The clonal and mutational evolution spectrum of primary triple-negative breast cancers. Nature 486 : 395–399. doi: 10.1038/nature10933 22495314
14. de Bruin EC, McGranahan N, Mitter R, Salm M, Wedge DC, et al. (2014) Spatial and temporal diversity in genomic instability processes defines lung cancer evolution. Science 346 : 251–256. doi: 10.1126/science.1253462 25301630
15. Nik-Zainal S, Van Loo P, Wedge DC, Alexandrov LB, Greenman CD, et al. (2012) The life history of 21 breast cancers. Cell 149 : 994–1007. doi: 10.1016/j.cell.2012.04.023 22608083
16. Merlo LMF, Pepper JW, Reid BJ, Maley CC (2006) Cancer as an evolutionary and ecological process. Nat Rev Cancer 6 : 924–935. 17109012
17. Greaves M, Maley CC (2012) Clonal evolution in cancer. Nature 481 : 306–313. doi: 10.1038/nature10762 22258609
18. Anderson K, Lutz C, van Delft FW, Bateman CM, Guo Y, et al. (2011) Genetic variegation of clonal architecture and propagating cells in leukaemia. Nature 469 : 356–361. doi: 10.1038/nature09650 21160474
19. Landau DA, Carter SL, Stojanov P, McKenna A, Stevenson K, et al. (2013) Evolution and impact of subclonal mutations in chronic lymphocytic leukemia. Cell 152 : 714–726. doi: 10.1016/j.cell.2013.01.019 23415222
20. Ahmed AA, Etemadmoghadam D, Temple J, Lynch AG, Riad M, et al. (2010) Driver mutations in TP53 are ubiquitous in high grade serous carcinoma of the ovary. J Pathol 221 : 49–56. doi: 10.1002/path.2696 20229506
21. Gorringe KL, Jacobs S, Thompson ER, Sridhar A, Qiu W, et al. (2007) High-resolution single nucleotide polymorphism array analysis of epithelial ovarian cancer reveals numerous microdeletions and amplifications. Clin Cancer Res 13 : 4731–4739. 17699850
22. Cancer Genome Atlas Research Network (2011) Integrated genomic analyses of ovarian carcinoma. Nature 474 : 609–615. doi: 10.1038/nature10166 21720365
23. Sangha N, Wu R, Kuick R, Powers S, Mu D, et al. (2008) Neurofibromin 1 (NF1) defects are common in human ovarian serous carcinomas and co-occur with TP53 mutations. Neoplasia 10 : 1362–1372. 19048115
24. Carter SL, Cibulskis K, Helman E, McKenna A, Shen H, et al. (2012) Absolute quantification of somatic DNA alterations in human cancer. Nat Biotechnol 30 : 413–421. doi: 10.1038/nbt.2203 22544022
25. Bashashati A, Ha G, Tone A, Ding J, Prentice LM, et al. (2013) Distinct evolutionary trajectories of primary high-grade serous ovarian cancers revealed through spatial mutational profiling. J Pathol 231 : 21–34. doi: 10.1002/path.4230 23780408
26. Zhang J, Shi Y, Lalonde E, Li L, Cavallone L, et al. (2013) Exome profiling of primary, metastatic and recurrent ovarian carcinomas in a BRCA1-positive patient. BMC Cancer 13 : 146. doi: 10.1186/1471-2407-13-146 23522120
27. Hoogstraat M, de Pagter MS, Cirkel GA, van Roosmalen MJ, Harkins TT, et al. (2014) Genomic and transcriptomic plasticity in treatment-naive ovarian cancer. Genome Res 24 : 200–211. doi: 10.1101/gr.161026.113 24221193
28. Cooke SL, Ng CKY, Melnyk N, Garcia MJ, Hardcastle T, et al. (2010) Genomic analysis of genetic heterogeneity and evolution in high-grade serous ovarian carcinoma. Oncogene 29 : 4905–4913. doi: 10.1038/onc.2010.245 20581869
29. Cooke SL, Brenton JD (2011) Evolution of platinum resistance in high-grade serous ovarian cancer. Lancet Oncol 12 : 1169–1174. doi: 10.1016/S1470-2045(11)70123-1 21742554
30. Wang ZC, Birkbak NJ, Culhane AC, Drapkin R, Fatima A, et al. (2012) Profiles of genomic in-stability in high-grade serous ovarian cancer predict treatment outcome. Clin Cancer Res 18 : 5806–5815. doi: 10.1158/1078-0432.CCR-12-0857 22912389
31. Cowin PA, George J, Fereday S, Loehrer E, Van Loo P, et al. (2012) LRP1B deletion in high-grade serous ovarian cancers is associated with acquired chemotherapy resistance to liposomal doxorubicin. Cancer Res 72 : 4060–4073. 22896685
32. Schwarz RF, Trinh A, Sipos B, Brenton JD, Goldman N, et al. (2014) Phylogenetic quantification of intra-tumour heterogeneity. PLoS Comput Biol 10: e1003535. doi: 10.1371/journal.pcbi.1003535 24743184
33. Greenman CD, Bignell G, Butler A, Edkins S, Hinton J, et al. (2010) PICNIC: an algorithm to predict absolute allelic copy number variation with microarray cancer data. Biostatistics 11 : 164–175. doi: 10.1093/biostatistics/kxp045 19837654
34. Ng CKY, Cooke SL, Howe K, Newman S, Xian J, et al. (2012) The role of tandem duplicator phenotype in tumour evolution in high-grade serous ovarian cancer. J Pathol 226 : 703–712. doi: 10.1002/path.3980 22183581
35. Li H, Durbin R (2009) Fast and accurate short read alignment with Burrows-Wheeler transform. Bioinformatics 25 : 1754–1760. doi: 10.1093/bioinformatics/btp324 19451168
36. Untergasser A, Cutcutache I, Koressaar T, Ye J, Faircloth BC, et al. (2012) Primer3—new capabilities and interfaces. Nucleic Acids Res 40: e115. 22730293
37. Forshew T, Murtaza M, Parkinson C, Gale D, Tsui DWY, et al. (2012) Noninvasive identification and monitoring of cancer mutations by targeted deep sequencing of plasma DNA. Sci Transl Med 4 : 136ra68. doi: 10.1126/scitranslmed.3003726 22649089
38. Robinson JT, Thorvaldsdóttir H, Winckler W, Guttman M, Lander ES, et al. (2011) Integrative genomics viewer. Nat Biotechnol 29 : 24–26. doi: 10.1038/nbt.1754 21221095
39. Archibald KM, Kulbe H, Kwong J, Chakravarty P, Temple J, et al. (2012) Sequential genetic change at the TP53 and chemokine receptor CXCR4 locus during transformation of human ovarian surface epithelium. Oncogene 31 : 4987–4995. doi: 10.1038/onc.2011.653 22266861
40. Sala E, Kataoka MY, Priest AN, Gill AB, McLean MA, et al. (2012) Advanced ovarian cancer: mul-tiparametric MR imaging demonstrates response-and metastasis-specific effects. Radiology 263 : 149–159. doi: 10.1148/radiol.11110175 22332064
41. McBride DJ, Etemadmoghadam D, Cooke SL, Alsop K, George J, et al. (2012) Tandem duplication of chromosomal segments is common in ovarian and breast cancer genomes. J Pathol 227 : 446–455. doi: 10.1002/path.4042 22514011
42. Bryant D, Moulton V (2004) Neighbor-net: an agglomerative method for the construction of phylogenetic networks. Mol Biol Evol 21 : 255–265. 14660700
43. Castellarin M, Milne K, Zeng T, Tse K, Mayo M, et al. (2012) Clonal evolution of high-grade serous ovarian carcinoma from primary to recurrent disease. J Pathol 229 : 515–524. doi: 10.1002/path.4105 22996961
Štítky
Interní lékařstvíČlánek vyšel v časopise
PLOS Medicine
2015 Číslo 2
- Proces hojení ran krok za krokem a co ho může zkomplikovat
- Limity glykovaného hemoglobinu a význam dalších glykovaných proteinů
- Korelace dávky levothyroxinu s titrem autoimunitních protilátek u primární hypotyreózy
- Plicní hypertenze – syndrom mnoha tváří – vyžaduje přesnou diagnostiku a specializovanou léčbu
- Rána vizitkou (nejen) chirurga
Nejčtenější v tomto čísle
- Spatial and Temporal Heterogeneity in High-Grade Serous Ovarian Cancer: A Phylogenetic Analysis
- The Movement of Multidrug-Resistant Tuberculosis across Borders in East Africa Needs a Regional and Global Solution
- Enabling Dynamic Partnerships through Joint Degrees between Low- and High-Income Countries for Capacity Development in Global Health Research: Experience from the Karolinska Institutet/Makerere University Partnership
- The Role of Alleles in Susceptibility to Haloperidol-Induced Toxicity in Mice and Humans
Zvyšte si kvalifikaci online z pohodlí domova
Mazová zátka a její řešení
nový kurzVšechny kurzy