
Is Economic Growth Associated with Reduction in Child Undernutrition
in India?
Background:
Economic growth is widely perceived as a major policy instrument in reducing
childhood undernutrition in India. We assessed the association between
changes in state per capita income and the risk of undernutrition among
children in India.
Methods and Findings:
Data for this analysis came from three cross-sectional waves of the National
Family Health Survey (NFHS) conducted in 1992–93,
1998–99, and 2005–06 in India. The sample sizes in the
three waves were 33,816, 30,383, and 28,876 children, respectively. After
excluding observations missing on the child anthropometric measures and the
independent variables included in the study, the analytic sample size was
28,066, 26,121, and 23,139, respectively, with a pooled sample size of
77,326 children. The proportion of missing data was
12%–20%. The outcomes were underweight,
stunting, and wasting, defined as more than two standard deviations below
the World Health Organization–determined median scores by age and
gender. We also examined severe underweight, severe stunting, and severe
wasting. The main exposure of interest was per capita income at the state
level at each survey period measured as per capita net state domestic
product measured in 2008 prices. We estimated fixed and random effects
logistic models that accounted for the clustering of the data. In models
that did not account for survey-period effects, there appeared to be an
inverse association between state economic growth and risk of undernutrition
among children. However, in models accounting for data structure related to
repeated cross-sectional design through survey period effects, state
economic growth was not associated with the risk of underweight (OR 1.01,
95% CI 0.98, 1.04), stunting (OR 1.02, 95% CI 0.99,
1.05), and wasting (OR 0.99, 95% CI 0.96, 1.02). Adjustment for
demographic and socioeconomic covariates did not alter these estimates.
Similar patterns were observed for severe undernutrition outcomes.
Conclusions:
We failed to find consistent evidence that economic growth leads to reduction
in childhood undernutrition in India. Direct investments in appropriate
health interventions may be necessary to reduce childhood undernutrition in
India.
:
Please see later in the article for the Editors' Summary
Published in the journal:
. PLoS Med 8(3): e32767. doi:10.1371/journal.pmed.1000424
Category:
Research Article
doi:
https://doi.org/10.1371/journal.pmed.1000424
Summary
Background:
Economic growth is widely perceived as a major policy instrument in reducing
childhood undernutrition in India. We assessed the association between
changes in state per capita income and the risk of undernutrition among
children in India.
Methods and Findings:
Data for this analysis came from three cross-sectional waves of the National
Family Health Survey (NFHS) conducted in 1992–93,
1998–99, and 2005–06 in India. The sample sizes in the
three waves were 33,816, 30,383, and 28,876 children, respectively. After
excluding observations missing on the child anthropometric measures and the
independent variables included in the study, the analytic sample size was
28,066, 26,121, and 23,139, respectively, with a pooled sample size of
77,326 children. The proportion of missing data was
12%–20%. The outcomes were underweight,
stunting, and wasting, defined as more than two standard deviations below
the World Health Organization–determined median scores by age and
gender. We also examined severe underweight, severe stunting, and severe
wasting. The main exposure of interest was per capita income at the state
level at each survey period measured as per capita net state domestic
product measured in 2008 prices. We estimated fixed and random effects
logistic models that accounted for the clustering of the data. In models
that did not account for survey-period effects, there appeared to be an
inverse association between state economic growth and risk of undernutrition
among children. However, in models accounting for data structure related to
repeated cross-sectional design through survey period effects, state
economic growth was not associated with the risk of underweight (OR 1.01,
95% CI 0.98, 1.04), stunting (OR 1.02, 95% CI 0.99,
1.05), and wasting (OR 0.99, 95% CI 0.96, 1.02). Adjustment for
demographic and socioeconomic covariates did not alter these estimates.
Similar patterns were observed for severe undernutrition outcomes.
Conclusions:
We failed to find consistent evidence that economic growth leads to reduction
in childhood undernutrition in India. Direct investments in appropriate
health interventions may be necessary to reduce childhood undernutrition in
India.
:
Please see later in the article for the Editors' Summary
Introduction
Macro-economic growth is considered a major, and often the only, policy instrument to improving health and nutrition in developing countries [1]–[3]. The premise is that economic growth will improve incomes, especially among the poor, and increase their access to and consumption of health-promoting goods and services, leading to improved nutritional status. This argument has also been made in the context of reducing undernutrition in developing countries (Figure 1) [4]. One can postulate three non-exclusive pathways through which economic growth could improve nutritional status among children. These include (i) an increase in income for all, (ii) reduction in poverty, and (iii) investment in public programs, such as the Integrated Child Development Services Scheme, which directly or indirectly could lead to improvement in children's nutritional status [3],[5]. The distinction between pathways related to “reduction in poverty” and “increases in income for all” is important as it emphasizes the importance of income increases among the poor. One might, for instance, expect the effect of income on nutrition to be considerably stronger among those with low incomes, as opposed to income increases at the higher end of the distribution, where further increases might not result in proportionally higher nutritional dividends. While the first two pathways rely on behavioral change at the individual or household level as a result of improved economic standard of living, the third underscores the role of public investment facilitated either by greater economic growth and potential increases in revenue or independent of it [6],[7]. The success of such a “growth-mediated” strategy to reducing undernutrition is, however, neither automatic nor necessary [8]–[10]. For instance, factors such as education of women and household size have been shown to have a greater influence on the nutrition of a household than macro-economic growth translated to improvements in income leading to improvements in nutritional outcomes [11],[12]. Further, there is a body of research arguing that it is healthier populations, for example with healthy nutritional indicators, that are a pre-requisite for increased economic growth and improved standard of living [13],[14].

To our knowledge only one previous study has focused on the relationship between economic growth and child undernutrition [3]. This study used data from 63 countries and found that economic growth at the national level was inversely associated with risk of child undernutrition. However, this study was an ecological analysis and used data from 1970 to 1996. Ecological analyses assume that the risk of undernutrition is the same for every child within a state. The biggest shortcoming of ecological models is their inability to quantify the association between country-level growth and individual-level risk of undernutrition, which inherently is a multilevel question. Over the last two decades India has experienced rapid economic growth, with growth rates greater than 7% between 1994 and 1997 and a 9% or greater rate after 2005 [15]. The persistence of undernutrition among children in India also remains a critical public health concern [16]–[18]. We are not aware of any study that has applied a multilevel framework and used recent data to empirically examine whether improvements in economic growth have led to reductions in the risk of undernutrition among children in India.
Using three waves of nationally representative micro-data on childhood undernutrition as well as macro-data on state economic growth, we investigated the association between economic growth and child undernutrition in India.
Methods
Data
Data for this study came from three rounds of the NFHS conducted in India in 1992–93, 1998–99, and 2005–06. These repeated cross-sectional surveys were established to especially collect data on maternal and child health indicators that are representative at the national and state levels [19]. The NFHS is part of the Demographic and Health Surveys (DHS) that are operational in more than 80 countries (http://www.measuredhs.com/aboutsurveys/dhs/start.cfm).
Sampling Plan
The NFHS used a multi-stage stratified cluster sampling design to collect data from respondents across India [19],[20]. At the first stage, populations were stratified by urban and rural area of residence in each state. The sample size at the state level was proportional to the size of the state's urban and rural populations. In rural areas villages or clusters of villages were the primary sampling units and they were selected based on a probability proportional to population size (PPS), followed by a random selection of households within villages. The urban sample was obtained by selecting wards with PPS, followed by a random selection of one census enumeration block within the sample ward, and then a random selection of households. Within the urban and rural households, all ever-married women aged 15–49 years who resided the previous night in the household were qualified to be respondents in the survey. All three surveys largely followed the above sampling scheme, with a few differences. For instance, in 1992, the urban sample was selected by first stratifying urban areas into (i) extremely large cities, (ii) district headquarters, and (iii) other towns, followed by random selection of census enumeration blocks within them, and then by random selection of households within the blocks. In the same survey, the age range for eligibility was 13–49 years as compared to 15–49 in other rounds. Meanwhile, in 2005, the ever-married criterion was not applied as an eligibility condition. The response rate for women was 96.1% in 1992–93, 95.5% in 1998–99, and 94.5% in 2005–06 [20].
Study Population and Sample Size
In order to ensure comparability of data across different waves, we applied the following inclusion criteria; we only used data on children born as singletons to ever-married women aged 15–49 who participated in the interview in any of the three surveys, and were between 0 and 35 months in age and alive at the time of survey (n = 93,075). We excluded children missing data on height or weight (n = 13,013 for underweight, n = 12,639 for stunting, and n = 12,692 for wasting) and covariates such as age and parental education (n = 1,231). Information on children was not ascertained in the states of Sikkim in 1992–93 and Tripura in 1998–99. In order to make the samples comparable across surveys, we excluded 1,505 records from these two states in the years that the data were available. Figure 2 shows the original sample size for each of the three survey waves, details of inclusion and exclusion criteria, and the resulting analytic sample size for each survey. In the 1992–93 wave, there were 33,816 children who met the inclusion criteria. We excluded children with missing data on covariates (n = 597) and those residing in Tripura (n = 363). We further excluded those with missing data on weight (n = 5,104), with a sample size of 28,066 children (83% of the 33,816 eligible children) for the underweight analysis. For the analyses related to stunting and wasting, we had to exclude 7,576 children as height was not measured in the states of Andhra Pradesh, Himachal Pradesh, Madhya Pradesh, Tamil Nadu, and West Bengal in the 1992–93 wave. Additionally, excluding those missing data on height (n = 5,029) and height and weight (n = 5,014) gave us the final analytic samples of 20,565 (78.40% of the 26,230 eligibles) and 20,580 (78.46% of the 26,230 eligibles) for the analyses of stunting and wasting, respectively.

In the 1998–99 survey, 30,383 children met the inclusion criteria. Excluding children missing data on covariates (n = 96) and those residing in Sikkim (n = 437), there were 29,850 observations. Further excluding those missing data on weight (n = 3,729) yielded 26,121 (85.97% of the 30,383 eligibles) observations for the underweight analysis. Additionally, we excluded 6,822 children from the stunting and wasting analyses because they were from the five states where height was not measured in 1992. Further excluding those missing data on height (n = 4,142) and height and weight (n = 4,210) gave us the final analytic samples of 18,786 (79.73% of the 23,561 eligibles) for stunting and 18,718 (79.45% of the 23,561eligibles) for wasting.
Among the 28,876 who met the inclusion criteria in 2005–06, we excluded children with missing data on covariates (n = 852) and those residing in Sikkim or Tripura (n = 705). Excluding those missing data on weight (n = 4,180) resulted in an analytic sample of 23,139 observations (80.13% of the 28,876 eligibles) for the underweight analysis. Also, 6,428 children, from the states where height was not measured in 1992, were excluded from the stunting and wasting analyses. The same number of observations (n = 3,468) were missing data for height as well as height and weight, resulting in a final analytic sample of 17,423 (77.62% of the 22,448 eligibles) for both stunting and wasting.
We then pooled data from the 1992–93, 1998–99, and 2005–06 surveys for a final sample size of 77,326, 56,774, and 56,721 for the analyses of underweight, stunting, and wasting, respectively. Three new states were created between 1992 and 2006: Bihar had been split into Chhattisgarh and Bihar, Madhya Pradesh split into Jharkhand and Madhya Pradesh, and Uttar Pradesh split into Uttaranchal and Uttar Pradesh. To handle the issue of new states, we pooled the information of the new states with the data from their parent states.
Outcomes
We defined children's undernutrition status based on their anthropometry along three dimensions: weight-for-age, height-for-age, and weight-for-height [21],[22]. Weight of the child was obtained by trained investigators who weighed each child with a solar-powered scale accurate to within 100 g. The investigators also measured each child's height with an adjustable measuring board calibrated in millimeters [23]. We used the internationally accepted World Health Organization Child Growth Standards to classify a child as undernourished or not. Specifically, we applied the “standard” version of the SAS macro provided by WHO (http://www.who.int/childgrowth/software/en/) in order to calculate the z scores for each child's weight-for-age, height-for-age, and weight-for-height. The SAS macro involves a lengthy computation that accomplishes the equivalent of dividing a child's weight by the median weight for a child of that age and sex, dividing a child's height by the median height for a child of that age and sex, and dividing a child's weight by the median weight for a child of that height and sex. Each of these numbers is then standardized as a z score with a mean of 0 and a standard deviation (SD) of 1. Each anthropometric measure of undernutrition was defined as “present” if the z score was more than 2 SDs below the World Health Organization–determined median scores [24]. These median values differ by age (measured in months) and gender, are considered the international standard, and have been computed by the WHO Multicentre Growth Reference Study. Thus, children whose weight-for-age z scores were more than 2 SDs below the median for their age and gender were defined as being underweight, those with height-for-age z scores more than 2 SDs below the median were defined as being stunted, and those with weight-for-height z scores more than 2 SDs below the median were defined as wasted. We also considered severe anthropometric failure, defined as more than 3 SDs below the World Health Organization–determined median scores. Thus, children whose weight-for-age z scores were more than 3 SDs below the median for their age and gender were defined as being severely underweight, those with height-for-age z scores more than 3 SDs below the median were defined as being severely stunted, and those with weight-for-height z scores more than 3 SDs below the median were defined as severely wasted [24].
Exposure
We used per capita net state domestic product (hereafter referred to as state per capita income), expressed in Indian Rupees (INR), as a measure of a state's economic development. These data were obtained from the Reserve Bank of India, for the years 1993, 1998, and 2005, and measured in 2008 rupees [25]. The state per capita income is a measure of the economic performance of a state, with higher values indicating higher levels of economic development. Formally, it is the value of all goods and services produced within the boundaries of a state for that year, minus the cost of capital used in the production. Our measure of state per capita income correlates highly with estimates from other independent surveys [26]. Further, this measure is used by the Government of India to allocate central resources among various states [27]. Since per capita income was measured at multiple times for the same state, by including it in regression models that account for state effects, we were able to estimate the effect of “within” state change in per capita income, which essentially can be interpreted as economic growth. To overcome the issue of new states that were created after 1992, we imputed the mean of the state per capita income of the new states and that of their parent states as the state per capita income of the parent state, ensuring repeated measures of state per capita income for every state for each of the three waves. In the analysis, state per capita income was centered at its mean and divided by 5,000 to get estimates in units of 5,000 INR (∼$107). We also computed a “percent change in per capita income” measure for use in sensitivity analyses. The measure was calculated as follows: per capita income in 2005 minus per capita income in 1998 divided by per capita income in 1998, expressed as a percentage. Similar “percent change” measures were computed using differences between per capita incomes in 1998 and 1992 as well as 2005 and 1992.
Covariates
Age, sex, and birth order of the child; mother's age, marital status, and education; father's education, caste, and religion; and household wealth, urban/rural status, survey year, and state of residence were included as covariates in the study (Table S1). Age was measured in months and centered around 18, the mean. Birth order was categorized as first, second, third, fourth, and fifth or greater. Mother's age in years was classified as less than 17, 17–19, 20–24, 25–29, and more than 29 years. Mother's marital status at the time of survey was classified as married if she was living with her husband and as unmarried if she was widowed, divorced, or separated. Mother's and father's education were defined using years of schooling and grouped using important benchmarks in the Indian educational system: 0 (no schooling), 1–5 (primary), 6–10 (secondary), 11–12 (higher secondary), and 13 or more (some college or more). Caste identification was based on the self-reports of the mother and was grouped as scheduled caste, scheduled tribe, general caste, or no caste. Scheduled castes are those whose members have the greatest burden of deprivation within the caste system [28]. Scheduled tribes include approximately 700 officially recognized social groups that have historically been geographically and socially isolated and represent the “indigenous” groups in India [29]. The general caste is a residual category containing those not identifying themselves as members of legislatively recognized marginalized classes of scheduled castes or tribes, but includes the “other backward class” and the “high”-caste groups. “Other backward class” is a legislatively defined group representing those who have historically been subject to significant deprivation that is not as severe as that of scheduled castes and tribes. “High” caste groups are those groups of castes that are historically and socially considered to be at the top of the caste-based hierarchy. Religion of the child was based on the head of household's self-identification as Hindu, Muslim, Christian, Sikh, or other/missing religion. Household wealth was measured using an asset index, defined in terms of ownership of material possessions [30], with each household assigned a wealth score based on a combination of different household characteristics that were weighted according to a factor analysis procedure. For this procedure, z scores were calculated for each indicator variable and a principal components analysis was performed using these z scores. For each household, the values of the indicator variables were multiplied by the factor loadings of the first principal component and summed to produce a standardized household index value with a mean of 0 and a standard deviation of 1. This standardized score was then divided into quintiles. In order to capture the relative disparity among different wealth quintiles in each year, the quintiles were created separately for each survey. Using the 2001 Indian National Census definition, households were grouped based on location in either an urban area or a rural village. Survey year was included using one indicator variable each for the three surveys. Similarly, indicator variables for each state were used in fixed effects models.
Analysis
We estimated multilevel logistic regression models with a log link function to analyze the binary outcomes associated with underweight, stunting, and wasting, which in turn provided the odds ratios (ORs) along with their 95% confidence intervals. We accounted for the clustering in our observations due to mothers and primary sampling unit by specifying a random effect for each mother and primary sampling unit. We estimated our models with states specified as random effects (thus accounting for non-independence among observations within a state) and as fixed effects in separate models; while the former has the advantage of being more efficient [31], the latter is often considered to be less biased as all the observed and unobserved characteristics of the state that are time-constant are accounted for [32]. We conducted our analysis with both approaches also as a test of sensitivity of our findings to choice of modeling strategy. As is required in models with repeated cross-sectional measurements, as well as to account for the survey period differences, indicator variables for survey year 1998–99 and 2005–06 were included, with the reference being survey period 1992–93. Adjusting for the survey year also accounts for any national-level unique changes occurring during that year that might affect child undernutrition and also be associated with state-level economic growth. We did not specify state-specific survey-period differences in order to not control for factors that could have been due to state economic growth and resulted in reduction of child undernutrition. Model estimation was based on penalized quasi-likelihood procedures with first-order Taylor linearization as implemented in MLwiN [33]. Data management was performed in SAS [34].
We first estimated a model with only per capita state income that simply accounted for the repeated cross-sectional data structure. We then added child's age and gender in the second model, and then added birth order, maternal age, maternal education, paternal education, household wealth, caste, religion, and urban residence (fully adjusted model). We repeated these models also for severe undernutrition measures. To test how robust our findings were to choice of model, we fit a series of ecological and multilevel models using the per capita income measure in 5,000 INR units as well as a measure of percentage change in per capita income. We additionally conducted sensitivity analyses to determine if the missing data were differentially distributed across covariates and if the proportion of missing data in a state was related to its per capita income. The sensitivity analyses also included fitting a second set of multilevel models for stunting and wasting using data only from 1998 and 2005, in order to include data from the five states that were missing height data in 1992.
Research Ethics
The NFHS has been conducted under the scientific and administrative supervision of the International Institute for Population Sciences, Mumbai, India, a regional center for teaching, training, and research in population studies that is associated with the Ministry of Health and Family Welfare of the Government of India. The institute conducts an independent ethics review of the NFHS protocol. Data collection procedures were also approved by the ORC Macro (Calverton, Maryland) institutional review board. Oral informed consent for the interview/survey and measurements was obtained by interviewers from the participating mothers [20]. The present analysis was reviewed by the Harvard School of Public Health Institutional Review Board and was considered exempt from full review because the study was based on an anonymous public use data set with no identifiable information on the survey participants.
Results
The distribution of covariates did not differ in any substantial manner between children with and without missing data on the outcomes. The greatest difference between records with and without missing data on underweight (Table S2) was in the distribution of maternal education (p<0.001) in 1998–99, where 65.59% of those missing data had zero years of education versus 52.28% among those without missing data. The distribution of maternal education between those with and without missing data showed the greatest difference for stunting and wasting as well (p<0.001 for both outcomes). While the difference was 67.36% versus 54.61% for stunting (Table S3), it was 66.45% versus 54.81% for wasting (Table S4). There was variation in the proportion of missing data across states, ranging from 4.7% to 41.89% in 1992–93, 3.23% to 37.13% in 1998–99, and 5.7% to 42.28% in 2004–05. However, there was no correlation (substantively and statistically) between the proportion of missing data in a state and its per capita income (Table S5). The proportion of missing data was negatively correlated with state per capita income in 1992–93 and 1998–99; for example, the correlations for stunting were r = −0.37, p = 0.12 in 1992–93, and r = −0.27, p = 0.26 in 1998–99. However, the correlation was positive in 2004–05 (for stunting, r = 0.39, p = 0.10).
The prevalence of underweight decreased from 49.1% (CI 48.1%–50.2%) in 1992–93 to 43.8% (CI 42.9%–44.8%) in 1998–99 to 40.2% (CI 39.1%–41.3%) in 2005–06 (Figure 3). Stunting prevalence also decreased from 52.4% (CI 51.3%–53.6%) to 45.9% (CI 44.8%–47.1%) during the same time period, while the prevalence of wasting decreased only marginally from 24% (CI 23%–25%) in 1992–93 to 22% (CI 21%–23%) in 2005–06. There was substantial variation between states in each of the measures of undernutrition (Table 1). For instance, in 1992, the prevalence of underweight varied between 19.3% in Mizoram and 60.7% in Bihar, while in 2005–06 it varied between 14.3% in Mizoram and 55.2% in Madhya Pradesh. Other measures of undernutrition also showed substantial state variability over time. The state per capita income increased, on average, from INR 7,965.46 (∼$166) in 1993 to 18,089.50 (∼$377) in 1998 and 26,308.33 (∼$548) in 2005, an increase of 230% over a period of 12 years (Table 2). There was substantial variation both in the levels of economic development as well as the rate of increase during the study period. Bihar was the state with the lowest state per capita income (and rate of growth) at all three time points, while the state with the highest state per capita income was New Delhi in 1993 and Goa in 1999 and 2005 (Table 2). The state that experienced the most growth was Goa. The decline in prevalence of underweight between 1992 and 2005 was 0.46 in Bihar, 0.83 in New Delhi, and 0.74 in Goa (measured in percentage points per year).


In models with random effects for state, primary sampling unit, and mother, adjusted only for survey year, an increase in state per capita income of INR 5,000 over 6.5 years was associated with an OR of 1.01 (95% CI 0.98, 1.04) for underweight, OR of 1.02 (95% CI 0.99, 1.05) for stunting, and an OR of 0.99 (95% CI 0.96, 1.02) for wasting (Table 3). Upon additionally adjusting the model for age and sex of the child, the association between change in the per capita state income and the individual risk of being undernourished remained unaltered, with an OR of 1.01 (95% CI 0.98, 1.04) for underweight, OR of 1.02 (95% CI 0.99, 1.05) for stunting, and an OR of 0.99 (95% CI 0.96, 1.02) for wasting. Further adjustment of demographic and socioeconomic covariates measured at the level of mother, father, and household did not alter the unadjusted estimates—the ORs were 1.03 (95% CI 1.00, 1.06) for underweight, 1.04 (95% CI 1.01, 1.07) for stunting, and 1.00 (95% CI 0.97, 1.04) for wasting. While the above estimates were based on states as random effects, the estimates were identical when states were specified as fixed effects (Table 3).
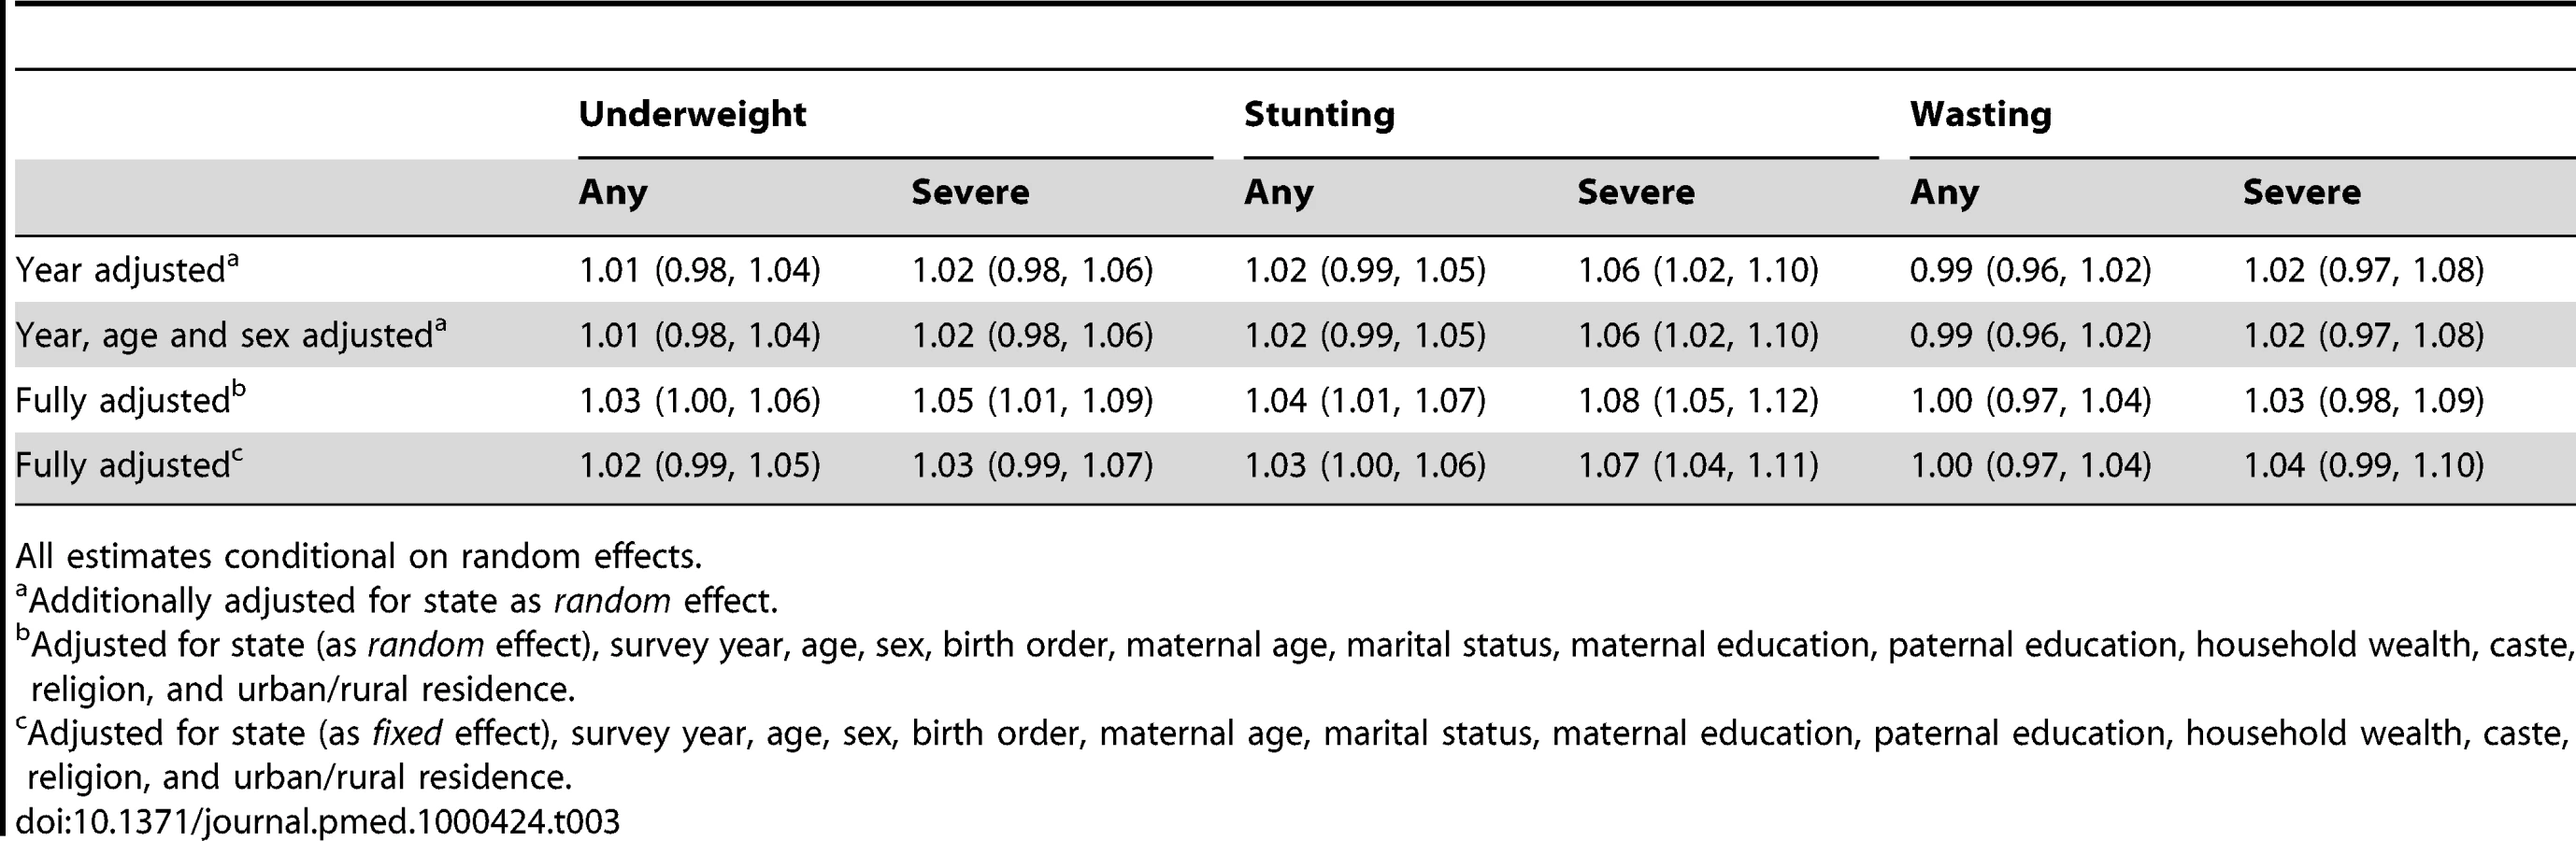
The results for “severe” outcomes were similar to the results for “any” undernutrition outcomes, with the exception of severe stunting (Table 3). A 5,000 INR increase in per capita state income over 6.5 years was associated with a marginally higher risk of severe stunting with an OR of 1.06 (95% CI 1.02, 1.10) in the model adjusted for survey year and an OR of 1.08 (95% CI 1.05, 1.12) in the fully adjusted model.
In five of eight possible ecological models that could be estimated with our data, there was no statistically significant association between state economic growth and mean levels of child undernutrition at the state level (Table 4). Similarly, in 8 of 10 multilevel models, there was no statistical support for an inverse association between per capita income (1998) or economic growth (all years) and undernutrition. Per capita income or economic growth was inversely associated with undernutrition in 3 of the ecological and 2 of 10 multilevel models, especially in a multilevel model that used data from all three surveys but did not account for the survey year (Model 17). Upon including survey year, the inverse association was no longer observed in this model (Model 18).

Economic growth was not associated with stunting, severe stunting, wasting, and severe wasting even when we used data only from 1998 and 2005 (which allowed us to include data from the five states that did not contain height data in 1992) (Table 5) as well as in models that accounted for sampling weights (Table S6).

The associations between undernutrition and the social factors included as covariates were in the expected direction (Table 6). Compared to children from households in the highest wealth quintile, children in the lowest quintile had an OR of 2.44 (95% CI 2.25, 2.65) of being underweight, an OR of 1.97 (95% CI 1.81, 2.13) of being stunted, and an OR of 1.64 (95% CI 1.48, 1.82) of being wasted. Similarly, we observed a gradient in the risk of being underweight across levels of maternal and paternal education. Compared to children of mothers with more than a college education, children of mothers who did not attend school had twice the odds of being underweight (OR = 2.04, 95% CI 1.82, 2.29), stunted (OR = 1.97, 95% CI 1.77, 2.20), and about 20% greater odds of being wasted (OR = 1.19, 95% CI 1.04, 1.38). The graded increase in the odds of being undernourished at lower levels of maternal education was clear for underweight and stunting but not for wasting. Similar patterns were observed with paternal education for all three undernutrition indicators.

Discussion
We found no consistent association between the risk of child undernutrition and state economic growth in India. A unique strength of our study was linking state economic growth to individual risk of undernutrition at the child level, and doing so with three repeated cross-sections of multilevel data. While we are not aware of any study examining this question in India or elsewhere, our findings are similar to those observed, albeit using cross-sectional multilevel data, on nutritional status of adult women in India, wherein no association was observed between state economic growth and risk of being underweight [35]. In one global ecologic study that used data from 63 countries over 26 years to examine a similar research question [3], it was shown that economic growth at the national level was inversely associated with risk of child undernutrition. The study also concluded that economic growth was responsible for about half the reduction in child undernutrition in that time period and that approximately half of this effect of economic growth was through increased food availability and the rest due to improvements in women's education, quality of health environment, and women's status. However, this is not directly comparable to our study primarily because it was an ecological study that did not account for individual-level factors. Among the eight ecological models we fit, we found support for the inverse association between economic growth (or per capita income in some cases) in only three models. It is important to be cautious while interpreting results from ecological studies in which both the outcome and exposure are measured at aggregate level as there is an assumption that the risk of undernutrition is the same for every child within a state/country. Such analyses are unable to measure the inherently multilevel association between economic growth, whether at the country or state level, and individual risk of undernutrition. Our multilevel findings, which are contrary to those reported in the between-country study, underscore the importance of avoiding generalizations from the country-level scale to the state-level, as well as the shortcomings of ecological analyses in examining a multilevel relationship.
Multilevel models correctly recognize that the likelihood of undernutrition can vary within a state between children, and also can vary between states. Critically, and very relevant to this study, multilevel models allow us to partition the variance in the probability of being undernourished into the part that is attributable to state-level factors and the part attributable to individual-level factors. They also enable us to quantify the association between a state-level exposure such as economic growth and an individual-level outcome such as the probability of being undernourished, having accounted for household, parental, and individual covariates. In only 2 of 10 multilevel models, we observed a support for an inverse association between per capita income (1998) or economic growth (all years) and undernutrition.
It must be noted that the multilevel model using data from three surveys that supported an inverse association does not account for survey-period differences. It is possible that the survey-period effects may capture changes unique to those years in programs that benefited from economic growth. Under the scenario where all consequential programs that could lead to reduction in child undernutrition were a result of only economic growth, our analysis suggests that a 5,000 INR increase in growth over 6.5 years is associated with a 4% to 7% reduced probability of undernutrition among children. However, this scenario is highly unlikely since a substantial number of programs are financed through the central government and/or by international agencies. In the context of our study, one example of unique changes in the 1998–99 survey period could be the Pulse Polio Campaign, an annual nationwide campaign to vaccinate all children under 5 years of age with Oral Polio Vaccine, which was initiated in 1995–96 [36]. This campaign was accompanied by substantial media coverage [37], with celebrities endorsing [38] visits to the local health centers and evaluations of the campaign including home visits by health professionals in certain areas. These annual campaigns impacted the health-seeking behaviors of caregivers of young children across the country and might have influenced the uptake of nutrition services, which would in turn impact the nutritional status of the children. Importantly, the funding for the Pulse Polio Campaign came from numerous international agencies such as the World Bank and UNICEF [39], in addition to the central government, and thus was not a result of state economic growth. Another example is the World Bank and UNICEF–funded Child Survival and Safe Motherhood (CSSM) Program, which was implemented from 1992–93 to 1997–98 and later merged into the Reproductive and Child Health (RCH) program in 1997–98 (http://mohfw.nic.in/dofw%20website/Child%20healthrti.pdf). The RCH differed from CSSM mainly in the approach towards delivery of services, and its implementation was widely publicized through mass media. Therefore, treating data from 1992 as equivalent to data from 1998 (or 2005) does not allow us to disentangle the effects of economic growth from the effect of other factors unique to any of the survey years that could be associated with reductions in child undernutrition. Further, it is incorrect to assume that data from 1992 are the same as data from 1998 (or 2005). Therefore, results from analyses excluding survey-period effects are inappropriate. At the same time, there might be concern that we may be explaining away the effects of economic growth by “over”-controlling, and for this reason we did not account for any changes driven by state-level economic growth, which is the focus of our analysis. One possible interpretation is that our results present a range for the possible effect sizes, from a 7% reduction in risk of child undernutrition over 7 years to no effect, suggesting that the association between economic growth and underweight is far from being a clear inverse association.
We posit the following as possible explanations for the lack of association between economic growth and undernutrition among children in India observed in our study. First, the pathways linking societal economic growth with individual well-being include that it increases the incomes of individuals and also a society's investment in public services, such as provision of clean drinking water and preventive health care, all of which are known to prevent undernutrition [5]. It is indeed possible that economic growth led to increased incomes and greater household wealth, which led to a reduced risk of undernutrition. The strong inverse association between household wealth and the risk of undernutrition during childhood appears to support this view. At the same time, there was no association between economic growth and childhood undernutrition even in models without household wealth or parental education, suggesting that this explanation is not supported by the data. On the other hand, a second explanation is that economic growth in India may have benefited only the privileged sections of society such that it translates into higher incomes among the better-off but not among the disadvantaged. This could lead to the lack of an association between economic growth and undernutrition. A direct test of the association between growth and differential increase in household wealth during 1992–2006 is not possible in our data because our measure of household wealth captures relative position of households on an asset scale and has no absolute interpretation. However, the documented increase in income inequality among Indian states in the 1992–2005 period [40] suggests that this might explain, at least in part, our null findings. Notably, Haryana and Meghalaya exhibited the highest rates of growth yet experienced high levels of undernutrition. Further research is needed to understand the processes unique to those states that might explain this remarkable finding.
Thirdly, there is some evidence that economic development is not a necessary condition to alleviate undernutrition in a population, the argument being that direct investment in preventive programs could also lead to improved nutritional status even in the absence of economic growth [8],[9]. State-level growth is an upstream determinant influencing individuals through multiple pathways such as investment in preventive and social programs targeting the nutritional status of children, or investment in better agricultural practices, which increase productivity, decrease food insecurity, and enable transfers of food-in-kind, or investment in infrastructure such as roads and colleges, which increases nutrition-related knowledge of caregivers and access to a variety of foods. Thus our null findings could be reflecting ineffective transfer along any/all of these pathways and not just through increased household wealth due to economic growth. It might even be argued that the gains, albeit modest, made in reducing undernutrition over the years are primarily a result of programs that intervene to improve health in general, for instance preventive health care [13],[14], and nutritional status in particular, such as the Integrated Child Services Development Scheme (ICDS), a national program focused on prevention and treatment of childhood undernutrition [19]. While the extensive primary health care system in India, ICDS, and other programs have no doubt made important contributions, existing evidence shows that the direct investment in preventive programs has been less than adequate [17], which perhaps explains the poor progress in reduction of child undernutrition in India [16]. Indeed, the relatively small reductions in the risk of child undernutrition over a period of 14 years are suggestive of the evidence that economic growth—directly or indirectly—has not translated to reductions in child undernutrition. Fourth, it is possible that economic growth over a 13-year period might not be sufficient to overcome the impact of intergenerational factors, such as the long-term and short-term nutritional status of mothers, on the risk of undernutrition among children [41]. Maternal height and body mass index have been shown to be important predictors of undernutrition in offspring both in India [18],[42] and in a majority of the developing countries [43]. Finally, it is possible that economic growth might indeed increase incomes of families; however, families might not use the additional income towards improving the nutritional status of their children. While we are unable to rule this out, there is some evidence that social cash interventions among the poor have resulted in, on average, greater use of health services and improved nutritional outcomes among children [44], suggesting that disadvantaged families are likely to invest in their children if economic growth resulted in increased income.
The following caveats need to be considered while interpreting our study. While there are several ways to measure nutritional status among children such as evaluating symptoms, functional performance, or laboratory assays of biomarkers, we chose to employ anthropometric indicators as per the WHO recommendation for epidemiological studies of undernutrition. We did so because they are the international standard for such studies and also because other measures of undernutrition were unavailable in these data [45]. Another limitation of our study is that the assessment of economic well-being at the household level was done via household wealth or asset index. While this measure captures the relative position of households with one another in each survey year, it does not have an absolute interpretation due to the manner of its construction, preventing us from directly testing whether economic growth was associated with differential improvement in household wealth in the 1992–2006 period. At the same time, this measure is widely acknowledged as a valid method of measuring household wealth in a developing country setting [30]. Since we found that the association between economic growth and undernutrition was not significant even prior to accounting for the effect of household wealth (or any other demographic and socioeconomic covariates), we believe that a lack of income measure may not be an explanation for the null association. A third limitation is that our models measure economic growth between survey periods and therefore not annual growth. Although we are using measurements from three points, each about 6.5 years apart, we believe that this is a reasonable representation of the pattern of economic growth of states in India between 1992 and 2005. Further investigation of annual per capita state income data revealed that there were less than six instances when per capita state income decreased among the 25 states over these 16 years. Fourthly, our measure of a state's income, the per capita net state domestic product, is only one measure of economic growth. Such measures have been described as tending to overestimate economic growth [26]. We have no reason to believe that any such issue varies across states. Additionally, the estimates produced by it correlate with estimates from other independent economic surveys [26]. It is also the indicator that is used widely as a measure of economic development of a state, including by the Government of India while allocating central resources to various states [27]. Price of food also varies across states. For instance, in 1999–2000, the Tornqvist Index, an index computed using expenditure on food, beverages, tobacco, and fuel, ranged from 92.4 to 123.2 in rural areas of states and 88.6 to 109.6 in the urban areas, although this has been described as “modest” spatial variation [46]. We were unable to account for this state-wise variation in prices, and consequently purchasing power, which might have influenced our results. Our data also had substantial missing data. However, the greatest number of missing records for wasting and stunting arose because height was not measured in five states in 1992. Among the 13,251 records missing data on stunting in 1992, 7,576 (about 57% of the missing) were due to non-measurement at the state-level as opposed to refusing measurement. Similarly about 56% of missing for wasting in 1992 was due to non-measurement. The figures for 1998 are 59% and 56% for 2005. The decision to not measure height of all children in these five states was based on logistics and not per capita income. Therefore the non-measurement is not related to our exposure of study and can be characterized as lack of data and not missing data due to non-response. There were greater missing data among children of mothers with no schooling, and states with lower per capita income were more likely to have a high proportion of such mothers. While we are unable to rule out the chance that this pattern of missingness has biased our results towards the null, it should be noted that models using data only from 2005–06, when the proportion of uneducated mothers was the same among those missing and not missing data, did not show any association between per capita income and undernutrition. Also, we have used the only available Indian data with objective measures of child undernutrition at the national level, from repeated surveys covering a 14-year period when India experienced rapid economic growth. We therefore feel that the strengths of our study outweigh the weaknesses. Finally, it is also necessary to examine whether these findings are generalizable to, and reproducible in, other countries that experienced rapid economic growth in the last two decades.
In summary, India is not on track for achieving the target for Millennium Development Goal (MDG) 4 of reducing child mortality [47]. Given that undernutrition between 6 and 59 months of age contributes to about 25% to 50% of the mortality in that age group [48], reducing undernutrition is imperative to achieving MDG 4. Indeed, reducing hunger constitutes the first MDG. The null association between state economic growth and undernutrition among children observed suggests that the role of economic growth and, more broadly, growth-mediated strategy in achieving the MDGs needs to be reappraised. The findings suggest that economic growth has no automatic connection to reducing childhood undernutrition. Further, reductions in the prevalence of childhood undernutrition in India are likely to depend on direct investments in health and health-related programs.
Supporting Information
Zdroje
1. Preston
SH
1975
The changing relation between mortality and level of economic
development.
Population Studies
29
231
248
2. Pritchett
L
Summers
LH
1997
Wealthier is healthier.
J Hum Resour
31
841
868
3. Smith
LC
Haddad
L
2002
How potent is economic growth in reducing undernutrition? What
are the pathways of impact? New cross-country evidence.
Econ Dev Cult Change
51
55
76
4. Ravallion
M
1990
Income effects on undernutrition.
Econ Dev Cult Change
38
489
515
5. Anand
S
Ravallion
M
1993
Human development in poor countries: on the role of private
incomes and public services.
J Econ Perspect
7
133
150
6. Dreze
J
Sen
AK
1995
India: economic development and social opportunity.
New Delhi
Oxford University Press
7. Dreze
J
Sen
AK
1998
Indian development: selected regional perspectives.
New Delhi
Oxford University Press
8. Dreze
J
Sen
A
1989
Hunger and public action.
Oxford
Clarenden Press
9. Sen
AK
1999
Health in development.
Bull World Health Organ
77
619
623
10. Subramanian
SV
Belli
P
Kawachi
I
2002
The macroeconomic determinants of health.
Annu Rev Public Health
23
287
302
11. Wolfe
B
Behrman
JR
1983
Is income overrated in determining adequate nutrition?
Econ Dev Cult Change
31
525
549
12. Behrman
JR
Wolfe
BL
1984
More evidence on nutrition demand: income seems overrated and
women's schooling underemphasized.
J Dev Econ
14
105
128
13. World
Bank
1993
World development report: investing in health.
Washington DC
World Bank
14. Bloom
DE
Canning
D
2009
Population health and economic growth.
Spence
M
Lewis
M
Health and growth: commission on growth and development
Washington DC
The World Bank
15. Basu
K
Maertens
A
2007
The pattern and causes of economic growth in India.
Oxford Review of Economic Policy
23
143
167
16. Subramanyam
MA
Kawachi
I
Berkman
LF
Subramanian
SV
2010
Socioeconomic inequalities in childhood undernutrition in India:
analyzing trends between 1992 and 2005.
PLoS One
5
e11392
doi:10.1371/journal.pone.0011392
17. Shiva Kumar
AK
2007
Why are levels of child malnutrition not improving?
Econ Polit Wkly
1337
1345
18. Subramanian
SV
Ackerson
LK
Davey Smith
G
John
NA
2009
Association of maternal height with child mortality,
anthropometric failure, and anemia in India.
JAMA
301
1691
1701
19. IIPS, Macro-International
2007
National Family Health Survey (NFHS-3), 2005-2006: India: Volume
I.
Mumbai
International Institute for Population Sciences
20. IIPS, Macro-International
2007
National Family Health Survey (NFHS-3), 2005-2006: India: Volume
II.
Mumbai
International Institute for Population Sciences
21. Black
RE
Allen
LH
Bhutta
ZA
Caulfield
LE
de Onis
M
2008
Maternal and child undernutrition: global and regional exposures
and health consequences.
Lancet
371
243
260
22. Waterlow
JC
1972
Classification and definition of protein-calorie malnutrition.
Br Med J
3
566
569
23. IIPS
2006
Anthropometry, anaemia and HIV testing field manual: 2005-2006
National Family Health Survey (NFHS-3) India.
Mumbai
International Institute for Population Sciences
24. WHO
2006
WHO child growth standards: length/height-for-age,
weight-for-age, weight-for-length, weight-for-height and body mass
index-for-age: methods and development.
Geneva
World Health Organization
25. Reserve Bank of India
2008
Handbook of statistics on Indian economy.
New Delhi
Government of India
26. Deaton
A
2005
Measuring poverty in a growing world (or measuring growth in a
poor world).
Rev Econ Stat
87
1
19
27. EPW Research Foundation
1995
Special statistics-17: national accounts statistics of India - 6:
net state domestic product.
Econ Polit Wkly, 2007
30
3321
3328
28. Chitnis
S
1997
Definition of the terms scheduled castes and scheduled tribes: a
crisis of ambivalence.
Pai Panandiker
VA
The politics of backwardness: reservation policy in India/edited by VA
Pai Panandiker
New Delhi
Konark
88
107
29. Subramanian
SV
Davey Smith
G
Subramanyam
M
2006
Indigenous health and socioeconomic status in India.
PLoS Med
3
e421
doi:10.1371/journal.pmed.0030421
30. Filmer
D
Pritchett
LH
2001
Estimating wealth effects without expenditure data–or
tears: an application to educational enrollments in states of India.
Demography
38
115
132
31. Subramanian
SV
Glymour
MM
Kawachi
I
2007
Identifying causal ecologic effects on health: a methodologic
assessment.
Galea
S
Macrosocial determinants of population health
New York
Springer Media
301
331
32. Allison
PD
2005
Fixed effects regression methods for longitudinal data using SAS.
Cary, NC
SAS Institute Inc
33. Rasbash
J
Steele
F
Browne
WJ
Goldstein
H
2009
A user's guide to MLwiN, v2.10.
Bristol, UK
Centre for Multilevel Modelling, University of
Bristol
34. SAS
2002
SAS. 9.1 ed.
Cary, NC
SAS Institute Inc
35. Subramanian
SV
Smith
GD
2006
Patterns, distribution, and determinants of under - and
overnutrition: a population-based study of women in India.
Am J Clin Nutr
84
633
640
36. Thacker
N
Shendurnikar
N
2004
Current status of polio eradication and future prospects.
Indian J Pediatr
71
241
245
37. Bonu
S
Rani
M
Baker
TD
2003
The impact of the national polio immunization campaign on levels
and equity in immunization coverage: evidence from rural North India.
Soc Sci Med
57
1807
1819
38. Tandon
R
2002
The making of a polio-free India.
Indian J Pediatr
69
683
685
39. Sokey
J
1996
Polio eradication in India: pulse polio immunization.
Indian Pediatrics
33
254
256
40. Dev
SM, Ravi C (2007)
Poverty and inequality:
All-India and states, 1983-2005. Econ Polit Wkly 10 : 509-521
41. Subramanian
SV
Ackerson
LK
Davey Smith
G
2010
Parental BMI and childhood undernutrition in India: an assessment
of intrauterine influence. Pediatrics 126: e663-e671
42. Ozaltin
E
Hill
K
Subramanian
SV
2010
Association of maternal stature with offspring mortality,
underweight, and stunting in low - to middle-income countries. JAMA 303:
1507-1516
43. Özaltin
E
Hill
K
Subramanian
SV
2009
Association between maternal stature and offspring mortality, and
anthropometric failure in 54 low-to-middle income countries.
Boston
Harvard School of Public Health
44. Schady
N
Paxson
CH
2007
Does money matter?
The effects of cash transfers on child health and development in rural
Ecuador
Washington DC
The World Bank
45. WHO
1986
Use and interpretation of anthropometric indicators of
nutritional status.
Bull World Health Org
64
929
941
46. Deaton
A
2003
Prices and poverty in India, 1987-2000.
Econ Polit Wkly
38
362
368
47. MDG
Monitor
2010
Tracking the millennium development goals.
India, progress by goal. Available: http://www.mdgmonitor.org/country_progress.cfm?c=IND&cd=356
48. Black
RE
Caulfield
L
Bhutta
ZA
Victora
CG
2008
Malnutrition kills directly, not
indirectly—authors' reply.
Lancet
371
1750
Štítky
Interní lékařstvíČlánek vyšel v časopise
PLOS Medicine
2011 Číslo 3
- Ivabradin zlepšuje kvalitu života starších pacientů se srdečním selháním
- Fixní kombinace kandesartan/amlodipin v terapii arteriální hypertenze
- Inovace v hojení ran: krytí Zetuvit Plus Silicone Border pro optimální management exsudátu z ran
- Rána vizitkou (nejen) chirurga
- Patogeneze vzniku keloidní jizvy
Nejčtenější v tomto čísle
- The BCG World Atlas: A Database of Global BCG Vaccination Policies and Practices
- How Can Institutional Review Boards Best Interpret Preclinical Data?
- The Challenge of Discharging Research Ethics Duties in Resource-Constrained Settings
- HIV-1 Drug Resistance Emergence among Breastfeeding Infants Born to HIV-Infected Mothers during a Single-Arm Trial of Triple-Antiretroviral Prophylaxis for Prevention of Mother-To-Child Transmission: A Secondary Analysis
Zvyšte si kvalifikaci online z pohodlí domova
Mazová zátka a její řešení
nový kurzVšechny kurzy