
Post-neonatal Mortality, Morbidity, and Developmental Outcome after Ultrasound-Dated Preterm Birth in Rural Malawi: A Community-Based Cohort Study
Background:
Preterm birth is considered to be associated with an estimated 27% of neonatal deaths, the majority in resource-poor countries where rates of prematurity are high. There is no information on medium term outcomes after accurately determined preterm birth in such settings.
Methods and Findings:
This community-based stratified cohort study conducted between May–December 2006 in Southern Malawi followed up 840 post-neonatal infants born to mothers who had received antenatal antibiotic prophylaxis/placebo in an attempt to reduce rates of preterm birth (APPLe trial ISRCTN84023116). Gestational age at delivery was based on ultrasound measurement of fetal bi-parietal diameter in early-mid pregnancy. 247 infants born before 37 wk gestation and 593 term infants were assessed at 12, 18, or 24 months. We assessed survival (death), morbidity (reported by carer, admissions, out-patient attendance), growth (weight and height), and development (Ten Question Questionnaire [TQQ] and Malawi Developmental Assessment Tool [MDAT]). Preterm infants were at significantly greater risk of death (hazard ratio 1.79, 95% CI 1.09–2.95). Surviving preterm infants were more likely to be underweight (weight-for-age z score; p<0.001) or wasted (weight-for-length z score; p<0.01) with no effect of gestational age at delivery. Preterm infants more often screened positively for disability on the Ten Question Questionnaire (p = 0.002). They also had higher rates of developmental delay on the MDAT at 18 months (p = 0.009), with gestational age at delivery (p = 0.01) increasing this likelihood. Morbidity—visits to a health centre (93%) and admissions to hospital (22%)—was similar for both groups.
Conclusions:
During the first 2 years of life, infants who are born preterm in resource poor countries, continue to be at a disadvantage in terms of mortality, growth, and development. In addition to interventions in the immediate neonatal period, a refocus on early childhood is needed to improve outcomes for infants born preterm in low-income settings.
: Please see later in the article for the Editors' Summary
Published in the journal:
. PLoS Med 8(11): e32767. doi:10.1371/journal.pmed.1001121
Category:
Research Article
doi:
https://doi.org/10.1371/journal.pmed.1001121
Summary
Background:
Preterm birth is considered to be associated with an estimated 27% of neonatal deaths, the majority in resource-poor countries where rates of prematurity are high. There is no information on medium term outcomes after accurately determined preterm birth in such settings.
Methods and Findings:
This community-based stratified cohort study conducted between May–December 2006 in Southern Malawi followed up 840 post-neonatal infants born to mothers who had received antenatal antibiotic prophylaxis/placebo in an attempt to reduce rates of preterm birth (APPLe trial ISRCTN84023116). Gestational age at delivery was based on ultrasound measurement of fetal bi-parietal diameter in early-mid pregnancy. 247 infants born before 37 wk gestation and 593 term infants were assessed at 12, 18, or 24 months. We assessed survival (death), morbidity (reported by carer, admissions, out-patient attendance), growth (weight and height), and development (Ten Question Questionnaire [TQQ] and Malawi Developmental Assessment Tool [MDAT]). Preterm infants were at significantly greater risk of death (hazard ratio 1.79, 95% CI 1.09–2.95). Surviving preterm infants were more likely to be underweight (weight-for-age z score; p<0.001) or wasted (weight-for-length z score; p<0.01) with no effect of gestational age at delivery. Preterm infants more often screened positively for disability on the Ten Question Questionnaire (p = 0.002). They also had higher rates of developmental delay on the MDAT at 18 months (p = 0.009), with gestational age at delivery (p = 0.01) increasing this likelihood. Morbidity—visits to a health centre (93%) and admissions to hospital (22%)—was similar for both groups.
Conclusions:
During the first 2 years of life, infants who are born preterm in resource poor countries, continue to be at a disadvantage in terms of mortality, growth, and development. In addition to interventions in the immediate neonatal period, a refocus on early childhood is needed to improve outcomes for infants born preterm in low-income settings.
: Please see later in the article for the Editors' Summary
Introduction
An estimated 3.6 million neonatal deaths occur each year, accounting for 41% of deaths in children under 5 y old [1]. Over three-quarters of these deaths occur in South Asia and sub-Saharan Africa, with causes of death often poorly documented. Prematurity (birth at less than 37 completed wk gestation) is considered to be associated with an estimated 27% of all neonatal deaths [2], but estimates are difficult because of uncertainties about gestational age in many low-income countries. The very few studies using accurate, prenatal ultrasound dating in Sub-Saharan Africa, including our own, have reported a high incidence (15%–22%) of preterm births [3]–[5].
There is good evidence that antenatal corticosteroids and improved care in the immediate neonatal period, such as Kangaroo Mother Care, and encouragement of early breastfeeding improve neonatal survival in the first month of life [6],[7]. There are recent estimates of post-neonatal mortality worldwide [8]; however, the information specifically about mortality and morbidity of the surviving preterm infant in these settings is largely unavailable.
Most previous studies come from high-resource countries and have focused on babies born very preterm, before 32 weeks' gestation. Almost three-quarters of preterm births occur however between 32 and 36 wk [9],[10], and these late preterm infants are still at greater risk of infant mortality and morbidity compared to infants born at term [11]. A comprehensive search of the literature has identified few studies reporting medium or longer term outcomes for babies born preterm in low-income settings. All these studies have used proxy measures for gestational age (low birth weight, Dubowitz scoring, or other) [12]–[15] with many of the studies only reporting hospital-based births. None used prenatal ultrasound—the most accurate method of assessing gestational age.
The aim of our study was to assess four specific outcomes—post-neonatal survival, morbidity, growth, and development—in a community-based sample of infants born after spontaneous preterm delivery in rural sub-Saharan Africa. All had gestational age accurately determined using prenatal ultrasound scanning.
Methods
Ethics Statement
We obtained written permission from each district health officer for the four areas in which the study was conducted. The research midwives explained the purpose of the study to each child's parent or carer and obtained written informed consent to participate in the study. The study gained ethical approval from the College of Medicine Research Ethics Committee in Malawi.
Malawi in Context
Malawi is considered to be one of the poorest countries in the world with a per capita income of US$290 per year [16]. 80% of the population live in rural areas and livelihoods are earned mainly through subsistence farming. The estimated neonatal mortality rate is 33/1,000 live births with just over 80% of births delivered in a health facility [17]. More than 95% of women attend for antenatal care in the community, mostly in community-based health centres [18]. Antenatal steroids are not routinely given to women in Malawi prior to preterm birth. Malawi has very limited neonatal care with few units providing special care for preterm infants. Those units that exist have oxygen, antibiotics, and incubators and very little in the way of diagnostic facilities. In recent surveys, 72% of children under 6 mo were exclusively breastfed and by 6–9 mo, 87% of infants are given complementary foods [17].
Study Setting and Population
We carried out a cohort study assessing mortality, morbidity, development, and growth in post-neonatal infants who were known to have been born preterm (<37 completed wk gestation by ultrasound scan) (group 1) or at term (37–41 wk) (group 2). All infants for this follow-up study were born during a placebo-controlled double blind antibiotic intervention study (APPLe trial ISRCTN84023116) in southern Malawi. Birth weights were recorded for those who delivered in a health facility (65.5%). In the parent cohort population, low birth weight (<2.5 kg) was recorded in 10.0% of babies. Serial ultrasound was not available for this population, therefore making it impossible to diagnose infants as being small for gestational age (due to intrauterine growth restriction or other) during pregnancy. Nutritional status in women was measured using BMI (kg/m2) with a mean (standard deviation [SD]) BMI of 22.7 (2.7). More details of the APPLe cohort can be found elsewhere [4].
Two strata were defined: babies born preterm and babies born at term. We attempted to follow up babies who were known to have survived the first 6 wk of life. The entire set of post-neonatal surviving preterm babies born preterm from the APPLe trial cohort of women was included. There were 295 preterm babies identified for follow-up including 27 twin babies (14 pairs, one died). 48 (16.3%) infants known to have been born preterm and to have survived the neonatal period were lost to follow-up (moved from area, could be not traced). For the comparison cohort, we selected at least double the number of term-born post-neonatal babies. This selection was done using a computer-generated random list from the APPLe parent cohort. Following this method, 678 babies born at term were identified. 593 (87.5%) were found at follow-up and included in the study. 85 infants known to be born at term (12.6%) were lost to follow-up (moved from the area, could be not traced) (Figure 1).

We aimed to assess all infants on at least one occasion at a corrected age of 12 or 18 or 24 mo. We assessed them at this precise age ±1 wk. Corrected age was defined as chronological age (time elapsed after birth) minus number of weeks born less than 40 wk [19]. All assessments were carried out over a period of 7 mo from May 2006 until December 2006 using a team of six research midwives. 16 infants (ten preterm and six term) were assessed on two occasions 6 mo apart. These assessments are included in the analyses of development. We present the analyses below, with and without twins included.
Data Collection
Socio-demographic characteristics were gathered for each family by interviewing the mother at the time of assessment, using a standard set of questions similar to those used in the Malawi Demographic Health Survey [20] as recommended by the World Bank [21].
To assess survival, we collected information on date of death, cause of death, and place of death by interviewing the mother. Cause of death was established using information gathered at verbal autopsy and classified as recommended in recent studies [22].
To assess morbidity, we collected data using a structured questionnaire. This questionnaire included whether the child was well at the time seen (as reported by the mother and observed by the research nurse midwife), the number of episodes and reasons for accessing care at a health facility, the number and reasons for being admitted to hospital in the past, and, specifically, whether the child had ever had convulsions.
Growth was assessed for each child by measuring length and nude weight. Weight was measured using electronic infant weighing scales (SECA 735) with reading increments of 10 g. Length was measured to the nearest 0.5 cm using standard locally made length measurement boards based on blueprints for their construction from the World Health Organization and the US Centers for Disease Control (Atlanta, Georgia) [23]. All growth data were collected by the research nurse midwives who had been specifically trained prior to the start of the study. Training used the “my measure” formulas for anthropometeric standardisation as recommended by the Anthropometric Indicators Measurement Guide [24]. At recommended stages of training, ten children had their height and weight measurements repeated on two occasions by each research midwife. Training continued with the research midwives until satisfactory accuracy was obtained. We asked each mother whether the child was still breastfeeding at the time of assessment.
Development and disability were assessed using the Ten Question Questionnaire (TQQ) [25] and the Malawi Developmental Assessment Tool (MDAT), which we have described previously [26]. The MDAT has demonstrated good reliability, construct validity, and sensitivity in predicting moderate to severe neurodisability and developmental delay in a Malawian population of malnourished children. We used the MDAT to assess children in two ways: through a pass/fail scoring system and through a numerical scoring system applied to each of four domains of development [26]. Only eight of the ten questions in the TQQ were used as the children were all under 2 y and questions 8 and 9 regarding speech and language were not appropriate for this age group. We were unable to specifically assess for cerebral palsy, as this is a clinical diagnosis that without further assessments and imaging was not able to be diagnosed in this rural African setting.
Statistical Analysis
All data were double entered and verified, hosted on a password-protected SQL server with any discrepancies and outlying results reviewed. Mothers and babies were identified only by the mother's identification number and in the case of twins, the twin number. Data were analysed using SPSS for Windows version 17 and Stata version 10. All available data were included in the analyses.
Analyses compared data for infants and their mothers in the preterm and term delivery groups. All infants were used in the analysis, except where stated otherwise. Survival of infants in each of these strata was estimated using Kaplan-Meier curves and compared using a Cox's proportional hazards model. Gender was also included in the Cox's proportional hazards analysis. When date of death was not reported (six cases) it was assumed to have been mid-way between birth and the assessment visit. For all other analyses, when data required for an analysis was missing the record was omitted from analysis. Socio-economic status was measured using principal components analysis of multiple assets following methods from the World Bank [21],[27]. Socio-economic quintiles for the two groups of mothers were analysed using logistic regression with term/preterm as the binary outcome.
Weight-for-corrected-age (WAZ), height-for-corrected-age (HAZ), and weight-for-height z (WHZ) scores were derived using Epi-info version 3.2.2 with World Health Organization reference data [28],[29]. All analyses, except survival analyses, used corrected age (defined above). Growth data and MDAT scores were each analysed using linear regression models with gestational age at delivery as a covariate in the model for both sets of scores; age at assessment was an additional covariate in the analysis of MDAT scores. Stratified Mantel-Haenszel tests were used to examine the association of each of three indices of growth (WAZ and length-for-age [LAZ] and weight-for-length [WLZ] z scores), and the number of times health care was accessed with prematurity, stratified by age of assessment. Other binary or categorical outcomes were analysed using Pearson chi square tests unless otherwise stated.
Stratified Mantel-Haenszel tests were also used to examine the association between being underweight (WAZ<−2) and identification of disability on the TQQ or severe developmental delay on the MDAT. Stratification was by whether preterm or not and by age of assessment to control for the influence of these factors.
Results
Population Followed Up
A total of 840 post-neonatal infants were followed up, of whom 247 were born preterm and 593 were born at term (Figure 1). Among these, 12 pairs of twins were born preterm (24 babies) and one set of twins (two babies) were born at term. Among preterm births, gestational age at birth (given in completed weeks of gestation) was above 34 wk for 203/247 infants (82.2%), either 32 or 33 wk for 34/247 infants (13.8%), and between 28 to 31 wk for 9/247 (3.6%) with only one infant born below 28 wk. Figure 2 shows the distribution of gestational age at birth of the cohort followed up. At time of assessment, the mean corrected ages for the two groups were equal. Female babies were more prevalent in the preterm group (58%) than in the term group (50%).

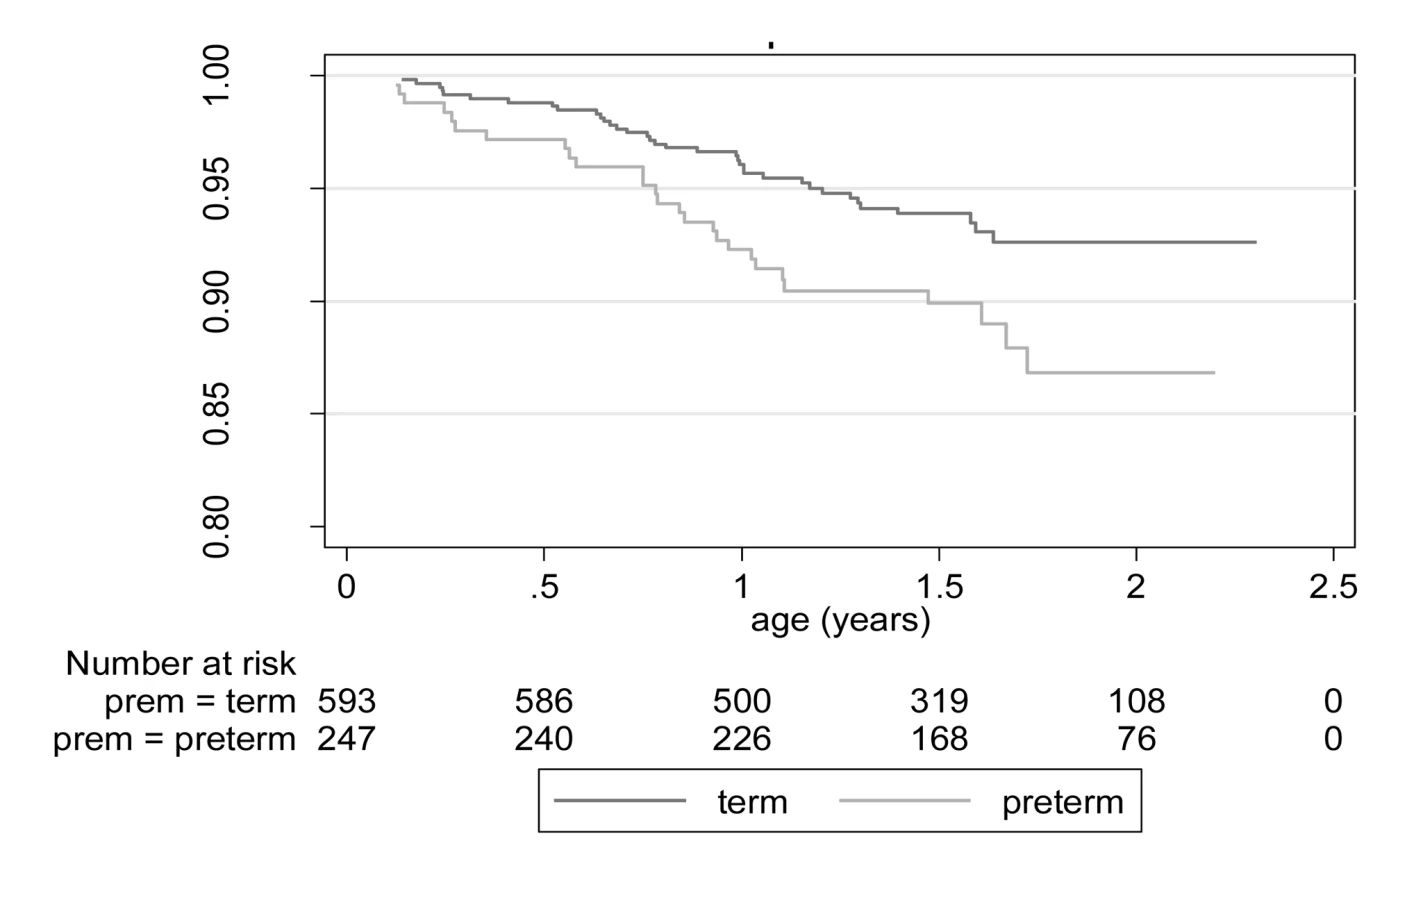
Survival
Post-neonatal infants born preterm were at significantly greater risk of death (during the 6-wk to 24-mo follow-up period) than those born at term: 27/247 (10.9%) preterm and 37/593 (6.2%) term-born infants died; Cox PH χ2 = 5.05, p = 0.02. The estimated hazard ratio (95% CI) for preterm compared with term-born infants is 1.79 (1.09–2.95) (Figure 3). With twin preterm-born infants excluded, Cox PH χ2 = 2.76, p = 0.10 and hazard ratio is 1.58 (0.93–2.69). The estimated mortality rates for infants born preterm who had survived the neonatal period was almost double that of infants born at term. At 1 y, there was an estimated mortality rate of 7.7% (5.0–11.8) for preterm and 4.0% (2.7–6.0) for term infants, and at 2 y (cumulative) a rate of 13.2% (8.9–19.3%) and 7.6% (5.4–10.6), respectively (Table 1). Mortality rates were also significantly higher for boys compared with girls. Cox PH χ2 = 9.23, p = 0.002; the estimated hazard ratio (95% CI) for male compared with female infants is 2.19 (1.30–3.68).

There were very few babies born with a gestational age under 32 wk (very preterm) who survived the post-neonatal period in our cohort (n = 10). Within this group, only one of these was found dead on follow-up (Figure 2). The numbers are small, but when analysed, we found no significant differences in mortality between babies born less than 32 wk and those born between 32 and 37 wk (Pearsons chi 0.439).
Information on cause of death was available for 23 of 27 (85.2%) infants born preterm and 37 of 37 (100%) infants born at term (Table 2). We identified five main causes of death in post-neonatal infants: gastroenteritis (36.7%), malaria (15%), respiratory problems (15%), anaemia (15%), and fever (6.7%). In the preterm group there were more reported deaths due to respiratory problems (17.4% versus 13.5) and fewer due to gastroenteritis (26.1% versus 43.2%) but the differences were not statistically significant. By gender, more term males than females died of gastroenteritis, malaria, and fever. In the preterm group, more females died of respiratory illness (four versus 0), but more males died of other conditions such as malaria and fever. None of these differences were statistically significant.

Morbidity
Mothers did not commonly report morbidity at the time of assessment (12, 18, or 24 mo) with 98.7% (226/229) of the preterm group and 97.9% (550/562) of the term group reported to be well at the time of interview. Despite this, reported attendance to the health centre was high in both infants born preterm (94.3%) and those born at term (91.3%) with no significant difference between the groups. The (median) numbers of times that health care was accessed were 3, 3, and 4 times at 12, 18, and 24 mo of age, and did not differ significantly between the groups (Mantel-Haenszel M2 = 0.03, p = 0.86). Nonroutine reasons for attendance to the health centre included malaria, respiratory problems, diarrhoea, upper respiratory tract infections, skin rashes, and fever. Only two mothers reported going to the health centre because their child was malnourished. Visits for routine immunisations (97.4% [preterm] versus 98.9% [term]) and weighing 82.5% (preterm) versus 85.6% (term) were found to be similar.
There were no significant differences in the preterm versus term group in the number of infants reported to have been admitted to a hospital (58/230; 25.2% versus 116/559; 20.8%). The median number of admissions was 1.0 in each of the groups. Infants born preterm were more likely to be admitted for cerebral malaria (3.5% versus 1.8%) or anaemia (3.9% versus 2.1%), but this was not statistically significant. Similar proportions were admitted for simple malaria (9.2% versus 9.9%) and pneumonia (5.7% versus 5.0%). Other causes for admission were sepsis (reported only in four cases), meningitis (one case), and malnutrition (five cases). HIV/AIDS was not reported by parents as a cause of admission to hospital. There were no significant differences in the number of children experiencing convulsions, as reported by parents, preterm compared to term-born children: 10.4% (22/211) versus 6.9% (38/548) (p = 0.13).
Growth
When assessing growth/nutritional parameters for the cohorts, preterm infants were significantly more likely to be underweight (p<0.001). Almost one-third (32.3%) of preterm infants were moderately underweight (below −2 SD WAZ) and 11.1% severely underweight (below −3 SD WAZ) (Table 3). Preterm infants were also more likely to be moderately wasted (WLZ below −2 SD), with a quarter (24.9%) of preterm infants moderately wasted although the groups had similar levels of severe wasting (WLZ>3 SD below mean). In assessing for the effect of gestational age on the growth parameters, the estimated increase in WAZ and WLZ scores per additional week of gestational age was 0.08 (0.05–0.11) and 0.07 (0.02–0.11), respectively. Stunting (below −2 SD for LAZ) was common in both term - (38.3%) and preterm - (42.6%) born children; the effect of each additional week of gestational age at delivery (0.05 [−0.005 to 0.10]) was not significant (p = 0.08).

Breastfeeding rates for preterm infants (100%) and term infants (98.6%) at 12 mo were very similar (p = 1.0). There was a trend for lower rates of breastfeeding in the preterm infants at 18 mo (80.7%) versus term infants (89.6%) (p = 0.057) and also at 24 mo for preterm (44.2%) versus term infants (48.3%) (p = 0.59), but neither were significant.
Development
The post-neonatal infants born preterm were significantly more likely than term-born infants to screen positive overall on the TQQ (Table 4) (p = 0.002), with 32/230 (13.9%) of the preterm infants and 38/562 (6.8%) of the term infants scoring positive on one or more questions. Serious delay in walking, standing, or sitting (question 1) (p = 0.049) or being slow in comparison to children of the same age (neurodevelopmentally delayed; question 10) (p = 0.005) were the items that were significantly more frequent in infants.

In terms of overall pass/fail on the MDAT, more children in the preterm group compared to the term group failed the MDAT at each stage of assessment; at 12 mo this was 6.7% versus 2.9% (p = 0.216), at 18 mo 22.8% versus 10.9% (p = 0.009), and at 24 mo 12.8% versus 10.7% (p = 0.274). Significant differences were also found specifically at 18 mo for language development (p = 0.033) (Table 5). When development was assessed on the MDAT using numerical scores, there were significant changes with gestational age (wk) at delivery in gross motor (0.15/wk; p = 0.02), social development (0.24/wk; p = 0.004), and overall development at 18 mo (0.79/wk; p = 0.01), and in social development (0.21/wk; p = 0.02) at 24 mo (Table 6).


The number of children demonstrating severe delay on the MDAT (delay greater than 2 SD from the mean expected score for the age of the child) was the same across the two groups (9/230 preterm infants [3.9%] versus 23/562 term infants [4.1%]).
Growth and Development
We analysed the association between growth and development in this cohort. We used WAZ as these were the most robust of our three measures. There was a significant association between being underweight and positive on the disability screen (overall odds ratio [OR], 95% CI 2.88 [1.81–4.61]), or having severe delay on the MDAT (<−2 SD) (overall OR, 95% CI 4.06 [1.98–8.32]). The association was similar for both term and preterm infants (Table 7).

Discussion
This study has clearly shown that infants who are born prematurely in a rural community setting in sub-Saharan Africa, who survive the first month of life, are still up to twice as likely to die as term infants during the first 2 y of life with a cumulative mortality rate of 132/1,000 in comparison with those born at term (76/1,000). This cohort of preterm infants is unique because gestational age was established by ultrasound dating. We have shown that these infants are almost entirely a population of late preterm infants, but despite this, are still more likely to have higher rates of malnutrition and developmental delay than term infants. As rates of prematurity are high in sub-Saharan African settings [3]–[5],[30], this study provides evidence to show how crucial it is to concentrate on improving outcomes within this group.
Recent studies from high-income countries have also demonstrated this relatively increased mortality in late preterm babies; however, outcomes have mainly been measured only in the neonatal period [11]. Studies have suggested that causative factors may include thermal instability, hypoglycaemia, respiratory distress, apnoea, jaundice, and feeding difficulties [31]. There is a dearth of evidence from developing countries, but it could be surmised that infants born in the late preterm period in rural African settings are likely to be at increased risk for many of these problems with high levels of poverty, poor post-natal care, and high infection rates. Moreover, the population of infants in our study were not exposed to antenatal steroids and will be more likely to suffer from respiratory distress syndrome and related respiratory disorders [32]. These late preterm infants may also be malnourished due to feeding difficulties that cannot be augmented through supplementary feeding methods present in high-income settings. Poor nutrition will affect immune status and further lead to an increased risk of infection. There is some limited evidence that extra care of preterm-born infants in Asia, such as home care, skin-to-skin contact, and additional support for breastfeeding, may have some potential to prevent death in this group [7],[33],[34]. At the time of this study, Kangaroo Mother Care was limited in the community and district health care settings in Malawi, but services are now being scaled up and hopefully may improve rates of post-neonatal mortality in these late preterm-born infants [35].
Male infants within our cohort of infants born at term were more likely to die than female infants in the post-neonatal period. There is limited evidence that gender does have an effect on perinatal, neonatal [36], and under five death rates [37], but the reasons for this are not clear.
There is little information on cause of death in infants in resource-poor settings, particularly in early infancy. Verbal autopsy tools in this population were found to be useful and we documented more deaths in preterm infants associated with respiratory problems compared to infants born at term. In the absence of an agreed definition and framework for measuring morbidity in community settings in children, we used reported health-seeking behaviour as a proxy measure. Almost all mothers reported their children as well at the time of the study taking place. Almost all mothers had visited a health centre for routine weighing and immunisation and almost one in four children had been admitted as an inpatient in the first 2 y of life. There was no difference in health-seeking behaviour between babies born preterm and those born at term. The reports from the mothers of their children being “well” at the time of the study was surprising considering the morbidity we then encountered in terms of malnutrition, developmental delay, and the high rates of admission to the health centre. Our tools for assessing morbidity were clearly not specific enough and highlight that parent-reported morbidity is not a good measure of childhood morbidity. Currently, an agreed framework or standard for measuring morbidity in children is not available and further studies using other approaches are very much warranted [38].
In our cohort, children born preterm were significantly more likely to be underweight and wasted and did not demonstrate catch-up growth in contrast to those born at term. Comparison with studies from high-income settings is difficult as most have studied very preterm or low birth weight infants [39],[40]. We have identified one other community cohort study from a middle-income country (Brazil) reporting a 3% rate for being underweight with a comparison to terms of 0.8% [41]. Rates in our study were much higher (32.3% for term infants and 22.9% for preterms), suggesting a much higher overall level of malnutrition in this rural sub-Saharan African population. Despite this level, only 0.5% of children in our study were admitted for malnutrition despite routine weighting of babies. This finding suggests that there must be some difficulties for health care providers in either recognising or referring these children with malnutrition. In our population, weight was the indicator that most clearly showed demonstrable differences between the two groups. Weight is often a more sensitive measure of differences between groups and it is recognised that length is consistently more difficult to measure accurately than weight [23]; this may reflect why significant differences between the groups were seen for WAZ and WLZ but not LAZ. The higher-than-expected levels of low WLZs in our population may also be a reflection of this. It may be that we were observing more acute changes in malnutrition in our sample. We did not have accurate birth weights on enough of the infants to be able to measure change in weight over time between the two groups. Therefore it is not clear from our study whether the significant differences in WAZs between the two groups may be more innately related to preterm infants also being born small for gestational age and never catching up. There were no significant differences in breastfeeding rates at each of the ages assessed to account for the differences in weight between the two groups. We did not have information about supplementary feeding and age of introduction. Considering our findings however, longitudinal studies in this population using both ultrasound to measure gestational age, birth weights, and serial growth measurements with clearer assessments of breastfeeding and complementary feeds could clarify some of these issues.
Infants born preterm were twice as likely to be identified as having a disability using the TQQ as well as to fail the MDAT. Studies from high-income countries have demonstrated educational difficulties in children born late preterm. As far as we are aware, there are no similar studies on developmental outcomes in cohorts of accurately gestationally dated late preterm-born infants from a low-income setting. A study in Bangladesh measured development using a variety of more complex assessment tools adapted from those in high-income countries (Bayley II and Stanford Binet) [12]. This study demonstrated significant differences in development, at a slightly higher level than ours, but the babies were much more preterm (<33 wk gestation) and dated using proxy measures. We have shown that a two-stage approach [42] using the TQQ followed by a more detailed developmental assessment using culturally appropriate assessment tools (such as the MDAT) is feasible even in the most rural settings. Caution is needed, however, when attributing importance to these early assessments of mild impairment as found by using a developmental assessment tool such as the MDAT. Follow-up of this cohort beyond the preschool period would be extremely beneficial to assess the actual amount of impairment, particularly as we found no differences in severe delay between the preterm and the term groups.
It is widely recognised that both nutrition and prematurity have an impact on development. We confirmed that these associations are present in this population from sub-Saharan Africa, but the cross-sectional nature of this study did not allow us to evaluate this relationship in more detail—this would clearly be an interesting area for further research. We suggest that in the absence of more sophisticated screening mechanisms, weight and development could be used as “morbidity markers” and serve as an entry point for identifying other health needs especially for babies born preterm.
Conclusions
To date, interventions in low-income settings to reduce neonatal morbidity and mortality have targeted the perinatal period. Our data show that, for surviving preterm babies who survive the immediate neonatal period, even in this mainly late preterm-born surviving group, there is ongoing disadvantage with increased risk of death, growth retardation, and developmental delay. Further detailed qualitative and longitudinal studies to assess the causal mechanisms for these problems would be extremely beneficial. Along with these studies, post-neonatal interventions need to be trialled that might improve outcomes in this group of preterm-born children.
Zdroje
1. LawnJEKerberKEnweronu-LaryeaCCousensS 2010 3.6 million neonatal deaths–what is progressing and what is not? Semin Perinatol 34 371 386
2. LawnJECousensSBhuttaZADarmstadtGLMartinesJ 2004 Why are 4 million newborn babies dying each year? Lancet 364 399 401
3. van den BroekNNtonyaCKayiraEWhiteSNeilsonJP 2005 Preterm birth in rural Malawi: high incidence in ultrasound dated population. Hum Reprod 20 3235 3237
4. van den BroekNRWhiteSAGoodallMNtonyaCKayiraE 2009 The APPLe study: a randomized, community-based, placebo-controlled trial of azithromycin for the prevention of preterm birth, with meta-analysis. PLoS Med 6 e1000191 doi:10.1371/journal.pmed.1000191
5. OsmanNBChallisKCotiroMNordahlGBergstromS 2001 Perinatal outcome in an obstetric cohort of Mozambican women. J Trop Pediatr 47 30 38
6. LawnJEMwansa-KambafwileJBarrosFCHortaBLCousensS 2010 ‘Kangaroo mother care’ to prevent neonatal deaths due to pre-term birth complications. Int J Epidemiol E-pub ahead of print. doi:10.1093/ije/dyq172
7. DarmstadtGLBhuttaZACousensSAdamTWalkerN 2005 Evidence-based, cost-effective interventions: how many newborn babies can we save? Lancet 365 977 988
8. RajaratnamJKMarcusJRFlaxmanADWangHLevin-RectorA 2010 Neonatal, postneonatal, childhood, and under-5 mortality for 187 countries, 1970–2010: a systematic analysis of progress towards Millennium Development Goal 4. Lancet 375 1988 2008
9. KramerMS 2009 Late preterm birth: appreciable risks, rising incidence. J Pediatr 154 159 160
10. DavidoffMJDiasTDamusKRussellRBettegowdaVR 2006 Changes in the gestational age distribution among U.S. singleton births: impact on rates of late preterm birth, 1992 to 2002. Semin Perinatol 30 8 15
11. OsrinD 2010 The implications of late-preterm birth for global child survival. Int J Epidemiol 39 645 649
12. KhanNMuslimaHParveenMBhattacharyaMBegumN 2006 Neurodevelopmental outcomes of preterm infants in Bangladesh. Pediatrics 118 280 289
13. CooperPASandlerDL 1997 Outcome of very low birth weight infants at 12 to 18 months of age in Soweto, South Africa. Pediatrics 99 537 544
14. WereFNBwiboNO 2006 Two year neurological outcomes of Very Low Birth Weight infants. East Afr Med J 83 243 249
15. ChaudhariSOtivMChitaleAPanditAHogeM 2004 Pune low birth weight study–cognitive abilities and educational performance at twelve years. Indian Pediatr 41 121 128
16. World Bank 2011 Development data - Malawi Washington (D.C.) World Bank
17. National Statistics Office ZM 2011 Malawi Demographic and Health Survey 2010. Preliminary Report Calverton (Maryland) ICF Macro
18. van den BroekNRWhiteSANtonyaCNgwaleMCullinanTR 2003 Reproductive health in rural Malawi: a population-based survey. BJOG 110 902 908
19. EngleWA 2004 Age terminology during the perinatal period. Pediatrics 114 1362 1364
20. National Statistics Office ZM 2005 Malawi Demographic and Health Survey 2004 Calverton (Maryland) Measure DHS (Demographic and Health Survey) ORC Macro 0 40
21. VyasSKumaranayakeL 2006 Constructing socio-economic status indices: how to use principal components analysis. Health Policy Plan 21 459 468
22. SetelPWWhitingDRHemedYChandramohanDWolfsonLJ 2006 Validity of verbal autopsy procedures for determining cause of death in Tanzania. Trop Med Int Health 11 681 696
23. De OnisMOnynangoAWVan den BroeckJCameronWCMartorellR 2004 Measurement and standardization protocols for anthropometry used in the construction of a new international growth reference. Food Nutrition Bulletin 25 S27 S36
24. CoghillB 2003 Anthropometric indicators measurement guide Washington (D.C.) Academy for Educational Development
25. DurkinMSDavidsonLLDesaiPHasanZMKhanN 1994 Validity of the ten-question screen for childhood disability: results from population based studies in Bangladesh, Jamaica and Pakistan. Epidemiology 5 283 289
26. GladstoneMLancasterGAUmarENyirendaMKayiraE 2010 The Malawi Developmental Assessment Tool (MDAT): the creation, validation, and reliability of a tool to assess child development in rural African settings. PLoS Med 7 e1000273 doi:10.1371/journal.pmed.1000273
27. FilmerDPritchettL 2008 Estimating wealth effects without expenditure data - or tears: an application to educational enrolments in states of India. Demography 38 115 132
28. KuczmarskiRJOgdenCLGuoSSWeiRMieZ 2002 2000 CDC growth charts for the United States: Methods and development. Vital Health Statistics 11 246
29. US Centers for Disease Control 2008 Epi info version 6 Atlanta (Georgia) US Centers for Disease Control
30. KumalaTVaahteraMNdekaMKoivistoAMCullinanT 2000 The importance of preterm births for peri and neonatal mortality in rural Malawi. Paediatr Perinat Epidemiol 14 219 226
31. SaigalSDoyleL 2008 Preterm birth 3. An overview of mortalitiy and sequelae of preterm birth from infancy to adulthood. Lancet 371 261 269
32. RobertsDDalzielS 2006 Antenatal corticosteroids for accelerating fetal lung maturation for women at risk of preterm birth. Cochrane Database Syst Rev 3 CD004454
33. AgrawalPKAgrawalSAhmedSDarmstadtGLWilliamsEK 2011 Effect of knowledge of community health workers on essential newborn health care: a study from rural India. Health Policy Plan E-pub ahead of print. doi:10.1093/heapol/czr018
34. YasminSOsrinDPaulECostelloA 2001 Neonatal mortality of low-birth-weight infants in Bangladesh. Bull World Health Organ 79 608 614
35. VictoraCGRubensCE 2010 Global report on preterm birth and stillbirth (4 of 7): delivery of interventions. BMC Pregnancy Childbirth 10 Suppl 1 S4
36. UlizziLZontaLA 2002 Sex differential patterns in perinatal deaths in Italy. Hum Biol 74 879 888
37. KanungoSTsuzukiADeenJLLopezALRajendranK 2010 Use of verbal autopsy to determine mortality patterns in an urban slum in Kolkata, India. Bull World Health Organ 88 667 674
38. RudanILawnJCousensSRoweAKBoschi-PintoC 2005 Gaps in policy-relevant information on burden of disease in children: a systematic review. Lancet 365 2031 2040
39. HackMSchluchterMCartarLRahmanMCuttlerL 2003 Growth of very low birth weight infants to age 20 years. Pediatrics 112 e30 e38
40. SaigalSStoskopfBLStreinerDLBurrowsE 2001 Physical growth and current health status of infants who were of extremely low birth weight and controls at adolescence. Pediatrics 108 407 415
41. SantosISMatijasevichADominguesMRBarrosAJVictoraCG 2009 Late preterm birth is a risk factor for growth faltering in early childhood: a cohort study. BMC Pediatr 9 71
42. KauchaliSDavidsonLL 2006 Commentary: the epidemiology of neurodevelopmental disorders in Sub-Saharan Africa–moving forward to understand the health and psychosocial needs of children, families, and communities. Int J Epidemiol 35 689 690
Štítky
Interní lékařstvíČlánek vyšel v časopise
PLOS Medicine
2011 Číslo 11
- Ivabradin zlepšuje kvalitu života starších pacientů se srdečním selháním
- Fixní kombinace kandesartan/amlodipin v terapii arteriální hypertenze
- Inovace v hojení ran: krytí Zetuvit Plus Silicone Border pro optimální management exsudátu z ran
- Rána vizitkou (nejen) chirurga
- Patogeneze vzniku keloidní jizvy
Nejčtenější v tomto čísle
- A Head-to-Head Comparison of Four Artemisinin-Based Combinations for Treating Uncomplicated Malaria in African Children: A Randomized Trial
- Evidence-Based Guidelines for Mental, Neurological, and Substance Use Disorders in Low- and Middle-Income Countries: Summary of WHO Recommendations
- Voluntary Medical Male Circumcision: Strategies for Meeting the Human Resource Needs of Scale-Up in Southern and Eastern Africa
- Rapid Diagnosis of Tuberculosis with the Xpert MTB/RIF Assay in High Burden Countries: A Cost-Effectiveness Analysis
Zvyšte si kvalifikaci online z pohodlí domova
Mazová zátka a její řešení
nový kurzVšechny kurzy