
Information from Pharmaceutical Companies and the Quality, Quantity, and Cost of Physicians' Prescribing: A Systematic Review
Background:
Pharmaceutical companies spent $57.5 billion on pharmaceutical promotion in the United States in 2004. The industry claims that promotion provides scientific and educational information to physicians. While some evidence indicates that promotion may adversely influence prescribing, physicians hold a wide range of views about pharmaceutical promotion. The objective of this review is to examine the relationship between exposure to information from pharmaceutical companies and the quality, quantity, and cost of physicians' prescribing.
Methods and Findings:
We searched for studies of physicians with prescribing rights who were exposed to information from pharmaceutical companies (promotional or otherwise). Exposures included pharmaceutical sales representative visits, journal advertisements, attendance at pharmaceutical sponsored meetings, mailed information, prescribing software, and participation in sponsored clinical trials. The outcomes measured were quality, quantity, and cost of physicians' prescribing. We searched Medline (1966 to February 2008), International Pharmaceutical Abstracts (1970 to February 2008), Embase (1997 to February 2008), Current Contents (2001 to 2008), and Central (The Cochrane Library Issue 3, 2007) using the search terms developed with an expert librarian. Additionally, we reviewed reference lists and contacted experts and pharmaceutical companies for information. Randomized and observational studies evaluating information from pharmaceutical companies and measures of physicians' prescribing were independently appraised for methodological quality by two authors. Studies were excluded where insufficient study information precluded appraisal. The full text of 255 articles was retrieved from electronic databases (7,185 studies) and other sources (138 studies). Articles were then excluded because they did not fulfil inclusion criteria (179) or quality appraisal criteria (18), leaving 58 included studies with 87 distinct analyses. Data were extracted independently by two authors and a narrative synthesis performed following the MOOSE guidelines. Of the set of studies examining prescribing quality outcomes, five found associations between exposure to pharmaceutical company information and lower quality prescribing, four did not detect an association, and one found associations with lower and higher quality prescribing. 38 included studies found associations between exposure and higher frequency of prescribing and 13 did not detect an association. Five included studies found evidence for association with higher costs, four found no association, and one found an association with lower costs. The narrative synthesis finding of variable results was supported by a meta-analysis of studies of prescribing frequency that found significant heterogeneity. The observational nature of most included studies is the main limitation of this review.
Conclusions:
With rare exceptions, studies of exposure to information provided directly by pharmaceutical companies have found associations with higher prescribing frequency, higher costs, or lower prescribing quality or have not found significant associations. We did not find evidence of net improvements in prescribing, but the available literature does not exclude the possibility that prescribing may sometimes be improved. Still, we recommend that practitioners follow the precautionary principle and thus avoid exposure to information from pharmaceutical companies.
: Please see later in the article for the Editors' Summary
Published in the journal:
. PLoS Med 7(10): e32767. doi:10.1371/journal.pmed.1000352
Category:
Research Article
doi:
https://doi.org/10.1371/journal.pmed.1000352
Summary
Background:
Pharmaceutical companies spent $57.5 billion on pharmaceutical promotion in the United States in 2004. The industry claims that promotion provides scientific and educational information to physicians. While some evidence indicates that promotion may adversely influence prescribing, physicians hold a wide range of views about pharmaceutical promotion. The objective of this review is to examine the relationship between exposure to information from pharmaceutical companies and the quality, quantity, and cost of physicians' prescribing.
Methods and Findings:
We searched for studies of physicians with prescribing rights who were exposed to information from pharmaceutical companies (promotional or otherwise). Exposures included pharmaceutical sales representative visits, journal advertisements, attendance at pharmaceutical sponsored meetings, mailed information, prescribing software, and participation in sponsored clinical trials. The outcomes measured were quality, quantity, and cost of physicians' prescribing. We searched Medline (1966 to February 2008), International Pharmaceutical Abstracts (1970 to February 2008), Embase (1997 to February 2008), Current Contents (2001 to 2008), and Central (The Cochrane Library Issue 3, 2007) using the search terms developed with an expert librarian. Additionally, we reviewed reference lists and contacted experts and pharmaceutical companies for information. Randomized and observational studies evaluating information from pharmaceutical companies and measures of physicians' prescribing were independently appraised for methodological quality by two authors. Studies were excluded where insufficient study information precluded appraisal. The full text of 255 articles was retrieved from electronic databases (7,185 studies) and other sources (138 studies). Articles were then excluded because they did not fulfil inclusion criteria (179) or quality appraisal criteria (18), leaving 58 included studies with 87 distinct analyses. Data were extracted independently by two authors and a narrative synthesis performed following the MOOSE guidelines. Of the set of studies examining prescribing quality outcomes, five found associations between exposure to pharmaceutical company information and lower quality prescribing, four did not detect an association, and one found associations with lower and higher quality prescribing. 38 included studies found associations between exposure and higher frequency of prescribing and 13 did not detect an association. Five included studies found evidence for association with higher costs, four found no association, and one found an association with lower costs. The narrative synthesis finding of variable results was supported by a meta-analysis of studies of prescribing frequency that found significant heterogeneity. The observational nature of most included studies is the main limitation of this review.
Conclusions:
With rare exceptions, studies of exposure to information provided directly by pharmaceutical companies have found associations with higher prescribing frequency, higher costs, or lower prescribing quality or have not found significant associations. We did not find evidence of net improvements in prescribing, but the available literature does not exclude the possibility that prescribing may sometimes be improved. Still, we recommend that practitioners follow the precautionary principle and thus avoid exposure to information from pharmaceutical companies.
: Please see later in the article for the Editors' Summary
Introduction
Pharmaceutical companies in the United States spent about US$57.5 billion, or 24.4% of their revenue, on promotion in 2004 [1]. One estimate of total promotional expenditure in France for 2004 is €2,908 million (12.2% of revenue). However, another estimate is that pharmaceutical detailing cost €3,300 million and accounted for 75% of the overall cost of promotion in that year making promotion 17.3% of revenue [2]. Expenditure on promotion is aimed at maximizing returns for the corporation and shareholders [3]. The industry claims that promotion also provides scientific and educational information to healthcare professionals: “Appropriate marketing of medicines ensures that patients have access to the products they need and that the products are used correctly for maximum patient benefit. Our relationships with healthcare professionals are critical to achieving these goals because they enable us to – inform healthcare professionals about the benefits and risks of our products to help advance appropriate patient use, provide scientific and educational information, support medical research and education” [4].
There is a wide range of views amongst health professionals about pharmaceutical promotion. Qualitative studies suggest that many perceive pharmaceutical promotion to be a useful and convenient source of information [5]–[7]. Some doctors deny that they are influenced by pharmaceutical company promotion or claim that it influences others but not themselves [8]–[10]. Nonetheless, many of these physicians are willing to give significant amounts of time to engaging in promotional activities [11]. By contrast, several professional organisations have called for more control of promotional activities [12],[13] because of evidence that promotion may be misleading [14]–[17].
The evidence base illuminating these conflicting views is growing. In 2000, Wazana identified eight studies linking pharmaceutical promotion to increased prescribing, “nonrational prescribing,” and increased prescribing costs [18]. A 2005 review concluded that promotion influences the prescribing by physicians in training [19], and a second review in the same year concluded that sales representatives influence prescribing [20].
Those previous reviews are now out of date, narrowly focused, or only partially assessed the relationship between information (promotional or otherwise) from pharmaceutical companies and prescribing costs and quality. The objective of this review is to examine the relationship between exposure to information directly provided by pharmaceutical companies and the quality, quantity, and cost of physicians' prescribing.
Methods
Criteria for Including Studies
Randomized controlled trials, time series analyses, before–after studies, cohort studies, case-control studies, ecological studies, and cross-sectional studies were eligible for inclusion. Studies were included if they had both a measure of exposure to any type of information directly provided by pharmaceutical companies and a measure of physicians' prescribing. We excluded studies that looked at the indirect provision of information, for example, through continuing medical education courses that were funded by unrestricted grants from pharmaceutical companies. Case series, case reports, abstracts, news items, and short reports were excluded.
Exposure to information directly provided by pharmaceutical companies was defined as including pharmaceutical sales representative visits, advertisements in journals or prescribing software, presentations from pharmaceutical companies to groups, meetings sponsored by pharmaceutical companies, mailed information including advertisements, and participation in sponsored clinical trials. We did not include studies of other forms of promotion such as gifts or samples or studies of indirect forms of information provision such as sponsored education.
The outcome measures were the quality, frequency, and costs of prescribing.
Search Methods for Identification of Studies
We searched Medline (1966 to February 2008), International Pharmaceutical Abstracts (1970 to February 2008), Embase (1997 to February 2008), Current Contents (2001 to 2008), and Central (The Cochrane Library Issue 3, 2007). The search strategy below was devised for Medline by an expert librarian at the University of Queensland and adapted for the other databases: (exp Drug Industry OR exp Advertising OR exp Gift Giving OR exp “Conflict of Interest”) AND (exp Prescriptions, Drug/OR (prescribing or prescription$).mp.))
We looked for additional articles in the references of each retrieved article including review articles in an iterative, exhaustive process. Efforts to find additional studies included placement of messages on email drug discussion groups, contacting experts in the field, and asking Australian subsidiaries of international pharmaceutical companies for information. All languages were considered.
Selection of Studies
The title and abstract, if available, of all articles detected by the database searches were reviewed by two authors. Articles that possibly met the inclusion criteria were retrieved and subjected to a formal inclusion process independently by two different authors. Differences of opinion were resolved by consensus and if necessary a third author was involved.
Quality Appraisal
Articles meeting inclusion criteria were appraised for methodological quality independently by two authors. Randomized studies were assessed for adequacy of randomization method, allocation concealment, blinding, follow-up, and use of intention to treat analyses [21]. Controlled cohort and case-control studies were assessed using the Newcastle-Ottawa scales [22]. For other nonrandomized studies, quality appraisal included assessment of sources of bias, for example presence of a control group, selection methods, control of confounding, response rate (>80%), and use of appropriate statistical tests [23]. Studies were only excluded from the review if two authors found there was insufficient information to appraise their quality. Disagreements were resolved by discussion with a third author.
Data Extraction
For included studies, two authors independently extracted data on study site, dates of data collection or publication, types of participants (primary care providers, specialists, and residents), study medication(s), exposure to information from pharmaceutical companies, and prescribing outcomes.
Reporting of Results
For quality of prescribing we accepted the original authors' definitions of what constituted more (or less) appropriate prescribing.
We divided studies into two groups on the basis of whether the information was delivered with or without conventional promotional techniques. This distinction was made because information delivered with versus without conventional promotion may produce different effects on prescribing.
Conventional promotional techniques were defined as advertisements (in journals and software), representatives' visits, attendance at pharmaceutical sponsored meetings, and mailed information from pharmaceutical companies. In addition, we included in this group studies looking at total promotional investment/summated scores of commercial information use/general use of commercial sources. The other group of studies included warning letters, participation in company sponsored trials, and representatives' visits for nonpromotional purposes.
A narrative synthesis of results was undertaken following the MOOSE guidelines and meta-analysis performed where appropriate data were available (Text S1) [24]. The unit of analysis was defined as the combination of exposure to a type of information from a pharmaceutical company (for example pharmaceutical sales representative visits or journal advertisements) and a type of prescribing outcome (quality, frequency, and cost of prescribing). Thus studies were treated as a single unit of analysis if they measured the same type of exposure and the same type of outcome regardless of the number of drugs covered in each study. We classified each analysis as positive or negative rather than no association detected if the p value was less than 5% (p<0.05) regardless of the magnitude of the effect.
We reported standardized effect measures (Pearson correlation coefficients, odds ratios [ORs], or beta coefficients) where study reports provided them or the data needed to calculate them. For econometric studies, we also reported t statistics where they were reported or it was possible to calculate them.
Meta-analysis was not appropriate for the outcomes of quality of prescribing and cost of prescribing because in both cases the studies examined different exposures or outcome measures and/or lacked control groups. We undertook a meta-analysis for one component—studies of frequency of prescribing with identifiable control groups where the information exposure was delivered with conventional promotional techniques. We used ORs for change in prescribing frequency as the outcome measure. Where studies had suitable designs for inclusion in the meta-analysis but ORs and standard errors were not published we contacted corresponding authors. Out of ten studies [25]–[34], we received four replies of which three provided the information we required [29]–[31].
Heterogeneity was assessed using the tau squared test with a sensitivity analysis to investigate likely sources of heterogeneity. Factors identified a priori as possible explanations for heterogeneity were study design, study quality indicators, year of publication, type of exposure to pharmaceutical company information (active versus passive), and physician characteristics (level of experience and also primary care provider versus specialist). We defined active exposure as information presented to physicians at meetings or during pharmaceutical sales representatives' visits. We defined passive exposure as journal advertisements, mailed information, advertisements on clinical software, and participation in sponsored clinical trials. Studies reporting more than one unit of analysis were subjected to sensitivity analysis. Meta-analysis was performed using RevMan (version 5.0.24) with further analysis conducted using Stata version 10.0 (Stata Corporation).
Results
Search Results
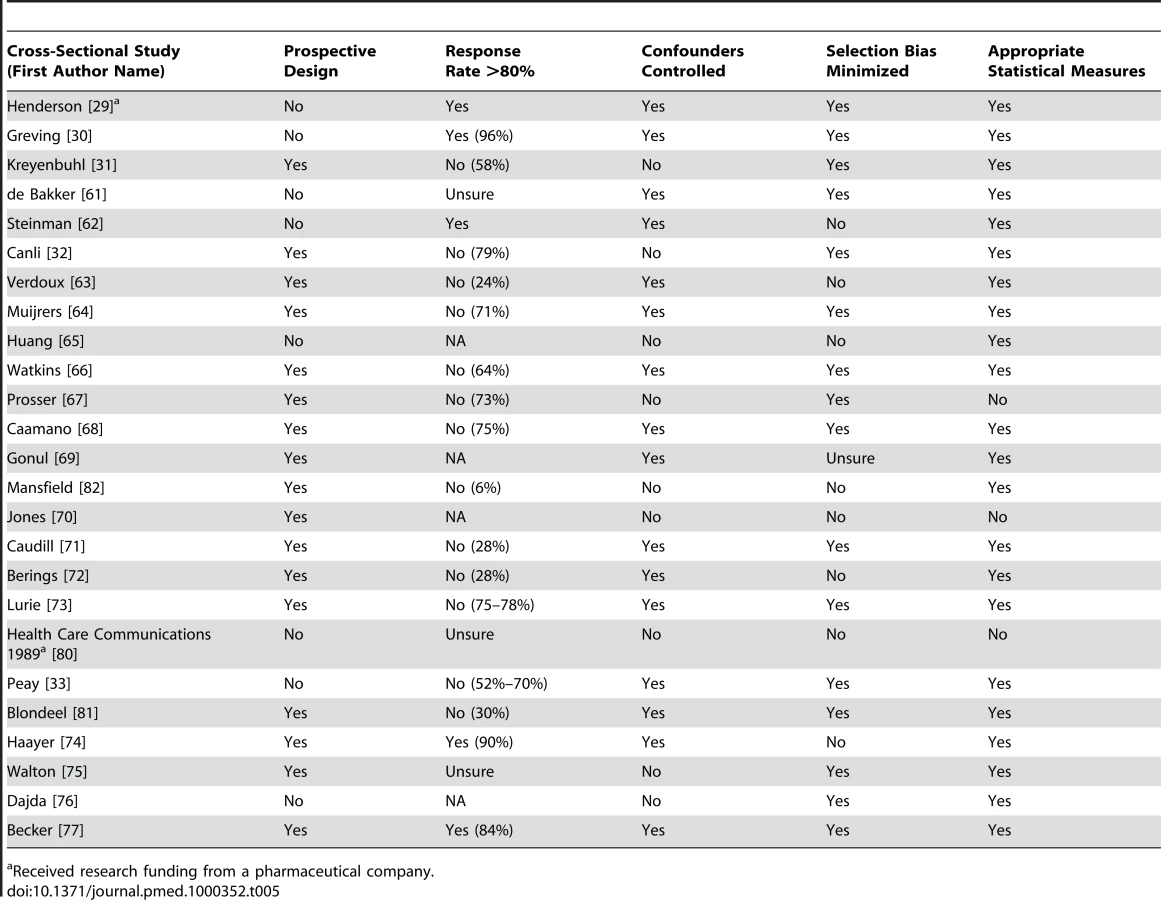
Our search found 7,185 studies from electronic databases and 138 studies were retrieved from reference lists, experts in the field and email lists. The full text of 255 articles was retrieved. 18 studies were excluded, all because inadequate reporting precluded quality assessment. Quality appraisal results for included studies are presented in Tables 1–5. Following application of inclusion/exclusion criteria and quality appraisal, 58 studies were included in the review (52 published in journals [25]–[33],[35]–[77], three reports [78]–[80], one dissertation [34], one conference presentation [81], and one conference poster [82] (Figure 1). Of these 58, 29 studies came from database searches [25]–[31],[33],[35]–[38],[41],[44],[55],[56],[59]–[62],[66]–[68],[70]–[72],[74],[76],[77], 22 studies came from reference lists [32],[39],[40],[46]–[54],[58],[63]–[65],[69],[73],[75],[78],[79], five studies came from experts in the field [34],[43],[57],[81],[82], and two from email lists [45],[80]. These 58 studies included 87 units of analysis. Pharmaceutical companies provided 62 citations; two of these met our inclusion criteria and had already been identified through Medline searches [27],[35]. Five of the studies located through the e-mail lists and experts were not indexed in the databases we searched [34],[43],[80]–[82]. For one study [78], additional data were obtained from the authors [83].


General Characteristics of Studies
The most common study design was cross-sectional (24/58 studies, 41%). There were also two cluster randomized controlled trials, one controlled-cohort study, two case-control studies, 24 time-series analyses, and five before–after studies. Over half (55%) of the studies were conducted in the United States. Characteristics of included studies are outlined in Table 6.

Pharmaceutical Company Information and Prescribing Quality
Prescribing quality was measured by ten studies with 14 units of analysis [37],[39],[58],[59],[61],[64],[74],[77],[81],[82] (Table 7). Quality was assessed in four distinct ways: quality scoring of prescribing decisions, guideline adherence, prescribing appropriateness of an individual drug class, and prescribing range. Three studies used quality scores calculated by coding physicians' drug choices in responses to clinical vignettes [74],[81],[82]. One of these used an expert panel to derive a quality index (1–100) judging primary care providers' prescribing in response to both their actual prescribing and clinical vignettes [81]. In the latter study learning about the drug first from pharmaceutical sales representatives was associated with lower quality of actual prescribing but the number of pharmaceutical sales representatives' visits was not. There was no significant association between primary care providers seeing more pharmaceutical sales representatives or first learning about the drug from pharmaceutical sales representatives and lower quality responses to case vignettes [81]. Another study combined scales examining indication, effectiveness, safety, dosage, duration, and polypharmacy to produce a seven-point scale measuring rationality of prescribing [74]. Primary care providers' self-reported reliance on pharmaceutical companies for information was associated with lower quality scores [74]. A third study used a quality score for a hypertension scenario where thiazides were considered very appropriate and all other drug groups were considered very inappropriate [82]. Self-reported rates of attendance at pharmaceutical company-sponsored meetings were associated with slightly lower quality scores, but self-reported rates of pharmaceutical sales representative visits had no significant association [82].

Residents attending a sponsored meeting were more likely than nonattending residents at the same hospital to prescribe the sponsoring company's medication, both when it was appropriate according to the authors and when it was not [39].
Primary care providers who saw more pharmaceutical sales representatives and those who used the pharmaceutical industry in general as a source of information prescribed a wider range of drugs [61]. The authors suggested that this was a sign of lower prescribing quality in the context of recommendations that primary care providers use a limited list of drugs they know well [61].
Two studies measured guideline adherence. One found less adherence by primary care providers who received more frequent visits from pharmaceutical sales representatives [64], while the other found no change in adherence by primary care providers participating in a clinical trial sponsored by a pharmaceutical company [37].
One study of warnings conveyed by pharmaceutical sales representatives and mailed information [58], one of mailed warnings alone [59], and one of representatives' visits and advertisements [77] found that there was no alteration in overall rates of prescriptions judged to be inappropriate.
Pharmaceutical Company Information and Prescribing Frequency
51 studies [25]–[54],[56]–[60],[62],[63],[65],[67]–[70],[72],[73],[75]–[81] measured prescribing frequency as market share, intention to prescribe, prescription sales, formulary requests, as well as number of prescriptions (63 units of analysis) (Table 8). Below we report separately the results of studies of information delivered with versus without conventional promotion. Within both groups there was one unit of analysis per study.

Conventional Promotional Techniques
Pharmaceutical sales representative visits
Of the 29 studies of pharmaceutical sales representative visits, 17 found only an association with increased prescribing of the promoted drug [26],[32],[33],[38],[40],[43]–[50],[63],[67],[78],[79]. None found less frequent prescribing. Of the remaining 11, six studies had mixed results: finding a significant association with more frequent prescribing for some measures but no significant association for others [27],[42],[62],[69],[73],[81]. Five did not detect any significant relationship [31],[52],[68],[72],[77]. One study did not use statistical tests for associations. It found that during the time that spending by pharmaceutical companies on promotion of a medication dropped to zero, there was also a significant drop in prescribing of that medication. However most of the decreases in promotion and prescribing occurred after the publication of evidence of problems with that medication [56].
Nine of these studies with either positive or mixed results provided insights into features of pharmaceutical sales representative visits that modified the impact of these visits on prescribing [40],[46],[49],[62],[67],[69],[73],[78]. An association with more frequent prescribing was more likely when pharmaceutical sales representatives visited groups of physicians, when physicians had lower baseline prescribing of the promoted drug [62], and when physicians had larger prescribing volumes overall [67]. Longer pharmaceutical sales representative visits to physicians and residents were also more likely to be associated with increased prescribing [69],[73]. More frequent pharmaceutical sales representative visits were associated with diminishing returns [46],[50],[69].
In addition to increasing the promoted drug's market share, pharmaceutical sales representative visits were associated with a decrease in the market share of competitor products [78]. Pharmaceutical sales representative visits were more likely to be associated with more frequent prescriptions for drugs judged more effective and also for drugs with more side effects [40]. However the authors of that study did not attempt to measure whether higher levels of use represented a change in prescribing quality. Another study found that pharmaceutical sales representative visits were associated with a greater increase in market share for new entrants into a therapeutic field than was positive scientific information [49].
Journal advertisements
Four out of the eight studies measuring the effects of journal advertisements presented data but did not include statistical tests [25],[34],[70],[80]. One of these noted use of a medication class increased after pharmaceutical advertising commenced in a country where the medication class was previously available but was not promoted [25]. One study visually compared graphs of the monthly number of advertisements and prescriptions for a group of nine drugs and found no clear relationship between the extent of the advertising of a drug and the amount of prescribing by general practitioners [70]. One study found that the market share of a medication was higher amongst physicians who recognised the advertisement for that medication compared to those who did not [80]. The last study observed decreased prescribing of two drug classes at the same time that advertising decreased [34].
Of the four studies that included statistical tests, one found that journal advertisements have a more pronounced effect on market share for the advertised drug than does positive scientific information published in medical journals [49]. A cross-sectional study found contradictory results. Self-reported infrequent use of journal advertisements by physicians to learn about new medications was not associated with frequency of prescribing. However, infrequent use of journal advertisements was associated with less chloramphenicol prescribing [77]. One cross-sectional study found that physicians who recalled advertisements became prescribers of the advertised products in consistently larger proportions than those who did not recall advertisements [75]. Another study found that 9% of high prescribers of new drugs cited advertisements as an influence on their prescribing compared to 0% for low prescribers; however, this was not a statistically significant association [67].
Attendance at pharmaceutical company-sponsored meetings
There were eight studies of pharmaceutical company-sponsored meetings. Five found positive associations with prescribing frequency [28],[31],[43],[60],[65]. Three studies did not detect a significant association [33],[39],[40].
Mailed information from pharmaceutical companies
One of the three studies of mailed promotional material found an association with increased prescribing [76]. The others found no association [33],[67].
Advertising in clinical software
A single study examined the effect of advertising in clinical practice software and found no association with prescribing frequency for six medications and less prescribing of one medication [29]. The overall result was no association between advertising and prescribing frequency.
Total promotional investment
Eight studies combined the outcome measures for various exposures to pharmaceutical company information or measured overall promotional investment, a proxy for the amount of exposure to information from pharmaceutical companies. Three studies found that total promotional investment was positively associated with prescribing frequency [30],[33],[51]. Two studies found both positive results and no association [53],[54]. One study did not detect an association [52].
Meta-analysis of promotional information and prescribing frequency
We pooled results from a total of seven studies using a random effects model to examine whether exposure to promotion was associated with prescribing of the promoted medication. The seven study results included in the meta-analysis showed significant heterogeneity (I2 = 91% [95% confidence interval (CI) 84%–95%], tau2 = 0.35), and therefore we have presented the forest plot without the pooled outcome (Figure 2) [29],[30],[31],[38],[39],[63],[75]. Using sensitivity analysis we found that study design, quality factors, year of publication, and type of physician did not explain this heterogeneity. One study provided two units of analysis with outcomes amenable to meta-analysis: a significant association for attendance at sponsored meetings and a nonsignificant result for pharmaceutical sales representative (PSR) visits [31]. We included only that nonsignificant result in the forest plot (Figure 2). When meta-analysis was conducted using the significantly positive result for attendance at a pharmaceutical company-sponsored meeting, the summary result and level of heterogeneity did not differ greatly. The largest difference detected was between exposure to active promotional information (OR 2.34, 95% CI 1.50–3.65), (I2 = 59%, 95% CI 0%–86%, tau squared = 0.11) [31],[38],[39],[63] and passive promotional information (OR 1.24, 95% CI 0.72–2.15) (I2 = 89.5%, tau squared = 0.14) [29],[75].

Information Delivered Without Conventional Promotion Techniques
Five studies looked for associations between information delivered without conventional promotion techniques and the frequency of physicians' prescribing [35],[36],[37],[58],[59]. One randomized controlled trial partnered a local health authority and a pharmaceutical company with the aim of promoting a less expensive drug [35], and the other randomized controlled trial aimed to promote rational prescribing through evidence-based detailing by a pharmaceutical company in partnership with an academic institution [36]. Neither found an association with physicians' prescribing. A single controlled-cohort study of a pharmaceutical company-funded randomized controlled trial found that physicians' participation in recruiting subjects was associated with an increase in the number of prescriptions of the sponsoring company's drug [37]. One time-series analysis found no change in the rate of decline in the prescribing of a medication when the main manufacturer was required by a regulatory agency to deliver an educational program warning about problems with the drug via mailed information and pharmaceutical sales representative visits [58]. A cross-sectional study found no change in prescription rates following warning letters regarding drug side effects [59].
Pharmaceutical Company Information and Prescribing Costs
Eight studies (Table 9) [35],[41],[50],[55],[66],[68],[69],[71] measured prescribing costs as costs per physician, price elasticity, and changes in generic prescribing (ten units of analysis). In the United States, one econometric time-series analysis found that pharmaceutical sales representative visits were associated with increased price sensitivity among physicians prescribing in one therapeutic class [69], and another found the opposite effect for hypertension [50]. A third, more recent, econometric study found that promotional outlay (the total for pharmaceutical sales representative visits, journal advertisements, and direct mail) was associated with reduced price sensitivity for primary care providers and psychiatrists in 11 therapeutic classes consisting of more than 50% of the Dutch drug market [41]. Of three cross-sectional studies, two detected an association between pharmaceutical sales representative visits and higher prescribing costs [66],[71], but one did not detect an association [68]. One study also found that low cost prescribers were more likely to have rarely or never read promotional mail or journal advertisements from pharmaceutical companies than high cost prescribers [66]. One time-series analysis found that reduced exposure to pharmaceutical sales representative visits and promotional material was associated with an increase in generic prescribing [55]. A randomized controlled trial of pharmaceutical sales representative visits in a noncommercial partnership between a pharmaceutical company and a local health authority measured physicians' prescribing costs for the target drug class and found no effect [35].

Discussion
Overview
We found that the reported relationship between exposure to information provided directly by pharmaceutical companies and the quality, frequency, and cost of prescribing varied from case to case. However, with only one exception [39], the included studies reported that exposure to information from pharmaceutical companies was associated with either lower prescribing quality or no association was detected. Similarly, exposure to information from pharmaceutical companies was associated with either an increase in prescribing frequency or no association was detected. Three studies found that exposure was associated with increased drug sales up to a point of diminishing returns beyond which more promotion was increasingly less effective [46],[50],[69]. Finally, with only one exception [69], exposure to information from pharmaceutical companies was associated with an increase in prescribing costs or no association was detected.
This review has supported, updated, and extended the findings of previous reviews regarding the effects of exposure to information from pharmaceutical companies. 38 of the 58 included studies (66%) were not included in previous systematic reviews on this topic [25],[29]–[32],[34],[35],[40]–[42],[44],[48],[49],[51]–[59],[61]–[68],[70],[72],[75],[76],[78]–[82], including seven of the ten studies of prescribing quality [37],[58],[59],[61],[64],[81],[82] and four of the seven studies of prescribing costs [35],[55],[66],[68].
Most of the included studies measured the frequency of prescribing. Amongst these, the studies of informational exposure where physicians are active participants, such as representatives' visits, sponsored meetings, or sponsored trials, more consistently found associations with higher prescribing frequency than studies of more passive exposures, such as journal advertisements and mailed information. Poor study quality precludes confident conclusions about journal advertising. However, one higher quality econometric analysis found that advertisements in journals were associated with a more pronounced effect on market share than positive scientific findings published in journals [49]. Also there are claims in the marketing literature that the relatively low cost of passive methods and their ability to synergistically increase the effectiveness of active methods makes them cost effective components of sales campaigns [84].
Limitations of Included Studies
All of the included studies had design limitations (Tables 1–5). We found only two randomized controlled trials [35],[36]. Both lacked adequate reporting of allocation concealment and blinding. These two trials did not examine standard promotional practice but instead assessed novel partnerships of government or academia with industry aiming for less expensive, higher quality prescribing. On the basis of these two negative randomized controlled trials, it seems unlikely that similar partnerships will have beneficial effects on prescribing. No definite conclusions can be extrapolated from these studies to standard promotional practice.
All other included studies were observational and thus able to measure associations but not prove causation. There is a risk that reported associations may be false positives, and that statistically significant findings may not necessarily be clinically significant. One example is the study by Mizik et al. that reports only a small increase in prescriptions associated with visits from pharmaceutical sales representatives [45]. Associations may also arise from confounding, bias, or chance. False negatives or inaccurate estimation of effect sizes may result from small sample sizes, measurement errors, overly complex models, or “contamination” when prescribers who are thought to be unexposed are actually influenced by other methods. For example in a study of promotional meetings, nonattenders may be influenced by sales representatives thus reducing the difference from attenders in their prescribing. Another possible source of contamination is indirect influence by colleagues who have been influenced directly.
To the extent that the measured associations are real, causality may be bidirectional. The influence of information from pharmaceutical companies on prescribing is a likely explanation for the associations given that the major purpose of pharmaceutical promotion is to influence prescribing [3]. However, it is also possible that physicians who prescribe larger quantities, more expensively or less appropriately may allow themselves to be exposed to, or attract, more promotional information.
Some studies found no association between exposure to information from pharmaceutical companies and prescribing outcomes or small effect sizes that seem unlikely to be clinically significant. Some of these may be false negatives or underestimations caused by study flaws, but it is likely that information from companies sometimes has little or no effect, especially when the information is not designed to increase sales, e.g., letters warning about safety problems. Most of the studies included in this review examined single components of promotional campaigns that may have little or no effect alone but have a synergistic effect in combination with other components. Promotion may be less effective if it is used beyond the point of diminishing returns or is up against similarly effective promotion for another similar product.
Given the controversial nature of this topic, there are many reasons why the studies could be biased overall in either direction. Authors may have produced results consistent with their ideological bias. Also reciprocal obligation to funders who preferred certain results may have lead to bias with or without conscious awareness. Publication and outcome reporting bias may have led to underrepresentation of negative, positive, uninteresting, or unwanted findings.
Strengths and Weaknesses
The strengths of this review include use of a comprehensive search strategy over multiple databases without any language exclusions. We consulted widely with experts in the field and we used validated instruments to assess quality of the studies. However, only one of the included studies was conducted in a low-income economy, as defined by the World Bank, so the effects of promotion there are less certain [33]. This study found a positive association between pharmaceutical promotion and prescribing frequency. Promotion may be more influential in these countries given the relative paucity of independent sources of information [85],[86].
Our efforts to access data that was not in the databases we searched had mixed results. Messages on e-mail discussion groups and contact with experts yielded five additional studies subsequent to the initial search [34],[43],[80]–[82] whose results were consistent with the entire review. By contrast, pharmaceutical companies did not provide us with any information that was not already in the public domain. However five studies included in this review analyzed confidential data from pharmaceutical companies and their results were also consistent with the review as a whole [33],[35],[37],[40],[46].
Given the wide range of knowledge and experience among the sources that we consulted and the expertise in our group, we are confident that we exhausted all reasonable avenues in our attempt to obtain additional literature.
Data Interpretation
Of the 58 studies included in this review, 38 studies reported a single unit of analysis with 25 (66%) finding significant associations between exposure to information from pharmaceutical companies and the quality, frequency, and cost of prescribing and eight (21%) finding no associations. The remaining five (13%) had multiple measures and found significant associations on some measures but not on others. The 20 studies with more than one unit of analysis reported 49 units of analysis of which 21 (43%) found significant associations, 24 (49%) found no associations, and four (8%) found mixed results. The difference between the results of the single versus multiple unit of analysis studies is significant (p<0.05 Freeman-Halton extension of the Fisher exact test). This difference may have been caused by publication bias against publication of single unit of analysis studies when no association was found. We believe the pattern of results suggests that there was little or no reporting bias for the multiple unit of analysis studies. Because the multiple unit of analysis studies found no association more often than the single unit of analysis studies, multiple mentions of the former studies in our narrative synthesis will not exaggerate the frequency of findings of significant associations.
Interpretation of our meta-analysis requires caution because many studies included in the narrative synthesis could not be included in the meta-analysis. Where a sufficient number of studies could be combined, there was significant heterogeneity. The summary result has not been presented because it is unlikely to accurately reflect the true effect size of most promotional campaigns for two main reasons. First, effect sizes varied widely so it is likely that promotional campaigns often have effect sizes far from average. Second, single promotional techniques are likely to be less effective individually than campaigns employing multiple promotional methods.
A sensitivity analysis found the difference between passive and active promotion is one possible cause of heterogeneity. Other possible explanations for variation in the effectiveness of promotion include variation from campaign to campaign in the relative benefits of the drug being promoted, the promoter's skills and budget, and the target group's level of resistance to promotion.
Conclusions
The limitations of studies reported in the literature mentioned above mean that we are unable to reach any definitive conclusions about the degree to which information from pharmaceutical companies increases, decreases, or has no effect on the frequency, cost, or quality of prescribing. In theory, advertising may be beneficial in several ways: by distributing information and thus improving the quality of prescribing [20],[78], by reducing costs through increasing price-elasticity [69], by increasing prescribing of drugs that provide better health outcomes, or by improving the cost-effective use of healthcare resources. Because of the limitations of both the included studies and this review we have not disproved those theories but we have found little evidence to support them and have found some evidence of increased costs and decreased quality of prescribing. Any conclusions about harm or benefit for patients are speculative because none of the studies that we found examined clinical outcomes. One clear conclusion from this review is that we did not find evidence of net improvements in prescribing associated with exposure to information from pharmaceutical companies.
Some argue that prescribers have an ethical duty to avoid exposure to pharmaceutical promotion [13],[87]–[89]. Even ineffective promotional information may be harmful if it wastes prescribers' time or if the money spent on promotion increases the cost of medicines [90]; this is of concern given the large expenditure involved [1],[2]. In the absence of evidence of net improvement in prescribing from exposure to promotional information, we recommend that practitioners follow the precautionary principle and thus avoid exposure to information from pharmaceutical companies unless evidence of net benefit emerges.
Supporting Information
Zdroje
1. GagnonMA
LexchinJ
2008 The cost of pushing pills: a new estimate of pharmaceutical promotion expenditures in the United States. PLoS Med 5 e1 doi:10.1371/journal.pmed.0050001
2. BrasPL
RicordeauP
RoussilleB
SaintoyantV
L'information des médecins généralistes sur le médicament. Report No RM 2007-136 P. Inspection générale des affaires sociales. September 2007. Available: http://lesrapports.ladocumentationfrancaise.fr/BRP/074000703/0000.pdf. Accessed 10 July 2010
3. GaraiP
1964 Advertising and promotion of drugs.
TalalayP
Drugs in our society Baltimore John Hopkins Press
4. Pharmaceutical Research and Manufacturers of America (PhRMA) Code on Interactions with Healthcare Professionals. Available: http://www.phrma.org/code_on_interactions_with_healthcare_professionals. Accessed 8 July 2010
5. ProsserH
WalleyT
2003 Understanding why GPs see pharmaceutical representatives: a qualitative interview study. Br J Gen Pract 53 305 311
6. ChimonasS
BrennanTA
RothmanDJ
2007 Physicians and drug representatives: exploring the dynamics of the relationship. J Gen Intern Med 22 184 190
7. FischerMA
KeoughME
BarilJL
SaccoccioL
MazorKM
2009 Prescribers and pharmaceutical representatives: why are we still meeting? J Gen Intern Med 24 795 801
8. SteinmanMA
ShlipakMG
McPheeSJ
2001 Of principles and pens: attitudes and practices of medicine housestaff toward pharmaceutical industry promotions. Am J Med 110 551 557
9. RutledgeP
CrookesD
McKinstryB
MaxwellSR
2003 Do doctors rely on pharmaceutical industry funding to attend conferences and do they perceive that this creates a bias in their drug selection? Results from a questionnaire survey. Pharmacoepidemiol Drug Saf 12 663 667
10. MorganMA
DanaJ
LoewensteinG
ZinbergS
SchulkinJ
2006 Interactions of doctors with the pharmaceutical industry. J Med Ethics 32 559 563
11. BlumenthalD
2004 Doctors and drug companies. N Engl J Med 351 1885 1890
12. RothmanDJ
McDonaldWJ
BerkowitzCD
ChimonasSC
DeAngelisCD
2009 Professional medical associations and their relationships with industry: a proposal for controlling conflict of interest. JAMA 301 1367 1372
13. MansfieldPR
LexchinJ
WenLS
GrandoriL
McCoyCP
2006 Educating health professionals about drug and device promotion: advocates' recommendations. PLoS Med 3 e451 doi:10.1371/journal.pmed.0030451
14. OthmanN
VitryA
RougheadEE
2009 Quality of pharmaceutical advertisements in medical journals: a systematic review. PLoS One 4 e6350 doi:10.1371/journal.pone.0006350
15. MontgomeryBD
MansfieldPR
SpurlingGK
WardAM
2008 Do advertisements for antihypertensive drugs in Australia promote quality prescribing? A cross-sectional study. BMC Public Health 8 167
16. ZieglerMG
LewP
SingerBC
1995 The accuracy of drug information from pharmaceutical sales representatives. JAMA 273 1296 1298
17. HemminkiE
1977 Content analysis of drug-detailing by pharmaceutical representatives. Med Educ 11 210 215
18. WazanaA
2000 Physicians and the pharmaceutical industry: is a gift ever just a gift? JAMA 283 373 380
19. ZipkinDA
SteinmanMA
2005 Interactions between pharmaceutical representatives and doctors in training. A thematic review. J Gen Intern Med 20 777 786
20. ManchandaP
HonkaE
2005 The effects and role of direct-to-physician marketing in the pharmaceutical industry: an integrative review. Yale J Health Policy Law Ethics 5 785 822
21. HigginsJ
2008 Assessing risk of bias in included studies.
AltmanDG
HigginsJPT
GS
Cochrane handbook for systematic reviews of interventions Version 501 The Cochrane Collaboration Chichester, UK Wiley-Blackwell
22. WellsG
SheaB
O'ConnellD
PetersonJ
WelchV
2005 The Newcastle-Ottawa Scale (NOS) for assessing the quality of nonrandomised studies in meta-analysis. Available: http://www.ohri.ca/programs/clinical_epidemiology/oxford.htm. Accessed 12 September 2010
23. DeeksJJ
DinnesJ
D'AmicoR
SowdenAJ
SakarovitchC
2003 Evaluating non-randomised intervention studies. Health Technol Assess 7 iii x, 1–173
24. StroupDF
BerlinJA
MortonSC
OlkinI
WilliamsonGD
2000 Meta-analysis of observational studies in epidemiology: a proposal for reporting. Meta-analysis Of Observational Studies in Epidemiology (MOOSE) group. JAMA 283 2008 2012
25. HemminkiE
KarttunenT
HoviSL
KarroH
2004 The drug industry and medical practice–the case of menopausal hormone therapy in Estonia. Soc Sci Med 58 89 97
26. ClearyJD
1992 Impact of pharmaceutical sales representatives on physician antibiotic prescribing. J Pharm Technol 8 27 29
27. SchwartzTL
KuhlesDJ2nd
WadeM
MasandPS
2001 Newly admitted psychiatric patient prescriptions and pharmaceutical sales visits. Ann Clin Psychiatry 13 159 162
28. OrlowskiJP
WateskaL
1992 The effects of pharmaceutical firm enticements on physician prescribing patterns. There's no such thing as a free lunch. Chest 102 270 273
29. HendersonJ
MillerG
PanY
BrittH
2008 The effect of advertising in clinical software on general practitioners' prescribing behaviour. Med J Aust 188 15 20
30. GrevingJP
DenigP
van der VeenWJ
BeltmanFW
SturkenboomMC
2006 Determinants for the adoption of angiotensin II receptor blockers by general practitioners. Soc Sci Med 63 2890 2898
31. KreyenbuhlJ
MarcusSC
WestJC
WilkJ
OlfsonM
2007 Adding or switching antipsychotic medications in treatment-refractory schizophrenia. Psychiatr Serv 58 983 990
32. CanliH
SaatciE
BozdemirN
AkpinarE
KirogluM
2006 The antibiotic prescribing behaviourof physicians for acute tonsillopharyngitis in primary care. Ethiop Med J 44 139 143
33. PeayMY
PeayER
1988 The role of commercial sources in the adoption of a new drug. Soc Sci Med 26 1183 1189
34. CharbitO
2003 [Influence de la publicité pharmaceutique sur la prescription.] Influence of pharmaceutical advertising on prescription [MD dissertation] Toulouse University Paul Sabatier Toulouse III
35. FreemantleN
JohnsonR
DennisJ
KennedyA
MarchmentM
2000 Sleeping with the enemy? A randomized controlled trial of a collaborative health authority/industry intervention to influence prescribing practice. Br J Clin Pharmacol 49 174 179
36. DolovichL
LevineM
TarajosR
DukuE
1999 Promoting optimal antibiotic therapy for otitis media using commercially sponsored evidence-based detailing: A prospective controlled trial. Drug Information Journal 33 1067 1077
37. AndersenM
KragstrupJ
SondergaardJ
2006 How conducting a clinical trial affects physicians' guideline adherence and drug preferences. JAMA 295 2759 2764
38. ChrenMM
LandefeldCS
1994 Physicians' behavior and their interactions with drug companies. A controlled study of physicians who requested additions to a hospital drug formulary. JAMA 271 684 689
39. SpingarnRW
BerlinJA
StromBL
1996 When pharmaceutical manufacturers' employees present grand rounds, what do residents remember? Acad Med 71 86 88
40. VenkataramanS
StremerschS
2007 The debate on influencing doctors' decisions: are drug characteristics the missing link? Manage Sci 53 1688 1701
41. WindmeijerF
de LaatE
DouvenR
MotE
2006 Pharmaceutical promotion and GP prescription behaviour. Health Econ 15 5 18
42. ChintaguntaP
DesirajuR
2005 Strategic detailing and pricing behaviour in international markets. Marketing Science 24 67 80
43. NarayananS
ManchandaP
ChintaguntaPK
2005 Temporal differences in the role of marketing communication in new product categories. J Marketing Res 42 278 290
44. DonohueJ
BerndtE
2004 Effects of direct-to-consumer advertising on medication choice: the case of anti-depressants. J Public Policy Mark 23 115 127
45. MizikN
JacobsonR
2004 Are physicians “easy marks”? quantifying the effects of detailing and sampling on new prescriptions. Manage Sci 50 1704 1715
46. ManchandaP
ChintaguntaP
2004 Responsiveness of physician prescription behaviour to salesforce effort: an individual level analysis. Market Lett 15 129 145
47. ManchandaP
RossiP
ChintaguntaP
2004 Response modeling with nonrandom marketing-mix variables. J Marketing Res 41 467 478
48. BerndtE
PindyckR
AzoulayP
2003 Consumption externalities and diffusion in pharmaceutical markets: antiulcer drugs. The J Ind Econ L1 243 270
49. AzoulayP
2002 Do pharmaceutical sales respond to scientific evidence? J Econ Manage Str 11 551 594
50. RizzoJ
1999 Advertising and competition in the ethical pharmaceutical industry: the case of antihypertensive drugs. J Law Econ 42 89 116
51. HurwitzM
CavesR
1988 Persuasion or information? promotion and the shares of brand name and generic pharmaceuticals. J Law Econ 31 299 320
52. MackowiakJI
GagnonJP
1985 Effects of promotion on pharmaceutical demand. Soc Sci Med 20 1191 1197
53. LefflerK
1981 Persuasion or information? the economics of prescription drug advertising. J Law Econ 24 45 74
54. TelserL
BestW
EganJ
HiginbothamH
1975 The theory of supply with applications to the ethical pharmaceutical industry. J Law Econ 18 449 478
55. SpurlingG
MansfieldP
2007 General practitioners and pharmaceutical sales representatives: quality improvement research. Qual Saf Health Care 16 266 270
56. StaffordRS
FurbergCD
FinkelsteinSN
CockburnIM
AlehegnT
2004 Impact of clinical trial results on national trends in alpha-blocker prescribing, 1996–2002. JAMA 291 54 62
57. AuvrayL
HensgenF
SermetC
2003 La diffusion de l'innovation pharmaceutique en médicine libérale: revue de la littérature et premiers résultants français. Bulletin d'information en économie de la santé 73
58. SoumeraiSB
AvornJ
GortmakerS
HawleyS
1987 Effect of government and commercial warnings on reducing prescription misuse: the case of propoxyphene. Am J Public Health 77 1518 1523
59. KazmierczakR
ColeyKC
1997 Impact of Dear Doctor letters on prescribing: evaluation of the use of tramadol HCl. Formulary 32 977 978
60. BowmanMA
PearleDL
1988 Changes in drug prescribing patterns related to commercial company funding of continuing medical education. J Contin Educ Health Prof 8 13 20
61. de BakkerDH
CoffieDS
HeerdinkER
van DijkL
GroenewegenPP
2007 Determinants of the range of drugs prescribed in general practice: a cross-sectional analysis. BMC Health Serv Res 7 132
62. SteinmanMA
HarperGM
ChrenMM
LandefeldCS
BeroLA
2007 Characteristics and impact of drug detailing for gabapentin. PLoS Med 4 e134 doi:10.1371/journal.pmed.0040134
63. VerdouxH
CougnardA
GrolleauS
BegaudB
2005 Impact of visits from pharmaceutical company representatives on antipsychotic prescription in primary care. Schizophr Res 77 107 109
64. MuijrersPE
GrolRP
SijbrandijJ
JanknegtR
KnottnerusJA
2005 Differences in prescribing between GPs: impact of the cooperation with pharmacists and impact of visits from pharmaceutical industry representatives. Fam Pract 22 624 630
65. HuangFY
WeissDS
FenimorePG
FlemingAM
HallerE
2005 The association of pharmaceutical company promotional spending with resident physician prescribing behavior. Acad Psychiatry 29 500 501
66. WatkinsC
HarveyI
CarthyP
MooreL
RobinsonE
2003 Attitudes and behaviour of general practitioners and their prescribing costs: a national cross sectional survey. Qual Saf Health Care 12 29 34
67. ProsserH
WalleyT
2003 New drug uptake: qualitative comparison of high and low prescribing GPs' attitudes and approach. Fam Pract 20 583 591
68. CaamanoF
FigueirasA
Gestal-OteroJJ
2002 Influence of commercial information on prescription quantity in primary care. Eur J Public Health 12 187 191
69. GonulF
CarterF
PetrovaE
SrinivasanK
2001 Promotion of prescription drugs and its impact on physicians' choice behaviour. J Marketing 65 79 90
70. JonesM
GreenfieldS
BradleyC
1999 A survey of the advertising of nine new drugs in the general practice literature. J Clin Pharm Ther 24 451 460
71. CaudillTS
JohnsonMS
RichEC
McKinneyWP
1996 Physicians, pharmaceutical sales representatives, and the cost of prescribing. Arch Fam Med 5 201 206
72. BeringsD
BlondeelL
HabrakenH
1994 The effect of industry-independent drug information on the prescribing of benzodiazepines in general practice. Eur J Clin Pharmacol 46 501 505
73. LurieN
RichEC
SimpsonDE
MeyerJ
SchiedermayerDL
1990 Pharmaceutical representatives in academic medical centers: interaction with faculty and housestaff. J Gen Intern Med 5 240 243
74. HaayerF
1982 Rational prescribing and sources of information. Soc Sci Med 16 2017 2023
75. WaltonH
1980 Ad recognition and prescribing by physicians. J Advertising Res 20 39 48
76. DajdaR
1978 Drug advertising and prescribing. J R Coll Gen Pract 28 538 541
77. BeckerMH
StolleyPD
LasagnaL
McEvillaJD
SloaneLM
1972 Differential education concerning therapeutics and resultant physician prescribing patterns. J Med Educ 47 118 127
78. ChingA
IshiharaM
2007 The effects of detailing on prescribing decisions under two-sided learning. Available: http://mpra.ub.uni-muenchen.de/4935/. Accessed 21 October 2009. Toronto: Rotman School of Management, University of Toronto
79. RosenthalM
BerndtE
DonohueJ
EpsteinA
FrankR
2003 Demand effects of recent changes in prescription drug promotion Cambridge Harvard School of Public Health
80. Health Care Communications 1989 The effect of journal advertising on market shares of new prescriptions New York Health Care Communications Inc.
81. BlondeelL
CannoodtL
De MeyereM
ProesmansH
PharmD
1987 Prescription behaviour of 358 Flemish general practitioners. In: Proceedings of the International Society of General Medicine Conference. Prague
82. MansfieldP
2000 Year of graduation, level of “scepticism” and attendance at sponsored meetings are significant predictors of General Practioners' beliefs about the appropriateness of drugs Adelaide Medical Lobby for Appropriate Marketing Inc Available: http://www.healthyskepticism.org/global/news/int/hsin2010-05. Accessed 12 September 2010
83. ChingA
IshiharaM
2010 The effects of detailing on prescribing decisions under quality uncertainty. Quant Mark Econ 8 123 165
84. LidstoneJ
CollierT
1987 Marketing planning for the pharmaceutical industry Aldershot (UK) Gower
85. LexchinJ
1995 Deception by design: pharmaceutical promotion in the third world Penang Consumers International
86. VancelikS
BeyhunNE
AcemogluH
CalikogluO
2007 Impact of pharmaceutical promotion on prescribing decisions of general practitioners in Eastern Turkey. BMC Public Health 7 122
87. BrodyH
2005 The company we keep: why physicians should refuse to see pharmaceutical representatives. Ann Fam Med 3 82 85
88. American Medical Student's Association. Available: http://www.amsa.org/. Accessed 7 October 2009
89. No Free Lunch. Available: http://www.nofreelunch.org/aboutus. Accessed 7 October 2009
90. JohnstonSC
HauserSL
2007 Marketing and drug costs: who is laughing and crying? Ann Neurol 61 11A 12A
Štítky
Interní lékařstvíČlánek vyšel v časopise
PLOS Medicine
2010 Číslo 10
- Proces hojení ran krok za krokem a co ho může zkomplikovat
- Limity glykovaného hemoglobinu a význam dalších glykovaných proteinů
- Korelace dávky levothyroxinu s titrem autoimunitních protilátek u primární hypotyreózy
- Plicní hypertenze – syndrom mnoha tváří – vyžaduje přesnou diagnostiku a specializovanou léčbu
- Rána vizitkou (nejen) chirurga
Nejčtenější v tomto čísle
- Epigenetic Epidemiology of Common Complex Disease: Prospects for Prediction, Prevention, and Treatment
- Prenatal Treatment for Serious Neurological Sequelae of Congenital Toxoplasmosis: An Observational Prospective Cohort Study
- Editors, Publishers, Impact Factors, and Reprint Income
- Oral Ondansetron Administration in Emergency Departments to Children with Gastroenteritis: An Economic Analysis
Zvyšte si kvalifikaci online z pohodlí domova
Mazová zátka a její řešení
nový kurzVšechny kurzy