
Immediate effect of physical on blood flow velocity in radial artery in young adults
Authors:
Tomáš Jůza; Daniel Vlk
Authors place of work:
Department of Biophysics, Faculty of Medicine, Masaryk University Brno, Brno, Czech Republic
Published in the journal:
Lékař a technika - Clinician and Technology No. 4, 2018, 48, 118-122
Category:
Original research
Summary
Purpose: Quantify changes in blood flow velocity in the radial artery after local dynamic exercise and compare these results between a group of women and men. Acquire data of normal resting blood flow in the radial artery.
Methods: We examined 42 healthy young volunteers (21 men and 21 women) of the age about 20. A pocket Doppler ultrasound device was used for measurements. Physical exercise was defined as one-minute-long, one-handed weightlifting. Hemodynamic parameters were registered during resting before exercise and immediately after exercise.
Results: Resting baseline values: overall maximum blood flow velocity 26.49 cm/s (SD: 9.99 cm/s), mean blood flow velocity 8.46 cm/s (SD: 6.17 cm/s), and pulsatility index (PI) 5.46 (SD: 5.7) for the whole group. Mean percentage increase of maximum blood flow velocity is 36.5%, mean blood flow velocity 243%. PI was reduced by 52.8%. There was a presumed significant difference in the percentage change of PI between the group of women and men (p<0.05). There is also a typical change in velocity waveform after exercise.
Conclusion: The most altered parameter is mean blood flow velocity, which corresponds to an observed change of velocity waveform probably caused by local vasodilatation lasting only for several seconds.
Keywords:
blood flow velocity – radial artery – doppler ultrasound – local physical exercise
Introduction
Ultrasonic display of blood flow in vessels has a vast clinical usage for evaluation of the function of the venous and, in our case, the more important arterial system. The calculation of velocity parameters is enabled by the application of the Doppler Effect.
Pathologies, which can be diagnosed using this method, are vessel strictures, valve insufficiency, anatomical anomalies, vascular shunts or impacts of medical interventions [1].
Assessment of blood flow can be also done without
B-mode tissue visualization; therefore, smaller portable bedside monitors can be used, similar to those we took for our experiment. However, quantification of this method is rather difficult, which means that there are no official normal values for blood velocities in medium or small arteries. The absolute numbers are highly depen-dent on the angle between the probe and vessel axes and localization of the measured sample of the flow.
The radial artery is a high-resistance limb artery and its normal blood flow velocity values are not definitely established. The actual values can be easily altered by many external and internal influences.
The purpose of this study was to describe and quantify changes of blood velocity parameters in the radial artery after the local exhausting exercise of the arm. Based on the literature, we hypothesized, that there would be a significant increase in mean blood flow velocity immediately after exercise. The other hypothesis was that the increase should be greater in women than in men.
Material and Methods
42 healthy young adults (21 women and 21 men) volunteered in this study. The subjects were 20 ± 1 years of age, 170.3 ± 7.3 cm in height and 62.7 ± 7.8 kg
in weight. Every subject was familiarized with the experimental protocol. Informed consent was obtained orally. The subjects were seated in a chair with one forearm placed on the table. Three 5-second-long records of blood velocity were obtained in this position. The ultrasound probe was held manually at an angle of about 60° aiming at radial artery 1–3 cm proximal from the radio-carpal joint in order to get top/maximum velocity. The same procedure was performed on both arms. Then the subject performed a one-minute, dy-namic, one-hand elbow flection with a 6 kg dumb-bell in a 2–6 s (flection/extension) cadence, depending on subject abilities. Immediately after putting down the dumb-bell, another 5-second record of radial artery blood flow velocity was taken. This protocol was applied on both arms. We used the Hadeco Bidop ES-100V3 (Hadeco Inc., Kawasaki, Japan) ultrasound device with standard probe with frequency 5 MHz and Smart-V-LinkTM recording software.
Based on previous studies, we decided to evaluate parameters of maximum blood velocity, mean blood velocity, and pulsatility index (PI).
Maximum blood flow velocity (BFV) is represented by the peak systolic velocity and is very variable especially in peripheral arteries such as radial artery. Mean blood flow velocity (BFV) means the time average value of blood flow velocity during the whole cardiac cycle.
Pulsatility index (PI) is a measure of the variability of blood flow velocity in a vessel, equal to the difference of peak systolic and minimum diastolic velocities divided by the mean velocity during the cardiac cycle.
Results
Baseline BFV characteristics:
Our average resting values for the whole group were: maximum BFV: 26.5 cm/s, mean BFV: 8.5 cm/s and PI: 5.5. According to gender the average parameters for the group of men were: maximum BFV: 28.9 cm/s, mean BFV: 9.9 cm/s and PI: 4.6; the group of women was characterized by maximum BFV: 24.1 cm/s, mean BFV: 7 cm/s and PI: 6.3.
Characteristics of the whole group:
Compared to the resting period, maximum as well as mean blood flow velocity was increased with exercise (P < 0.05). PI was significantly reduced after exercise (P < 0.05) according to the Wilcoxon nonparametric test via StatisticaTM software (StatSoft CR s.r.o., Prague, Czech Republic).
The overall average increase of maximum BFV was 6.99 cm/s with SD = 8.48 cm/c. On the other hand, the change in mean blood flow velocity showed less variability (SD = 5.25 cm/s) and greater difference: 9.1 cm/s. The average decrease of PI equaled to −3.96 and SD of 5.45, but there was only one example with a difference of PI bigger than 0. In view of the percentage of resting values, maximum BFV increased by 36.5%, mean BFV increased by 243% and PI decreased by −53%. Table 1 shows that the greatest change occurred in the mean BFV (243%) and the most homogenous difference is represented by PI (SD = 27.8).

Comparison of the left and right arm:
There is no statistically significant difference between the values obtained on the left and the right arm. The changes of BFV parameters are very similar for both arms (Table 2).

Comparison of gender:
There is a difference in the percentage of PI change between the group of men and women, p < 0.05 (0.02) using T-test for independent samples. The decrease is greater in the group of women (59.8%) than in men (45.9%) (Table 3).

Graphical changes in velocity waveform


Standard triphasic waveform with a steep systolic rise and subsequent decrease with some retrograde flow (due to high peripheral resistance) and slight flow persisting during diastole [1] during rest (Fig. 1) are replaced in a short period of time (approximately 90 seconds) by saw-like waveform (Fig. 2) with elevation of systolic part between first and second peak. Moreover, this change explains the great increase of mean blood flow velocity.
Restoration to the resting values
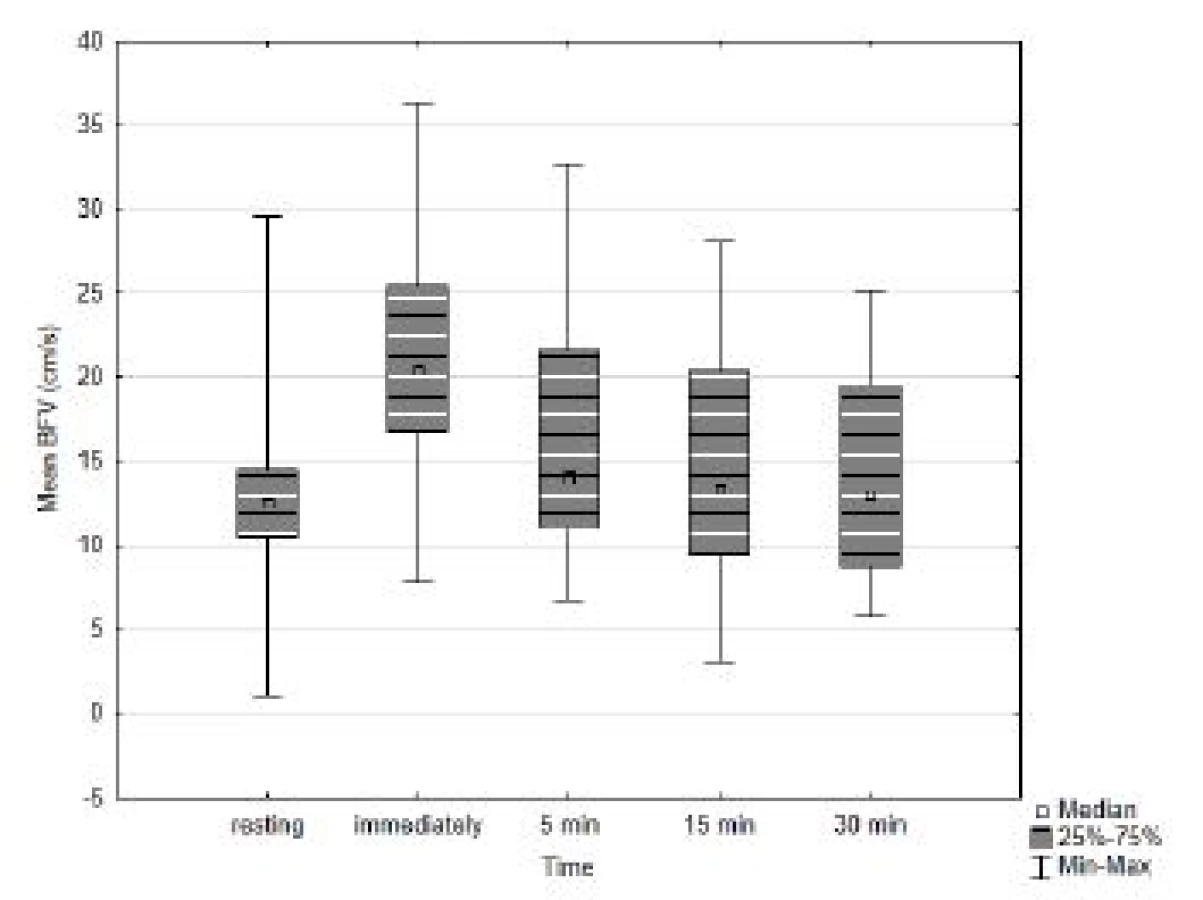
In a small group of participants (4 women and 7 men) we performed additional recording of blood flow velocity values at 5, 15 and 30 minutes after exercise. The purpose of these measurements was to determine how long the blood flow of radial artery stays altered after this localized exercise. We did not find any statistically significant difference (p > 0.05) between resting values of maximum and mean blood flow velocity and PI and values at 5, 15 and 30 minutes (Fig. 3). In accordance with these results, the appearance of the velocity waveforms at 5 minutes and later was identical to resting records.
Discussion
Influence of muscle contraction on arterial blood flow in brachial [2–5] or femoral [6–10] artery was examined. However, it is difficult to compare in a quantified manner because results are usually expressed in blood flow in ml/min and calculated using average vessel diameter.
The most similar observation was found in the following studies: Walløe and Wesche [10] observed that during rhythmic exercise of 10% maximal voluntary contraction the increase of maximal BFV varies from 220 to 480% in femoral artery, and there is no difference between females and males. Increase of mean BFV from 8.07 ± 3.36 cm/s to 19.7 ± 9.35 cm/s by 5 min of dynamic knee extension was published by Shoemaker et al. [7]. Expressed in percentages, this increase is very close to our observation (244%). Moreover, DeLorey et al. [4] Thompson et al [3] and Hoelting et al. [8] confirmed the intensity-dependent manner of blood flow increase after exercise.
Results by Parker et al. [6] also showed that the hyperemic response to exercise was greater (p < 0.01) in women as was femoral blood flow at workloads greater than 15 watts. This observation is in agreement with our results in radial artery.
However, these papers give information about bigger vessels with different bloodstream localization to dominantly working muscle groups and different experimental protocols. These settings were probably chosen to enable stable probe placement and continual measurement.
Maximum BFV, or also called peak systolic velocity, is usually used in older studies and the values differ substantially. On the other hand, mean BFV better describes the flow and together with vessel diameter serves to calculate blood flow. Published values of mean BFV in radial artery: 17.0 ± 5.5 cm/s [11], 26.8 ± 4.9 cm/s [12], left: 8.8 (6.3–11.3) cm/s, right: 7.2 (4.2–10.2) cm/s [13], left: 9.51 ± 4.44 cm/s, right: 7.98 ± 4.41 cm/s [14]. Peak systolic velocity 59.1 ± 10.4 cm/s [12], 26.6 ± 3.2 cm/s [15], left: 56.26 ± 11.82 cm/s, right: 50.91 ± 11.55 cm/s [14] and PI 1.83 ± 0.18 [12]. These numbers show great hetero-geneity and our velocity values are most similar to Krullaards et al. [13], Targett et al. [15] and partially to Kim et al. [14] (Table 4).

Blood velocity parameters in peripheral arteries such as radial artery are easily altered by many external and internal stimuli. Strong influence can be found in tem-perature [16, 17] and vegetative system activity [18].
Changes in mean BFV correspond with the typical appearance of time dependent velocity curve after exercise.
We can try to explain the elevation of the part between two peaks of the velocity curve using the multi-branch mathematical vascular model by Masuda et al. [19], which describes the model of common carotid artery. We can at least guess which part of the arterial system could be responsible for the curve of this part of cardiac cycle. By anatomical analogy, it seems to be the reduction of reflected flow from distant arm arteries, palmar arches.
Arteries in hand are compressed during the exercise thanks to contraction of hand muscles and the weight of dumbbell. Putting down the load probably leads to local vasodilatation, which contributes to changing the veloc-ity waveform [1].
Unfortunately, we did not find papers discussing BFV waveforms influenced by exercise.
Usage of arterial Doppler ultrasound for evaluating alteration of BFV in other types of workload such as backpack carrying [20] or neck trauma [13] brought significant results as well. Possible clinical benefit can be found in validation of sympathic nervous stimulation [18].
The influence of local exhausting physical exercise is presumed as one of the greatest possible influences to regional hemodynamic, thus other systemic external and internal stimuli should not exceed these differences.
Long-term effects of aerobic training are more often examined than immediate impact of physical exercise. Madhura and Sandhya [21] described that the hemo-dynamic changes caused by regular aerobic training exist and are reversible.
Possible clinical application of our modified methodic could be used for noninvasive evaluation of peripheral vascular diseases which symptoms are dependent on physical activity for example chronic lower limb ische-mia. In this case mobility readiness of pocket Doppler ultrasound device is very useful.
There were some limitations of our study as well, e.g. manual placement of the ultrasound probe is not able to maintain the same angle between the axis of the ultra-sound beam and the vessel axis. On the other hand, this method gives better flexibility in maintaining the strongest signal, and allows to adapt the probe position to the patient's physiognomy.
Other limitation can be found in characteristics of group of probands. We have investigated group of first year medical students. Nutrition levels of normal BMI values, physical activity ranging from passive life style to semiprofessional sportsmen. The level of physical condition is partially reduced by the variability of flection-extension cadence, which was strongly depen-dent on performance status of each proband. Using strict amount of physically defined work regardless individual potential could lead to different level of exhaustion, thus different vascular response. Our established model caused similar level of subjective limb fatigue in each proband.
Conclusion
We confirmed that there is a significant difference in BFV parameters in radial artery caused by physical exercise of the ipsilateral arm. The most altered param-eter is mean blood flow velocity, which corresponds to observed change of velocity waveform probably caused by local vasodilatation in muscles and palmar arches. These significant changes lasted only for several seconds. The gender difference of PI changes shows that there is greater variability of blood flow velocity in women, which can be caused by anatomical differences. A left—right difference in post-exercise change was not observed, so there is no influence of dominant arm.
Acknowledgement
The authors report no potential conflict of interest relevant to this article. The authors thank all the subjects who participated in this study.
Daniel Vlk
Department of Biophysics
Faculty of Medicine
Masaryk University Brno
Kamenice 3, 625 00 Brno, Czech Republic
E-mail: danvlk@med.muni.cz
Phone: +420 549 498 048
Zdroje
- Schäberle, W.: Ultrasonography in vascular diagnosis: a thera-py-oriented textbook and atlas. Berlin; New York: Springer; 2005.
- Shoemaker, J. K., MacDonald, M. J., Hughson, R. L.: Time course of brachial artery diameter responses to rhythmic hand-grip exercise in humans. Cardiovascular Research, 1997, vol. 1;35, p. 125–31.
- Thompson, B. C., Fadia, T., Pincivero, D. M. et al.: Forearm blood flow responses to fatiguing isometric contractions in women and men. AJP: Heart and Circulatory Physiology, 2007, vol. 23;293(1): p. 805–12.
- DeLorey, D. S., Wang, S. S., Shoemaker, J. K.: Evidence for sympatholysis at the onset of forearm exercise. Journal of Applied Physiology, 2002, vol. 1;93(2), p.555–60.
- Iwamoto, E., Katayama, K., Yamashita, S. et al.: Retrograde blood flow in the inactive limb is enhanced during constant-load leg cycling in hypoxia. European Journal of Applied Physiology, 2013, vol. 113(10), p. 2565–75.
- Parker, B. A., Smithmyer, S. L., Pelberg, J. A. et al.: Sex differ-ences in leg vasodilation during graded knee extensor exercise in young adults. Journal of Applied Physiology, 2007, vol. 9;103(5), p. 1583–91.
- Shoemaker, J. K., Phillips, S. M., Green, H. J. et al.: Faster femoral artery blood velocity kinetics at the onset of exercise following short-term training. Cardiovascular research, 1996, vol. 31(2), p. 278–86.
- Hoelting, B. D., Scheuermann, B. W., Barstow, T. J.: Effect of contraction frequency on leg blood flow during knee extension exercise in humans. Journal of Applied Physiology, 2001, vol. 1;91(2), p.671–9.
- Lott, M. E., Hogeman, C. S., Vickery, L. et al.: Effects of dy-namic exercise on mean blood velocity and muscle interstitial metabolite responses in humans. American Journal of Physio-logy-Heart and Circulatory Physiology, 2001, vol. 281(4), p. 1734–41.
- Walløe, L., Wesche, J.: Time course and magnitude of blood flow changes in the human quadriceps muscles during and following rhythmic exercise. The Journal of physiology, 1988 vol. 405(1), p. 257–73.
- Talegón-Meléndez, A., Ciria-Lloréns, G., Gómez-Cía, T. et al.: Flow changes in forearm arteries after elevating the radial forearm flap: prospective study using color duplex imaging. Journal of ultrasound in medicine, 1999, vol. 18(8), p. 553–8.
- Bardoň, P., Školoudík, D., Langová, K. et al.: Changes in blood flow velocity in the radial artery during 1-hour ultrasound monitoring with a 2-MHz transcranial probe-A pilot study. Journal of Clinical Ultrasound, 2010, vol. 38(9), p.493–6.
- Krullaards, R. L., Pel, J. J., Snijders, C. J. et al.: The Potential Effects of a Biofeedback Writing Exercise on Radial Artery Blood Flow and Neck Mobility. International journal of biomedical science, 2009, vol. 5(2), p. 192.
- Kim, J. U., Lee, Y. J., Lee, J. et al.: Differences in the Properties of the Radial Artery between Cun , Guan , Chi , and Nearby Segments Using Ultrasonographic Imaging: A Pilot Study on Arterial Depth, Diameter, and Blood Flow. Evidence-Based Complementary and Alternative Medicine, 2015, vol. 2015,
p. 1–7. - Targett, R. C., Levy, B., Bardou, A. et al.: Simultaneous Doppler blood velocity measurements from aorta and radial artery
in normal human subjects. Cardiovascular Research, 1985, vol. 1;19(7), p. 394–9. - Ooue, A., Ichinose-Kuwahara, T., Shamsuddin, A. K. M. et al.: Changes in blood flow in a conduit artery and superficial vein of the upper arm during passive heating in humans. European Journal of Applied Physiology, 2007, vol. 21;101(1), p. 97–103.
- Bergersen, T. K., Eriksen, M., Walloe, L.: Effect of local warming on hand and finger artery blood velocities. American Journal of Physiology-Regulatory, Integrative and Comparative Physiology, 1995, vol. 269(2), p. 325–30.
- Eicke, B. M., Mink, S., Küllmer, K. et al.: Comparison of the sympathetic skin response and continuous wave Doppler sono-graphy of the radial artery. Journal of the autonomic nervous system, 1999, vol. 75(2), p. 202–6.
- Masuda, M., Emoto, T., Suzuki, A. et al.: Evaluation of blood flow velocity waveform in common carotid artery using multi-branched arterial segment model of human arteries. Biomedical Signal Processing and Control, 2013, vol. 8(6), p. 509–19.
- Kim, S. H., Neuschwander, T. B., Macias, B. R. et al.: Upper extremity hemodynamics and sensation with backpack loads. Applied Ergonomics, 2014, vol. 45(3), p. 608–12.
- Madhura, M., Sandhya, T.: Effect of short duration aerobic exercise training on reflection index, stiffness index and pulse wave velocity. Indian J Physiol Pharmacol, 2012, vol. 56(1), p. 15–20.
Štítky
BiomedicínaČlánek vyšel v časopise
Lékař a technika

2018 Číslo 4
Nejčtenější v tomto čísle
- GLOBAL CENTERS OF MEDICAL DEVICE TECHNOLOGY: UNITED STATES, EUROPE AND CHINA
- Computer-aided modeling and additive manufacturing fabrication of patient-specific mandibular implant
- Immediate effect of physical on blood flow velocity in radial artery in young adults
- Nanofiber scent carrier
Zvyšte si kvalifikaci online z pohodlí domova
Mazová zátka a její řešení
nový kurzVšechny kurzy