-
Články
- Vzdělávání
- Časopisy
Top články
Nové číslo
- Témata
- Kongresy
- Videa
- Podcasty
Nové podcasty
Reklama- Kariéra
Doporučené pozice
Reklama- Praxe
Selected Genetic Polymorphisms Associated with Hypoxia and Multidrug Resistance in Monoclonal Gammopathies Patients
Vybrané genetické polymorfizmy asociované s hypoxií a multilékovou rezistencí u pacientů s monoklonálními gamapatiemi
Východiska:
Přirozená reakce organizmu na hypoxii je regulována různými mechanizmy a transkripčními faktory, zahrnujícími hypoxií indukovatelné faktory (HIFs). Aktivace HIF-1α je u nádorových buněk spojována se zvýšenou expresí P-glykoproteinu a multilékovou rezistencí. V této retrospektivní analýze jsme sledovali kandidátní jednonukleotidové polymorfizmy (single-nucleotide polymorphisms – SNP) genů HIF-1α a HIF-1β a jejich spojení s rizikem vzniku onemocnění monoklonální gamapatie nejasného významu (monoclonal gammopathy of undetermined significance – MGUS) nebo mnohočetného myelomu (MM).Soubor pacientů a metody:
Genotypy jednonukleotidových polymorfizmů spojovaných s hypoxií byly určovány pomocí real time polymerázové řetězové reakce alelické diskriminace u nezávislé skupiny pacientů s monoklonální gamapatií (MG) (275 pacientů s MM a 228 s MGUS) a u 219 kontrol bez nádorového onemocnění.Výsledky:
Při porovnání pacientů s MM a kontrol jsme pozorovali příznivější vliv genotypu CG genu HIF-1β (rs2228099) oproti genotypu CC (OR 0,65; CI 0,45–0,95; p = 0,026). Obdobně i při zohlednění věku pacientů a jejich indexu tělesné hmotnosti byla signifikantně nižší šance (OR 0,55; p = 0,045) rozvoje onemocnění MM u genotypu CG oproti CC. Log-rank test potvrdil souvislost GT haplotypu (rs11549467, rs2057482) genu HIF-1α s lepším celkovým přežitím (medián 41,8 měsíce; (CI 35,1–48,5) u haplotypu „žádné GT“ a medián 93,8 měsíce (CI 31,3–156,4) u haplotypu „nejméně jeden GT“ (p = 0,0500). Dále byla zjištěna významná souvislost mezi jednonukleotidovými polymorfizmy v genu MDR1 a léčebným účinkem u 110 pacientů s MM léčených bortezomibem.Závěr:
Naše studie ukázala možnou genetickou predispozici k riziku rozvoje MG a/nebo k léčebné odpovědi pacientů s MM, nicméně je třeba provést další studie k potvrzení naší počáteční analýzy.Klíčová slova:
mnohočetný myelom – hypoxie – genotype – polymorfizmus – qPCRTato práce byla podpořena projektem MZ ČR FNBr, 65269705.
Autoři deklarují, že v souvislosti s předmětem nemají žádné komerční zájmy.
Redakční rada potvrzuje, že rukopis práce splnil ICMJE kritéria pro publikace zasílané do biomedicínských časopisů.
Obdrženo: 19. 3. 2018
Přijato: 24. 4. 2018
Authors: Almasi Martina 1; Besse Lenka 2; Brozova Lucie 3; Jarkovsky Jiri 3; Bezdekova Renata 1; Pour Ludek 4; Minarik Jiri 5; Kessler Petr 6; Pavlicek Petr 7; Roziakova Lubica 8; Penka Miroslav 1; Hájek Roman 1,9; Vasku Anna 10; Sevcikova Sabina 1,11
Authors place of work: Department of Clinical Hematology, University Hospital Brno, Brno, Czech Republic 1; Department of Oncology and Hematology, Cantonal Hospital St. Gallen, Switzerland 2; Institute of Biostatistics and Analyses, Faculty of Medicine, Masaryk University, Brno, Czech Republic 3; Department of Internal Medicine, Hematology and Oncology, University Hospital Brno and Faculty of Medicine Masaryk University, Brno, Czech Republic 5 Department of Hematooncology, University Hospital Olomouc and Faculty of Medicine and Dentistry, Palacky 4; Department of Hematology and Transfusion Medicine, Hospital Pelhrimov, Pelhřimov, Czech Republic 6; Department for Internal Medicine and Haematology, 3rd Faculty of Medicine, Charles University in Prague and Faculty Hospital Kralovske Vinohrady, Prague, Czech Republic 7; Department of Hematology and Transfusion Medicine, University Hospital, School of Medicine, Comenius University Bratislava, Slovak Republic 8; Department of Hematooncology, University Hospital Ostrava, Ostrava, Czech Republic 9; Department of Pathological Physiology, Faculty of Medicine, Masaryk University, Brno, Czech Republic 10; Babak Myeloma Group, Department of Pathological Physiology, Faculty of Medicine, Masaryk University, Brno, Czech Republic 11
Published in the journal: Klin Onkol 2018; 31(3): 213-229
Category: Původní práce
doi: https://doi.org/10.14735/amko2018213Summary
Background:
Adaptive response to hypoxia is regulated by several mechanisms and transcription factors, including hypoxia-inducible factors (HIFs). Activation of HIF-1α is associated with increased expression of P-glycoprotein and multidrug resistance in cancer cells. In this retrospective study, we analyzed candidate single-nucleotide polymorphisms (SNPs) in HIF-1α and HIF-1β associated with risk of monoclonal gammopathy of undetermined significance (MGUS) or multiple myeloma (MM).Patients and Methods:
Genotypes of SNPs associated with hypoxia were determined in an independent cohort of monoclonal gammopathies (MG) (275 MM and 228 MGUS patients) and in 219 cancer-free controls by real time polymerase chain reaction allelic discrimination.Results:
When MM patients were compared to controls, protective role of CG genotype compared to CC in HIF-1β (rs2228099) for MM development was observed (OR = 0.65; CI 0.45–0.95; p = 0.026). Even after adjustment for patients’ age and body mass index (BMI), there were significantly lower odds (OR = 0.55; p = 0.045) of developing MM patients of CG genotype in comparison to CC genotype. Log-rank test confirmed association of GT haplotype (rs11549467, rs2057482) in HIF-1α with better overall survival (median 41.8 months; (CI 35.1–48.5)) for “none GT” and median 93.8 months (CI 31.3–156.4) for “at least one GT” haplotype (p = 0.0500). Further, significant associations between SNPs in MDR1 and outcome of MM were found in 110 MM patients that underwent bortezomib-based treatment.Conclusion:
Our study showed a genetic predisposition for risk of MG development and/or outcome of MM patients; nevertheless, further studies are needed to confirm our initial analysis.Key words:
multiple myeloma – hypoxia – genotype – polymorphism – qPCRIntroduction
Monoclonal gammopathies (MG) are a group of disorders characterized by proliferation of malignant monoclonal plasma cells (PCs) [1]. Multiple myeloma (MM) is a clonal PCs malignancy that accounts for more than 10% of malignant hematologic disorders [2]. MM is further characterized by presence of clonal PCs in the bone marrow (BM), monoclonal immunoglobulin (mIg, M-protein) in serum and/or urine and presence of other clinical symptoms, such as hypercalcemia (C), renal insufficiency (R), anemia (A) and bone involvement (B), commonly known as CRAB symptoms [3]. While the introduction of novel drugs, such as proteasome inhibitors (PIs) and immunomodulatory drugs (IMiDs), has improved clinical response of MM patients, MM remains a hard-to-treat disease. MM is always preceded by precancerosis monoclonal gammopathy of undetermined significance (MGUS). MGUS is defined by serum M protein level lower than 3 g/dL, less than 10% of clonal PCs in the BM, and absence of end-organ damage [4].
Hypoxia is a common feature in cancer affecting important biological properties of tumor cells. Among others, it activates hypoxia-inducible transcription factors (HIFs) that play an important role in MM biology. HIFs are heterodimers consisting of labile HIF-α subunits (HIF-1α, HIF-2α or HIF-3α) and a constitutive HIF-1β subunit (also known as aryl hydrocarbon receptor nuclear translocator or ARNT) [5]. In hypoxia, HIF-1β binds HIF-1α, preventing proteasomal degradation. The complex is transported to the nucleus where it binds hypoxia-responsive elements (HREs). This way, HIFs activate genes associated with angiogenesis, osteoclast recruitment and activation, cell-cycle regulation, moreover, they also cause disease progression into active symptomatic MM [6]. Hypoxia is a critical factor in MM as interactions between MM PCs and the microenvironment play a crucial role in MM progression, dissemination, angiogenesis and drug resistance. Moreover, cancer stem cell (CSC) phenotype is a plastic state induced in cancer cells depending upon microenvironmental signals, such as hypoxia [7]. As HIF-1α protein is highly expressed in MM cells and involved in BM angiogenesis [8], it could serve as a potential therapeutic target. In fact, the HIF-1 family is expressed in response to acute hypoxia, while HIF-2 family is expressed in response to chronic lack of oxygen [9]. Both HIFs and vascular endothelial growth factor (VEGF) are up-regulated in MM patients, strongly related to each other and linked to increased angiogenesis [10]. These findings indicate that targeting HIFs and the VEGF/receptor autocrine loop may be important in MM treatment. Furthermore, a number of studies concluded that HIF-1α inhibition may be a novel therapeutic strategy for MM treatment [11–15]. Activation of HIF-1α is associated with increased expression of P-glycoprotein and multidrug resistance in cancer cells as was described in breast cancer and non-small cell lung carcinoma [16,17]. Indeed, key players in multidrug resistance are P-glycoprotein, the best-characterized drug efflux transporter system encoded by MDR-1 (also known as ABCB1), and multiple drug resistance protein-1 encoded by MRP-1 (also known as ABCC1). In tumor cells, high expression of P-glycoprotein decreases the effect of chemotherapy [18].
MM is a heterogeneous disease not only with respect to tumor PCs and BM microenvironment, but also regarding genetic variability of each individual patient, which can significantly affect a patient’s outcome. Several familial studies support the hypothesis of a genetic predisposition for developing MG [19–24]. Evidence for inherited genetic susceptibility is provided by the two-fold increased risk of the disease observed in first-degree relatives of MM patients [25].
Therefore, in our retrospective study, we analyzed genetic variability in genes associated with hypoxia. We analyzed candidate single-nucleotide polymorp-hisms (SNPs) in HIF-1α (rs11 549467 and rs2057482) and HIF-1β (rs2228099) associated with risk of MGUS or MM. Consequently, we evaluated assoc-iation of SNPs in HIF-1α, HIF-1β, three SNPs and their haplotypes in MDR1 (rs1045642, rs2032582 and rs1128503) and one in MRP1 (rs4148356) with outcome of MM patients.
Material and methods
Clinical samples and studied polymorphisms
Altogether, 228 MGUS patients, 275 MM patients and 219 age-matched cancer-free controls were included in the hy-poxia study. Two potentially functional polymorphisms in HIF-1α (rs11549467, rs2057482) and one in HIF-1β (rs22 28099) were genotyped and their association with MGUS and MM risk in a case-control study was assessed. Peripheral blood (PB) samples from all patients were obtained from centers of the Czech Myeloma Group – University Hospital Brno, Faculty Hospital Kralovske Vinohrady Praha, University Hospital Olomouc, University Hospital Ostrava and Hospital Pelhrimov, Czech Republic and from University Hospital Bratislava, Slovak Republic. As a control group, cancer-free cases from the University Hospital Brno were used. Basic characteristics of MGUS and MM patients as well as controls are described in Tab. 1, and clinical characteristics of MGUS and MM patients are summarized in Tab. 2. Further, association of three SNPs and their haplotypes in MDR1 (rs1045642, rs2032582 and rs1128503) and in MRP1 (rs4148356) was evaluated with outcome in MM patients. In total, 110 MM patients that underwent bortezomib-based treatment (cyclophosphamide, bortezomib, dexamethasone – CVD regimen) were included in the evaluation of pharmacogenetic association with clinical outcome. Clinical characteristics of MM patients at the start of CVD treatment (n = 110) are shown in Table 3.
Tab. 1. Basic characteristics of MGUS and MM patients in comparison to controls (n = 722). 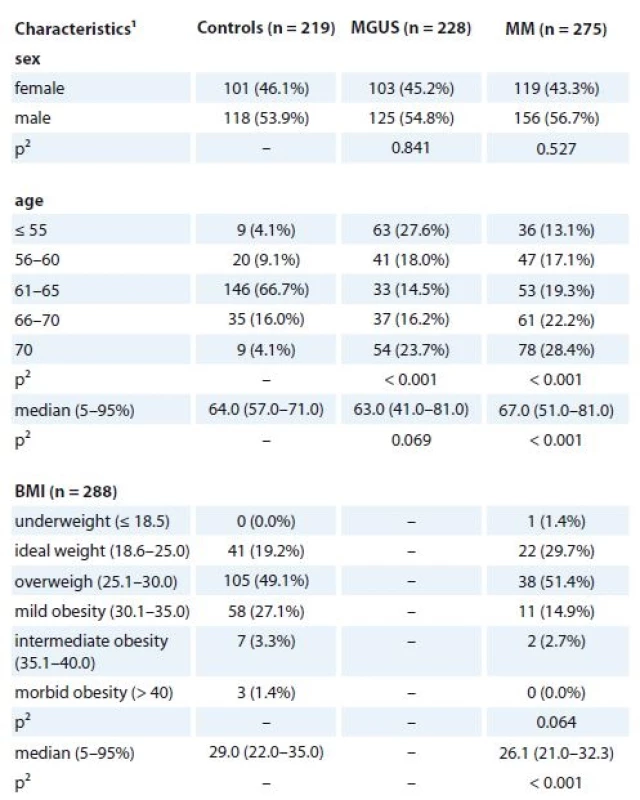
MGUS – monoclonal gammopathy of undetermined significance, MM – multiple myeloma
1absolute and relative frequency for categorical variable; median, percentiles (5–95%) for continuous variable ,
2 p-values marked with bold are statistically significant; ML Chi square test or Mann-Whitney U test were used for comparison with the control groupTab. 2. Clinical characteristics of MGUS and MM patients at diagnosis (n = 722). 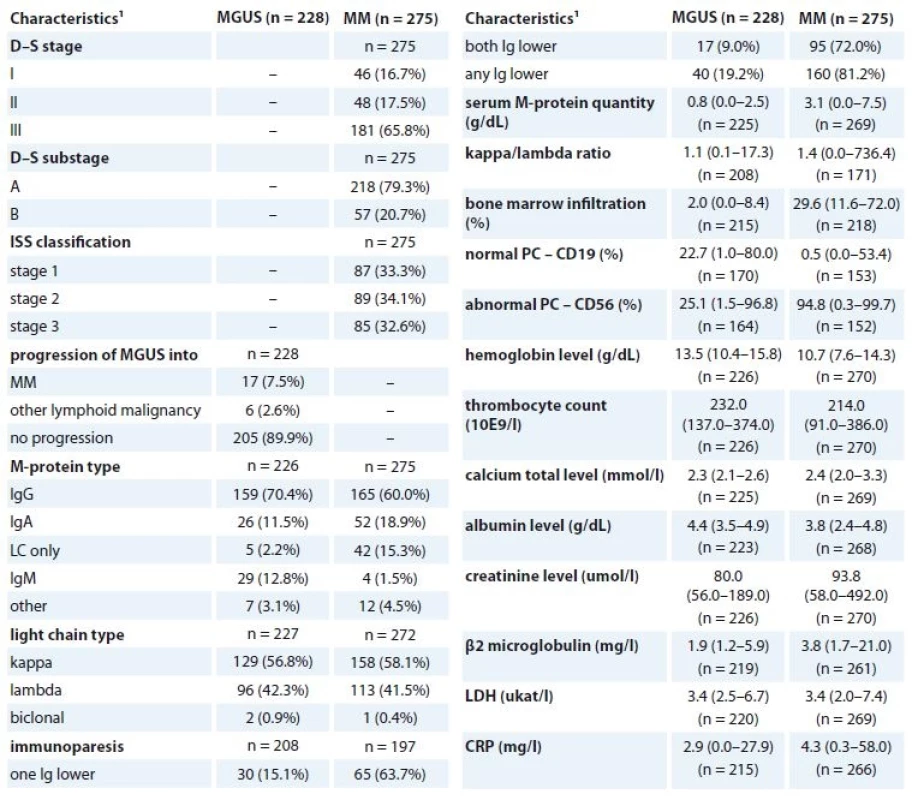
MGUS – monoclonal gammopathy of undetermined significance, MM – multiple myeloma, LDH – lactate dehydrogenase, CRP – C-reactive protein
1 absolute and relative frequency for categorical variable; median, percentiles (5–95%) for continuous variableTab. 3. Clinical characteristics of MM patients at the beginning of CVD treatment regimen (n = 110). 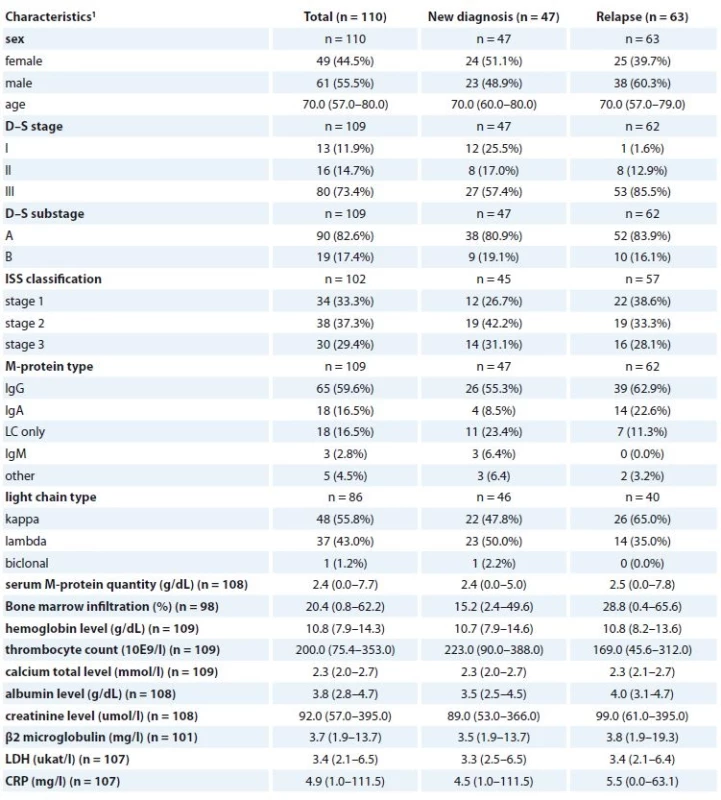
MM – multiple myeloma, CVD – cyclophosphamide, bortezomib, dexamethasone regiment, LDH – lactate dehydrogenase, CRP – C-reactive protein
1 absolute and relative frequency for categorical variable; median, percentiles (5–95%) for continuous variableAll patients were enrolled into the study only after signing the informed consent form approved by the Ethics committees of the hospitals in accordance with the current version of the Helsinki Declaration.
SNPs analyses
Genomic DNA (gDNA) was isolated from whole PB using MagNA Pure DNA Isolator (Roche, Switzerland) and its concentration was measured by Nanodrop ND-1000 (Thermo Fisher Scientific, MA, USA). For gene polymorphisms analyses in HIF-1α (rs11549467, ID: C_34492744_10; rs2057482, ID: C_8549084_20), HIF-1β (rs2228099, ID: C_11846736_20), MDR1 (rs1045642, ID: C_7586657_20; rs2032582, ID: C_11711720D_40 and C_11711720C_30; rs1128503, ID: C_7586662_10), and MRP1 (rs4148356, ID: C_25614385_20), quantitative polymerase chain reaction (qPCR) for allelic discrimination was performed. Standard TaqMan genotyping assays were used run on Step-One Real-Time PCR instrument (Applied Biosystems, CA, USA) as previously described [26]. In brief, qPCR was performed in 10 µL reactions containing 10 ng of gDNA, 0.5 µL of TaqMan Genotyping Assay Mix and 8 µL of PCR master mix (all Applied Biosystems, CA, USA).
Statistical analyses
According to the position of SNPs on chromosome, haplotypes were derived as rs11549467, rs2057482 for the HIF-1α and in order as rs1045642, rs2032582, rs1128503 for MDR1. Haplotypes were inferred in the PHASE software, ver. 2.1 [27,28]. The default setting was left and the “-x15” was added to provide 15 repetitions of algorithm and choice of the best one. To test the Hardy-Weinberg equilibrium and linkage disequilibrium, the package “genetics” in R software was used [29].
Basic characteristics were described by absolute and relative frequencies for categorical variables and median (5–95 percentile) for continuous variable. Comparison between groups was performed using Maximal-Likelihood Chi-square test in case of categorical variables and Mann-Whitney U test in case of continuous variable. Association of marker with status control vs. MGUS or control vs. MM was expressed by odds ratio (OR) with 95% confidence interval (CI) and p-value of Wald‘s test. The most frequent genotypes/haplotypes for the control group were set as reference. Significant associations were adjusted by age and body mass index (BMI) as next predictors in multiple logistic regression. Association of marker with treatment intervals was evaluated using Cox proportional hazards model. When mentioned, overall survival (OS), time to progression (TTP), progression free survival (PFS) were assessed within 2 years after diagnosis/treatment beginning; events after this period were set as censored. Kaplan-Meier curves were plotted for significant associations. Log-rank test was used to evaluate the statistical significance of difference between the curves. P-values less than 0.05 were considered statistically significant.
Joint prediction of MDR1 and HIF-1α was evaluated using multivariate Cox proportional hazards model with treatment intervals as the dependent and all genetic markers as independent variable. Receiver operating characteristic (ROC) analysis was performed with the binary endpoint from OS, TTP and PFS. The results include sensitivity and specificity values with p-value for the area under the curve (AUC).
Analysis was performed in the SPSS software (IBM Corp. Released 2013. IBM SPSS Statistics for Windows, Version 22.0. Armonk, NY: IBM Corp.). Hardy-Weinberg equilibrium and linkage disequilibrium were tested in R software (http: //www.r-project.org/).
Results
SNPs in HIF-1α and HIF-1β
Genotypes of SNPs associated with hypoxia (HIFs) were determined in an independent cohort of 722 samples (219 cancer-free controls, 228 MGUS and 275 MM patients).
All observed genotype frequencies in controls (n = 219) conformed to the Hardy-Weinberg equilibrium (p = 0.304, 0.080 and 0.284 for rs2228099, rs1154 9467 and rs2057482, resp.). Linkage disequilibrium analysis between the two SNPs (n = 722; D‘=0.970, r2 = –0.053; p = 0.043 for rs11541467 vs. rs2057482) was confirmed as well. Genotype and haplotype frequencies were compared between MM and MGUS cases and controls. Frequencies of all polymorphisms in the entire cohort (n = 722) are presented in supplementary tables (Supplementary tab. 1).
Evaluation of MM patients vs. controls showed a statistically lower frequency of CG genotype in HIF-1β (rs2228099) in MM (40.0% in MM vs. 49.3% in controls; OR 0.65; 95% CI 0.45–0.95; p = 0.026) in comparison to the CC genotype. Even after adjustment for patients’ age and BMI, there were significantly lower odds (OR 0.55; 95% CI 0.30–0.99; p = 0.045) for MM development in patients with CG genotype in comparison to CC genotype. Further, significant results were observed also after recoding into CC vs. CG + GG genotype not adjusted for age and BMI (50.5% in MM vs. 60.3% in controls; OR 0.67; 95% CI 0.47–0.97; p = 0.031) and adjusted for age and BMI (OR 0.54; 95% CI 0.31–0.95; p = 0.032) (Table 4). However, we did not observe any significant associations for SNPs in HIF-1α.
Tab. 4. Univariate and adjusted (age and BMI) association of rs2228099 (HIF-1β) with MM and control status. 
MM – multiple myeloma
1 described by absolute and relative frequencies
p-values marked in bold are statistically significantFurther, significant association of SNP in HIF-1β (rs2228099) in MM patients vs. controls for the BMI status ≥ 25 kg/m2 (p = 0.018 for CC vs. CG vs. GG genotype; p = 0.025 for CC vs. CG + GG genotype) was observed (Tab. 5).
Tab. 5. Association of rs2228099 (HIF-1β) with MM and control status separately for BMI categories (< / ≥ 25 kg/m2). 
MM – multiple myeloma
1 described by absolute and relative frequencies
2 p values marked in bold are statistically significant; obtained by ML Chi-square testAssociation between genotypes/haplotypes and risk group of MGUS patients
MGUS patients with available clinical parameters (n = 205) were divided into four groups according to the previously described Mayo Clinic risk stratification model [30] as follows low risk (n = 74), low-intermediate risk (n = 76), high-intermediate risk (n = 46) and high risk (n = 6). Association between genotypes/haplotypes and risk group was evaluated. For SNP genotype rs2057482 (HIF-1α) and HIF-1α haplotype (rs11549467 and rs2057482), significant association with risk group was observed. When the risk groups were aggregated into “low risk” vs. “none-low risk”, higher odds of “none-low risk” category for CT genotype of rs2057482 in HIF-1α was observed (OR 2.48; 95% CI 1.15–5.35; p = 0.021) in comparison to CC genotype. Further, comparison of “low risk” vs. “none-low risk” categories of MGUS showed higher odds of “none-low risk” category for “at least one GT” haplotype in comparison to “none GT” (OR 2.62; 95% CI 1.22–5.63; p = 0.014). Next, higher odds of “none-low risk” category for GC/GT haplotype was observed in comparison to GC/GC haplotype (OR 2.40; 95% CI 1.10–5.21; p = 0.027) (Tab. 6). However, there was no association between such haplotypes and time to progression from MGUS into MM.
Supplementary tab. 1. Frequencies for the polymorphisms and haplotypes in studied groups (n = 722). 
MGUS – monoclonal gammopathy of undeterminated significance, MM – multiple myeloma
1 described by absolute and relative frequenciesTab. 6. Association of the SNPs (HIF-1α) and the risk stratifi cation of MGUS patients according to MAYO model (n = 205). 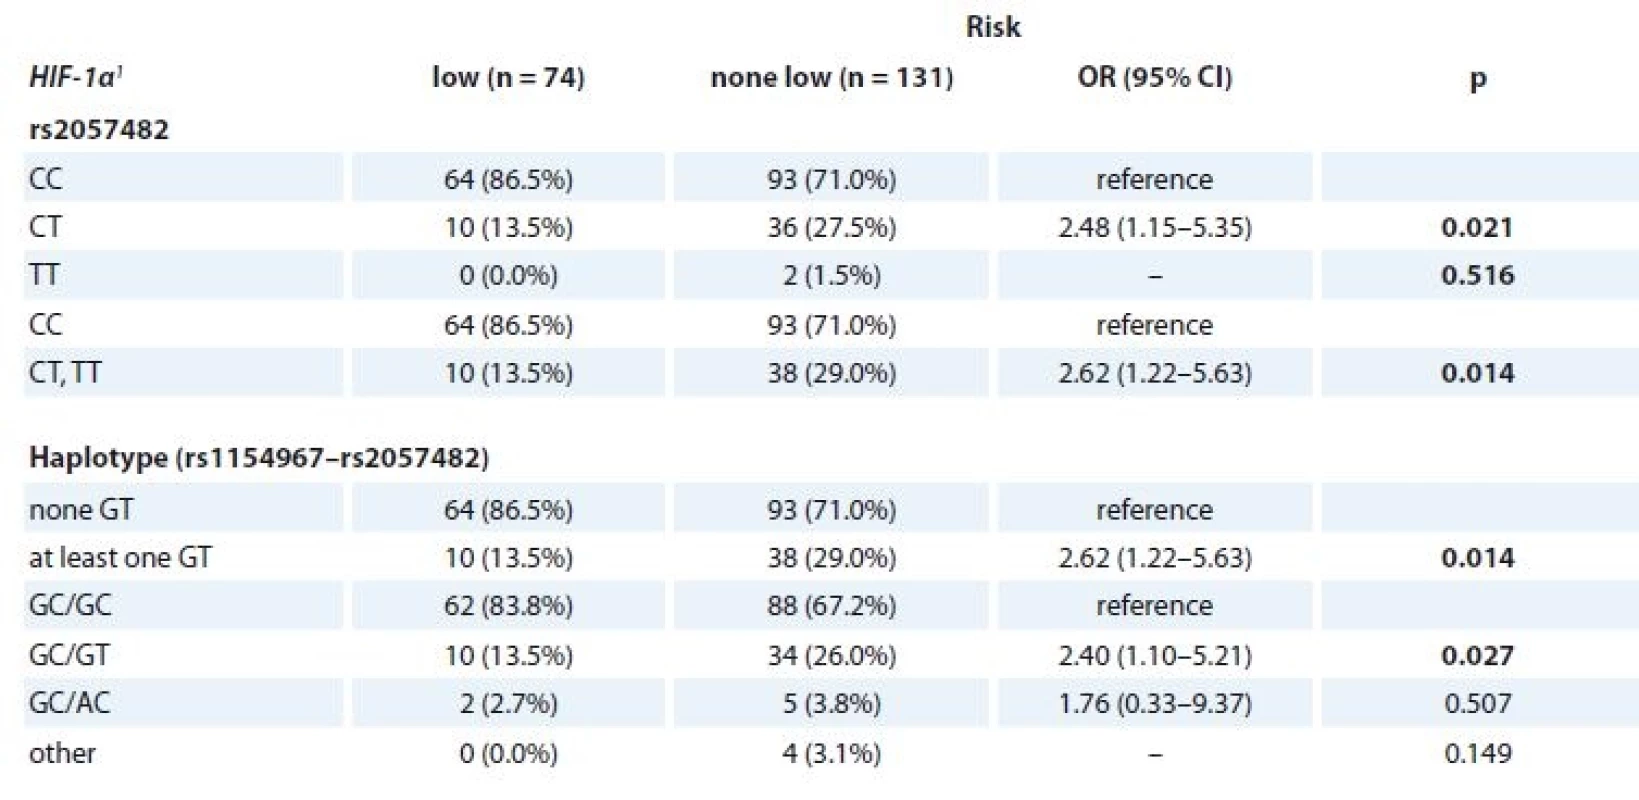
SNPs – single-nucleotide polymorphisms, MGUS – monoclonal gammopathy of undetermined significance
1 described by absolute and relative frequencies
p-values marked in bold are statistically significantAssociation of SNP in HIF-1α and HIF-1β with progression and survival
Additionally, for MM patients, association between SNPs in HIF-1α and HIF-1β and OS or length of the treatment response were evaluated. No significant association between stud-ied SNPs and length of treatment response was observed; however, rs2057482 SNP in HIF-1α and HIF-1α haplotype (rs11549467 and rs2057482) were associated with better OS specifically in rs2057482 CT genotype (p = 0.073); in rs11549467 and rs2057482 combination – “at least one GT haplotype” (p = 0.052), “once GT haplotype” (p = 0.073), GC/GT haplotype (p = 0.062) (Tab. 7). Log-rank test confirmed association of GT haplotype (rs11549467 and rs2057482) with better OS with median of 41.8 months (95% CI 35.1–48.5) for “none GT” and median of 93.8 months (95% CI 31.3–156.4) for “at least one GT haplotype” (p = 0.050) (Fig. 1).
Tab. 7. Cox regression model for overall survival from diagnosis for MM patients (n = 275). 
MM – multiple myeloma Fig. 1. Overall survival for GT haplotype rs11549467 and rs2057482 (HIF-1α) – “none GT” vs. “at least one GT” (n = 275) (10-year interval visualized). 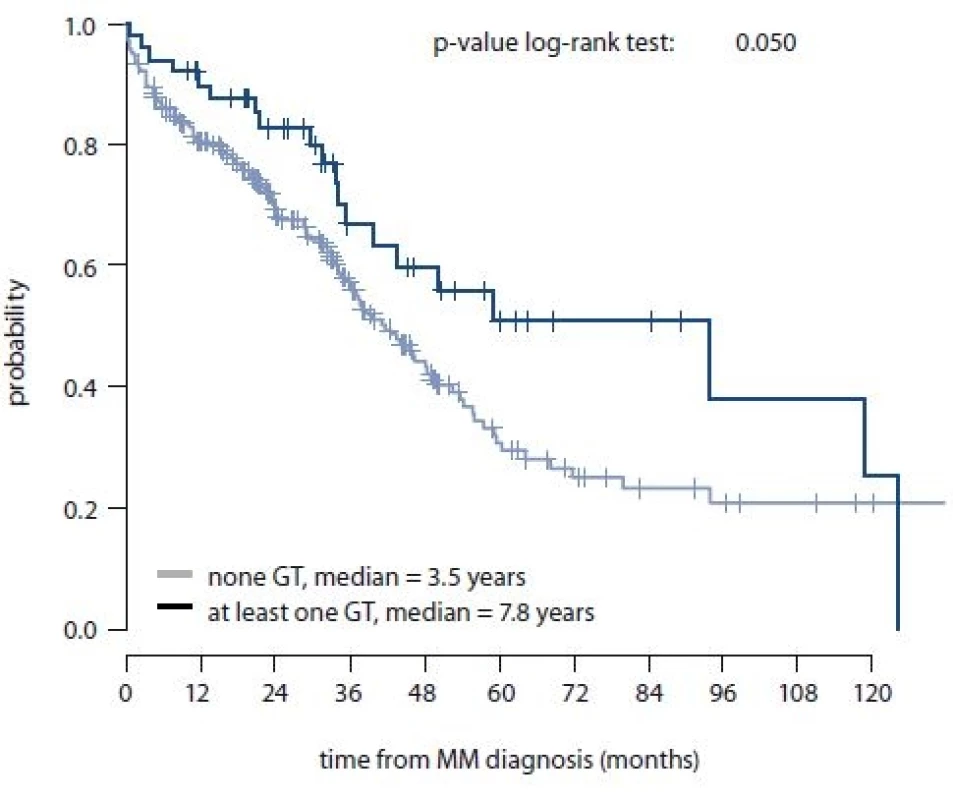
MM – multiple myeloma Predictive value of polymorphisms associated with hypoxia and multidrug resistance in CVD treated MM patients
For this part of study, 110 MM patients treated with CVD regimen were included; all samples were collected prior to CVD treatment (Tab. 3). Association of three SNPs and their haplotypes in MDR1 (rs1045642, rs2032582 and rs11203), one in MRP1 (rs4148356), two in HIF-1α (rs11549467, rs2057482) and one in HIF-1β (rs2228099) with MM patient’s outcome was evaluated.
Survival cut-off points were esta-blished based on time-dependent ROC analysis (data not shown), which showed suitable AUC for 2-year time period for outcome evaluation; the 2-year treatment intervals (OS, TTP, and PFS) were evaluated from the beginning of CVD treatment. Further, linkage disequilibrium analysis was performed also between three MDR1 SNPs (n = 110; D‘ = 0.829, r2 = 0.663; p < 0.001 for rs1045642 and rs2032582; D‘=0.741, r2 = –0.561; p < 0.001 for rs1045642 and rs1128503; D‘ = 0.918, r2 = –0.870; p<0.001 for rs2032582 and rs1128503). Frequencies for significant haplotypes of MDR1 for patients treated with CVD treatment regimen (n = 110) are presented in Supplementary tab. 2. Since MDR1 locus (rs2032582) has three alleles, the A and T allele were combined as W, so that this locus could be treated as two alleles.
Using multivariate Cox regression model with 2-year TTP as dependent variable and all SNPs in HIF-1β, HIF-1α (haplotype), MRP1, MDR1 (haplotype) as predictors, only haplotypes of MDR1 reached p-value lower than 0.1 (specifically “at least one CWC” with p-value 0.022 and “at least one TGT” with p-value 0.068). In case of OS and PFS, p-values lower than 0.1 were not observed.
In the univariate analysis, significant association with 2-year OS, TTP and PFS was observed for these haplotypes of three SNPs in MDR1 (rs1045642, rs2032582 and rs1128503) – TGT/CGT vs. other, “at least one CWC” vs. “none CWC” and “at least one TGT” vs. “none TGT”. All of the analyses were performed together and separately for the categories of newly diagnosed MM (n = 47) and relapsed MM patients (n = 63) and all of the significant associations are depicted in Tab. 8. Kaplan-Meier curves for the haplotypes of three SNPs in MDR1 that reached significance in Cox regression model are shown in Fig. 2a, b, c.
Tab. 8. Cox regression model for 2-year OS, TTP and PFS (n = 110). 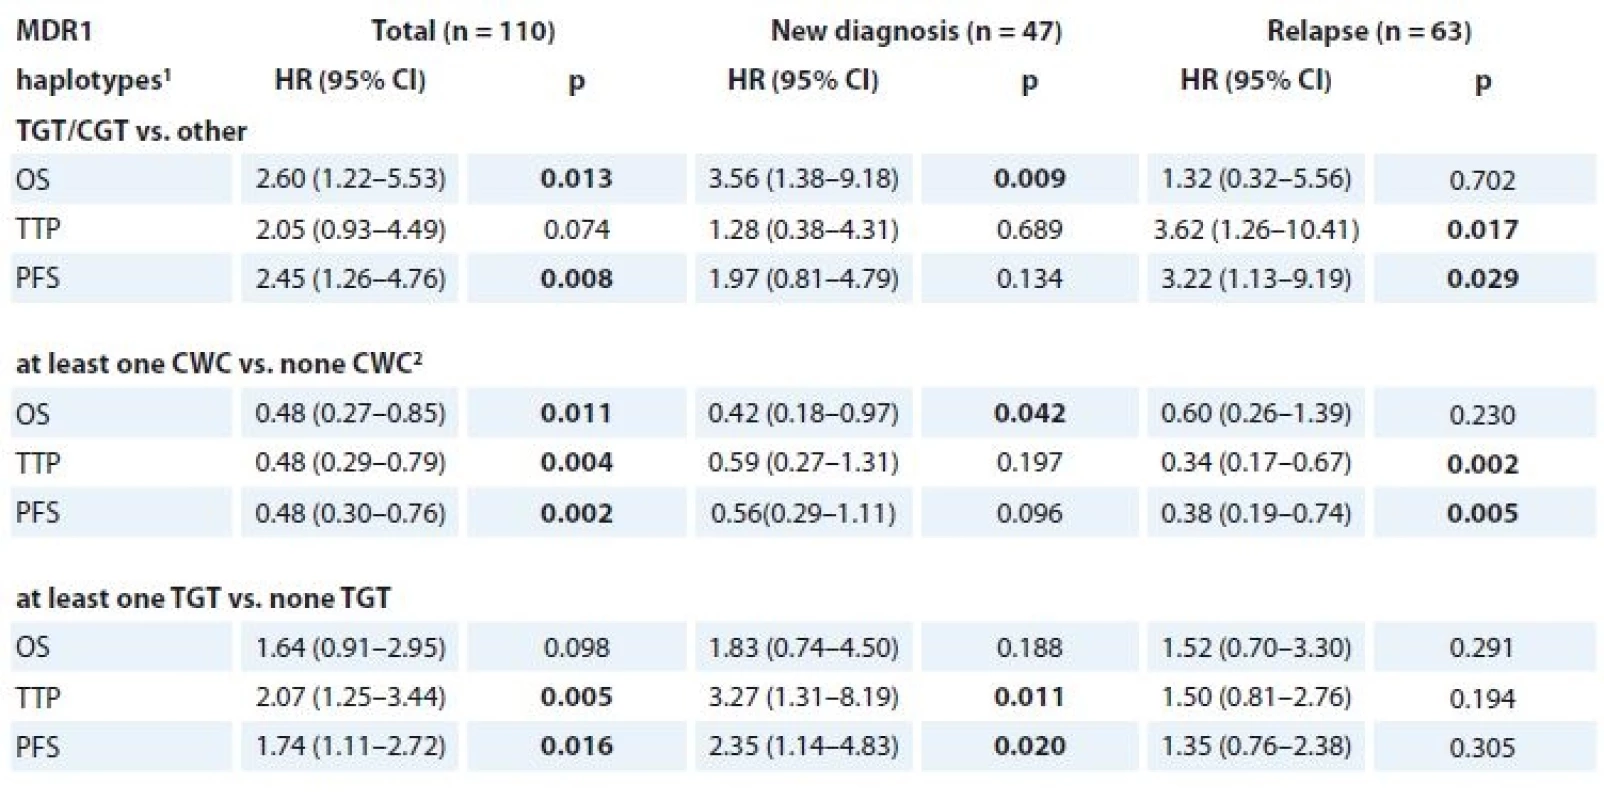
OS – overall survival, TTP – time to progression, PFS – progression free survival
1 for rs1045642, rs2032582 and rs1128503
2 allele W summarises allele A or T
p-values marked in bold are statistically significantFig. 2a. Kaplan-Meier curves for the TGT/CGT haplotype rs1045642, rs2032582 and rs1128503 (MDR1) which reached significance in Cox regression model. 
Fig. 2b. Kaplan-Meier curves for the at least one CWC haplotype rs1045642, rs2032582 and rs1128503 (MDR1) which reached significance in Cox regression model. 
Fig. 2c. Kaplan-Meier curves for the at least one TGT haplotype rs1045642, rs2032582 and rs1128503 (MDR1) which reached significance in Cox regression model. 
In newly diagnosed MM patients, there was a significantly worse 2-year OS for TGT/CGT (median 5.8 months; 95% CI 2.8–8.9) compared to other haplotypes (median 34.6 months; 95% CI 11.7–57.5; HR 3.56; 95% CI 1.38–9.18; p = 0.009) (Fig. 2a). Further, in relapsed MM patients with haplotype TGT/CGT, significantly worse 2-year TTP was achieved (median 2.8 months; 95% CI 0.0–8.9) in comparison to other haplotypes (11.2 months; 95% CI = 8.6–13.7; HR 3.62; 95% CI 1.26–10.41; p = 0.017). Similarly, for this haplotype, shorter PFS was observed (median 2.8 months; 95% CI 0.0–8.9) in comparison with other haplotypes (median 10.7 months; 95% CI 8.5–12.9; HR 3.22; 95% CI 1.13–9.19; p = 0.029). Using 2-year time-dependent ROC analysis, the “at least one TGT” haplotype within newly diagnosed MM reached significance in TTP and PFS (data shown in Tab. 9).
Supplementary tab. 2. Frequencies for the polymorphisms and haplotypes in MM patients with CVD treatment regimen (n = 110). 
MM – multiple myeloma, CVD – cyclophosphamide, bortezomib, dexamethasone regiment
1 described by absolute and relative frequencies, 2 allele W summarises allele A or TTab. 9. TGT haplotype (MDR1) in association with 2-year binary endpoints 1. death, 2. progression or death related to diagnosis, 3. progression or death (not only MM). 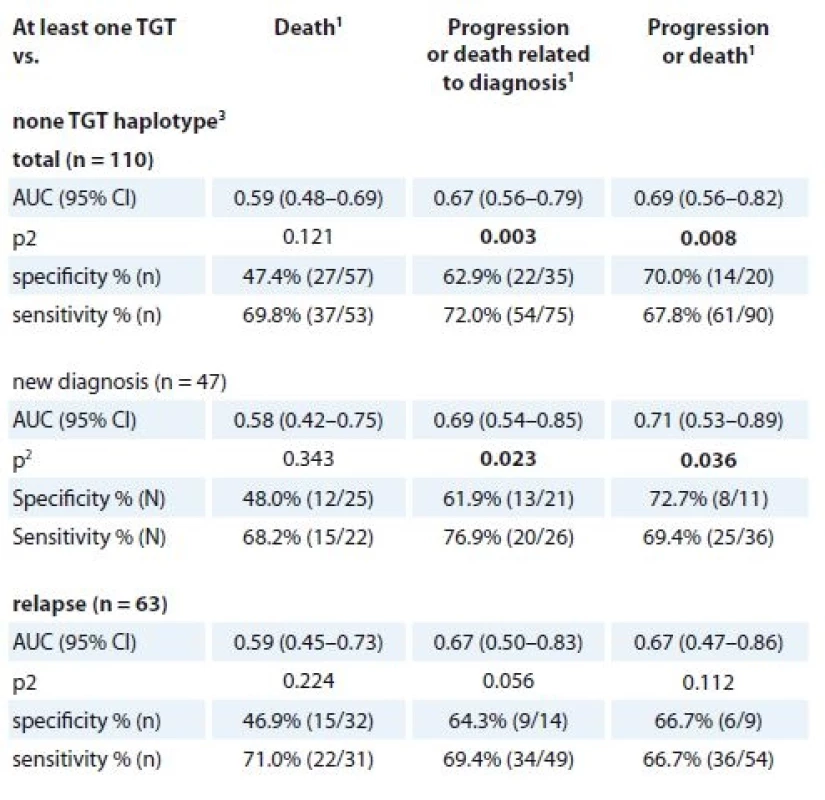
MM – multiple myeloma
1 events evaluated during first two years from the beginning of the treatment
2 p-value of AUC (area under the curve), p values marked in bold are statistically significant
3 for rs1045642, rs2032582 and rs1128503The opposite association with survival was observed for CWC haplotype, as the “at least one CWC” compared to “none CWC” haplotype showed significantly better 2-year OS for newly diagnosed MM patients (median 34.6 months; 95% CI 18.0–51.1) vs. 13.3 months; 95% CI 6.7–19.8; HR 0.42; 95% CI 0.18–0.97; p = 0.042). “At least one CWC” compared to “none CWC” also showed significantly better 2-year TTP (median 12.6 months; 95% CI 10.1–15.1; vs. 7.3 months; 95% CI 5.6–9.0; HR 0.34; 95% CI 0.17–0.67; p = 0.002) and 2-year PFS (median 11.3 months; 95% CI 8.6–13.9 vs. 7.3 months; 95% CI 5.6–9.0; HR 0.38; 95% CI 0.19–0.74; p = 0.005) in relapsed MM patients. (Figure 2b). For newly diagnosed MM patients, “at least one TGT” compared with “none TGT” haplotype was associated with significantly worse TPP (median 7.6 months; 95% CI 0.2–15.0 vs. 27.6 months; 95% CI 15.6–NA; HR 3.27; 95% CI 1.31–8.19; p = 0.011) and PFS (median 6.4 months; 95% CI 3.8–9.1 vs. 12.9 months 95% CI 4.7–21.2; HR 2.35; 95% CI 1.14–4.83; p = 0.020) (Figure 2c).
Further, the differences in clinical parameters between the cohorts of patients with different haplotypes in a group of patients treated with CVD regimen were evaluated. The “at least one CWC” haplotype compared to “none CWC” haplotype in relapsed MM is associated with lower level of calcium (median 2.3 mmol/L; 95% CI 2.1–2.7 vs. 2.5 mmol/L 95% CI 2.2–3.6; p = 0.045). Then, “at least one TGT” haplotype compared to “none TGT” haplotype is associated with worse D–S stadium in newly diagnosed MM (p = 0.015) and also “at least one TGT” haplotype compared to “none TGT” haplotype is associated with higher levels of creatinine (median 113.0 umol/L; 95% CI 64.0–447.0 vs. median 85.0; 95% CI 60.0–170.0; p = 0.020), B2M (median 4.4 mg/L; 95% CI 1.9–19.7 vs. median 2.9; 95% CI 1.9–7.5] p = 0.013) and cytological percentage of BM infiltration by pathological PCs (median 29.6; 95% CI 0.4–72.8 vs. median 20.2; 95% CI 0.0–58.4; p = 0.071) in relapsed MM.
Discussion
Observations from genome-wide association studies in MM [31], Hodgkin’s lymphoma [32] and chronic lymphocytic leukemia [33] suggested that genetically determined dysregulation of protooncogenes (such as MYC) may be a common mechanism underlying predisposition to hematological malignancies of the B-cell lineage. Soon after, it was elucidated that not only loci in protooncogenes, but also in other genes or parts of chromosome, such as 3p22.1 (rs1052501 in ULK4), 7p15.3 (rs4487645) and 2p23.3 (rs67 46082), are associated with risk of MM, although the last one did not reach genome-wide significance [31]. The association between 3p22.1 (rs1052501) and MM was further validated and its association with MGUS was found as well [34]. Other observations led to identification of MM risk loci at 3q26.2 (rs10936599), 6p21.33 (rs2285803, PSORS1C2), 17p11.2 (rs4273077, TNFR SF13B) and 22q13.1 (rs877529, CBX7) and provided further evidence for genetic susceptibility to MM [35].
So far, many studies assessed association between polymorphisms in genes associated with hypoxia and cancer risk. Therefore, in this study, we focused on genetic variations in such genes and their effects on the risk of development of monoclonal gammopathy. The most commonly investigated polymorphism associated with hypoxia is C1772T (rs11549465), followed by G1790A (rs11549467), C111A and c*191T > C (rs2057482) in HIF-1α [36]. C1772T (rs11549465) and G1790A (rs11549467) polymorphisms were previously associated with susceptibility to develop pancreatic cancer [37,38]. G1790A (rs11549467) polymorphism alone is associated with an increase in tumor-produced HIF-1α and in cancer progression [38]. Further, for C1772T (rs11549465) polymorphism, T allele was significantly associated with increased cancer risk. For G1790A (rs11549467), genotype results showed that it is significantly associated with cancers [39]. Unfortunately, in our study, we did not observe any association between these polymorphisms in HIF-1a and MM development. However, for c*191T > C (rs2057482) genotype in HIF-1α and HIF-1α haplotype (rs11549467, rs2057482), we observed a significant association with higher MGUS risk group, as defined by the MAYO model. Although a previous large meta-analysis showed significant association between HIF-1α C1772T (rs11549465) and G1790A (rs11549467), but not c*191T > C (rs2057482) polymorphism with increased risk of cancer [36], it can be still hypothesized that c*191T > C (rs2057482) in HIF-1α is associated with progression of MG, as it had been observed to contribute to risk of cervical cancer in a Chinese population [40]. Furthermore, c*191T > C (rs2057482) polymorphism is located in 3’UTR region of HIF-1α, which contains regulatory regions that post-transcriptionally influence gene expression, such as binding sites for regulatory proteins and microRNA [41]. Thus, we hypothesized that not only sequence changes, but also impaired regulation of HIF-1α expression is involved in susceptibility to MGUS transformation.
Moreover, our results suggest that genotype variation of rs2228099 polymorphism in HIF-1β is associated with increased risk of MM. Our data support the hypothesis of protective effect of the G allele in this SNP in MM development. Further, this polymorphism is significantly associated with MM development in a group of obese MM patients. Indeed, the number of cancer cases caused by obesity is estimated to be 20% with increased risk of malignancies influenced by diet, weight change and body fat distribution together with physical activity [42]. Insulin-like growth factor I (IGF-I) produced in adipose tissue induces synthesis of HIF-1a [43], which together with VEGF leads to neovascularization and metastases, as was shown in a colon cancer model [44]. Interestingly, body build or nutritional status may be also involved in the development of MM by various mechanisms that still need to be elucidated [45–54].
In the second part of our study, we focused on polymorphisms in MRP1 (R723Q, rs4148356), a gene for multiple drug resistance protein, and MDR1 (3435C > T, rs1045642; 2677G > W, rs2032582 and 1236C > T, rs1128503) encoding P-glycoprotein. There was no significant association between SNP in MRP1 and patients outcome, which is in discordance with other observations that showed significant association with SNP in MRP1 (rs4148356) and time to event in 279 patients with relapsed and/or refractory disease treated with bortezomib or bortezomib with pegylated liposomal doxorubicin. In this study, patients with GG genotype had better TTP (median 330 vs. 129 days; p = 0.0008), PFS (median 338 vs. 129 days; p = 0.0006) and OS (p = 0.0045) [55]. Nevertheless, we observed a significant association of patients outcome with MDR1 haplotypes – TGT/CGT vs. “other”, “at least one CWC” vs. “none CWC”, “at least one TGT” vs. “none TGT” evaluated separately in the category of newly diagnosed MM (n = 47) and relapsed MM (n = 63). The “at least one CWC” compared to “none CWC” haplotype also showed significantly better 2-year TTP and PFS and is associated with lower level of calcium in relapsed MM patients. For newly diagnosed MM patients, “at least one TGT” compared with “none TGT” haplotype was associated with significantly worse 2-year TPP and PFS and D–S stadium. Moreover, “at least one TGT” haplotype compared to “none TGT” haplotype is associated with higher level of creatinine, B2 microglobulin and cytological percentage of BM infiltration by pathological PCs in relapsed MM patients, but was not associated with significantly worse 2-year patients outcome.
In a previous study of 115 MM patients treated with DAV (dexamethasone, doxorubicin (adryamicin) and vincristine) regimen followed by autologous transplantation, patients with CT and TT genotypes in MDR1 (rs1045642) achieved longer OS in comparison with those with CC genotype (T allele carriers would show longer OS) [56]. Subsequently, the study of the most frequent haplo/diplotypes in MDR1 (rs1045642, rs2032582) in 110 MM patients treated with DAV regimen, followed by autologous stem cell transplantation, showed that survival probability was lower for GC/GC patients (55%) than for GC/TT and TT/TT carriers [57]. In contrast to these studies, Jamroziak et al. found comparable allele and genotype frequencies among 111 MM patients and 96 controls [58]. Moreover, patients and control groups did not differ regarding MDR1 haplo-type distribution (rs1045642, rs2032582 and rs1128503), and their results do not support major influence of MDR1 variants on the risk of MM in Caucasians. Thus, functional importance of SNPs in MDR1 is controversial as the association between a polymorphism (rs1045642) in MDR1 and effect of treatment showed contradictory results so far [56–61].
Taken together, we aimed to evaluate 3 SNPs associated with hypoxia in HIF-1α (rs11549467, rs2057482) and HIF-1β genes (rs2228099) and 4 SNPs associated with multidrug resistance in MDR1 gene (rs1045642, rs2032582 and rs1128503) and MRP1 gene (rs4148356) in MGUS and MM patients. Although our results show promising associations, further studies are needed to confirm the usefulness of these polymorphisms in risk prediction of MG and/or outcomes of MM patients that underwent bortezomib-based treatment.
Acknowledgements:
We would like to thank all the patients and their caregivers for participating in this study. We would also like to express our thanks to data managers of all centers of the Czech Myeloma Group.
Further, we would like to thank all technicians from the Department of Clinical Hematology, University Hospital Brno, for their technical support, and John B. Smith for proofreading the manuscript.
This work was supported by grant of Ministry of Health, Czech Republic – Conceptual development of research organization (FNBr, 65269705).
The authors declare they have no potential con flicts of interest concerning drugs, products, or services used in the study.
The Editorial Board declares that the manuscript met the ICMJE recommendation for biomedical papers.
doc. RNDr. Sabina Sevcikova, Ph.D.
Babak Myeloma
Group Department of Pathological
Physiology
Faculty of Medicine Masaryk University
Kamenice 5 Brno Czech Republic
e-mail: sevcik@med.muni.cz
Submitted: 19. 3. 2018
Accepted: 24. 4. 2018
Zdroje
1. International Myeloma Working Group. Criteria for the classification of monoclonal gammopathies, multiple myeloma and related disorders: a report of the International Myeloma Working Group. Br J Haematol 2003; 121 (5): 749–757.
2. Kyle RA, Rajkumar SV. Multiple myeloma. Blood 2008; 111 (6): 2962–2972. doi: 10.1182/blood-2007-10-078022.
3. Hajek R, Krejci M, Pour L et al. Multiple myeloma. Klin Onkol 2011; 24 Suppl: S10–S13.
4. Kyle RA, Buadi F, Rajkumar SV. Management of monoclonal gammopathy of undetermined significance (MGUS) and smoldering multiple myeloma (SMM). Oncology (Williston Park) 2011; 25 (7): 578–586.
5. Wang GL, Jiang BH, Rue EA et al. Hypoxia-inducible factor 1 is a basic-helix-loop-helix-PAS heterodimer reg-ulated by cellular O2 tension. Proc Natl Acad Sci U S A 1995; 92 (12): 5510–5514.
6. Martin SK, Diamond P, Gronthos S et al. The emerging role of hypoxia, HIF-1 and HIF-2 in multiple myeloma. Leukemia 2011; 25 (10): 1533–1542. doi: 10.1038/leu.2011.122.
7. Hajek R, Okubote SA, Svachova H. Myeloma stem cell concepatients, heterogeneity and plasticity of multiple myeloma. Br J Haematol 2013; 163 (5): 551–564. doi: 10.1111/bjh.12563.
8. Colla S, Storti P, Donofrio G et al. Low bone marrow oxygen tension and hypoxia-inducible factor-1α overexpression characterize patients with multiple myeloma: role on the transcriptional and proangiogenic profiles of CD138 (+) cells. Leukemia 2010; 24 (11): 1967–1970. doi: 10.1038/leu.2010.193.
9. Martin SK, Diamond P, Williams SA et al. Hypoxia-inducible factor-2 is a novel regulator of aberrant CXCL12 expression in multiple myeloma plasma cells. Haematologica 2010; 95 (5): 776–784. doi: 10.3324/haematol.2009.015628.
10. Giatromanolaki A, Bai M, Margaritis D et al. Hypoxia and activated VEGF/receptor pathway in multiple myeloma. Anticancer Res 2010; 30 (7): 2831–2836.
11. Hu Y, Kirito K, Yoshida K et al. Inhibition of hypoxia-inducible factor-1 function enhances the sensitivity of multiple myeloma cells to melphalan. Mol Cancer Ther 2009; 8 (8): 2329–2338. doi: 10.1158/1535-7163.MCT-09-0150.
12. Borsi E, Perrone G, Terragna C et al. Hypoxia inducible factor-1 alpha as a therapeutic target in multiple myeloma. Oncotarget 2014; 5 (7): 1779–1792. doi: 10.18632/oncotarget.1736.
13. Ria R, Catacchio I, Berardi S et al. HIF-1α of bone marrow endothelial cells implies relapse and drug resistance in patients with multiple myeloma and may act as a therapeutic target. Clin Cancer Res 2014; 20 (4): 847–858. doi: 10.1158/1078-0432.CCR-13-1950.
14. Storti P, Bolzoni M, Donofrio G et al. Hypoxia-inducible factor (HIF) -1α suppression in myeloma cells blocks tumoral growth in vivo inhibiting angiogenesis and bone destruction. Leukemia 2013; 27 (8): 1697–1706. doi: 10.1038/leu.2013.24.
15. Hu J, Van Valckenborgh E, Xu D et al. Synergistic induction of apoptosis in multiple myeloma cells by bortezomib and hypoxia-activated prodrug TH-302, in vivo and in vitro. Mol Cancer Ther 2013; 12 (9): 1763–1773. doi: 10.1158/1535-7163.MCT-13-0123.
16. Doublier S, Belisario DC, Polimeni M et al. HIF-1 activation induces doxorubicin resistance in MCF7 3-D spheroids via P-glycoprotein expression: a potential model of the chemo-resistance of invasive micropapillary carcinoma of the brest. BMC Cancer 2012; 12 : 4. doi: 10.1186/1471-2407-12-4.
17. Song X, Liu X, Chi W et al. Hypoxia-induced resistance to cisplatin and doxorubicin in non-small cell lung cancer is inhibited by silencing of HIF-1alpha gene. Cancer Chemother Pharmacol 2006; 58 (6): 776–784. doi: 10.1007/s00280-006-0224-7.
18. Zhou SF, Di YM, Chan E et al. Clinical pharmacogenetics and potential application in personalized medicine. Curr Drug Metab 2008; 9 (8): 738–784.
19. Saleun JP, Vicariot M, Deroff P et al. Monoclonal gammopathies in the adult population of Finistère, France. J Clin Pathol 1982; 35 (1): 63–68.
20. Bourguet CC, Grufferman S, Delzell E et al. Multiple myeloma and family history of cancer. A case-control study. Cancer 1985; 56 (8): 2133–2139.
21. Eriksson M, Hållberg B. Familial occurrence of hematologic malignancies and other diseases in multiple myeloma: a case-control study. Cancer Causes Control 1992; 3 (1): 63–67.
22. Brown LM, Linet MS, Greenberg RS et al. Multiple myeloma and family history of cancer among blacks and whites in the U.S. Cancer 1999; 85 (11): 2385–2390.
23. Landgren O, Linet MS, McMaster ML et al. Familial characteristics of autoimmune and hematologic disorders in 8,406 multiple myeloma patients: a population-based case-control study. Int J Cancer 2006; 118 (12): 3095–3098. doi: 10.1002/ijc.21745.
24. Altieri A, Chen B, Bermejo JL et al. Familial risks and temporal incidence trends of multiple myeloma. Eur J Cancer 2006; 42 (11): 1661–1670. doi: 10.1016/j.ejca.2005.11.033.
25. Morgan G, Johnsen HE, Goldschmidt H et al. Myeloma Genetics International Consortium. Leuk Lymphoma 2012; 53 (5): 796–800. doi: 10.3109/10428194.2011.639881.
26. Almasi M, Sevcikova S, Svachova H et al. Polymorphisms contribution to the determination of significant risk of specific toxicities in multiple myeloma. Klin Okol 2011; 24 (suppl 1): S39–S42.
27. Stephens M, Smith NJ, Donnelly P. A new statistical method for haplotype reconstruction from population data. Am J Hum Genet 2001; 68 (4): 978–989. doi: 10.1086/319501.
28. Stephens M, Scheet P. Accounting for decay of linkage disequilibrium in haplotype inference and missing data imputation. Am J Hum Genet 2005; 76 (3): 449–462. doi: 10.1086/428594.
29. Warnes G, Gorjanc G, Leisch F. Man M (2012) genetics: Population Genetics. [online]. Available from: http: //CRAN.R-project.org/package=genetics.
30. Rajkumar SV, Kyle RA, Therneau TM et al. Serum free light chain ratio is an independent risk factor for progression in monoclonal gammopathy of undetermined significance. Blood 2005; 106 (3): 812–817. doi: 10.1182/blood-2005-03-1038.
31. Broderick P, Chubb D, Johnson DC et al. Common variation at 3p22.1 and 7p15.3 influences multiple myeloma risk. Nat Genet 2011; 44 (1): 58–61. doi: 10.1038/ng.993.
32. Enciso-Mora V, Broderick P, Ma Y et al. A genome-wide association study of Hodgkin‘s lymphoma identifies new susceptibility loci at 2p16.1 (REL), 8q24.21 and 10p14 (GATA3). Nat Genet 2010; 42 (12): 1126–1130. doi: 10.1038/ng.696.
33. Crowther-Swanepoel D, Broderick P, Di Bernardo MC et al. Common variants at 2q37.3, 8q24.21, 15q21.3 and 16q24.1 influence chronic lymphocytic leukemia risk. Nat Genet 2010; 42 (2): 132–136. doi: 10.1038/ng.510.
34. Greenberg AJ, Lee AM, Serie DJ et al. Single-nucleotide polymorphism rs1052501 associated with monoclonal gammopathy of undetermined significance and multiple myeloma. Leukemia 2013; 27 (2): 515–516. doi: 10.1038/leu.2012.232.
35. Chubb D, Weinhold N, Broderick P et al. Common variation at 3q26.2, 6p21.33, 17p11.2 and 22q13.1 influences multiple myeloma risk. Nat Genet 2013; 45 (10): 1221–1225. doi: 10.1038/ng.2733.
36. Hu X, Fang Y, Zheng J et al. The association between HIF-1α polymorphism and cancer risk: a systematic review and meta-analysis. Tumour Biol 2014; 35 (2): 903–916. doi: 10.1007/s13277-013-1160-x.
37. Ruiz-Tovar J, Fernandez-Contreras ME, Martín-Perez E et al. Association of thymidylate synthase and hypoxia inducible factor-1alpha DNA polymorphisms with pancreatic cancer. Tumori 2012; 98 (3): 364–369. doi: 10.1700/1125.12406.
38. Wang X, Liu Y, Ren H et al. Polymorphisms in the hypoxia-inducible factor-1α gene confer susceptibility to pancreatic cancer. Cancer Biol Ther 2011; 12 (5): 383–387.
39. Liu J, Zhang HX 1790 G/A polymorphism, but not 1772 C/T polymorphism, is significantly associated with cancers: an update study. Gene 2013; 523 (1): 58–63. doi: 10.1016/j.gene.2013.03.129.
40. Fu SL, Miao J, Ding B et al. A polymorphism in the 3‘ untranslated region of Hypoxia-Inducible Factor-1 alpha confers an increased risk of cervical cancer in a Chinese population. Neoplasma 2013; 61 (1): 63–69. doi: 10.4149/neo_2014_002.
41. Barrett LMW, Fletcher S, Wilton SD. Regulation of eukaryotic gene expression by the untranslated gene regions and other non-coding elements. Cell Mol Life Sci 2012; 69 (21): 3613–34. doi: 10.1007/s00018-012-0990-9.
42. De Pergola G, Silvestris F. Obesity as a major risk factor for cancer. J Obes 2013; 2013 : 291546. doi: 10.1155/2013/291546.
43. Héron-Milhavet L, LeRoith D. Insulin-like growth factor I induces MDM2-dependent degradation of p53 via the p38 MAPK pathway in response to DNA damage. J Biol Chem 2002; 277 (18): 15600–15606. doi: 10.1074/jbc.M111142200.
44. Wu Y, Yakar S, Zhao L et al. Circulating insulin-like growth factor-I levels regulate colon cancer growth and metastasis. Cancer Res 2002; 62 (4): 1030–1035.
45. Friedman GD, Herrinton LJ. Obesity and multiple myeloma. Cancer Causes Control 1994; 5 (5): 479–483.
46. Blair CK, Cerhan JR, Folsom AR et al. Anthropometric characteristics and risk of multiple myeloma. Epidemiology 2005; 16 (5): 691–694.
47. Cozen W, Gebregziabher M, Conti DV et al. Interleukin-6-related genotypes, body mass index, and risk of multiple myeloma and plasmacytoma. Cancer Epidemiol Biomarkers Prev 2006; 15 (11): 2285–2291. doi: 10.1158/1055-9965.EPI-06-0446.
48. Chiu BC, Gapstur SM, Greenland P et al. Body mass index, abnormal glucose metabolism, and mortality from hematopoietic cancer. Cancer Epidemiol Biomarkers Prev 2006; 15 (12): 2348–2354. doi: 10.1158/1055-9965.EPI-06-0007.
49. Khan MM, Mori M, Sakauchi F et al. Risk factors for multiple myeloma: evidence from the Japan Collaborative Cohort (JACC) study. Asian Pac J Cancer Prev 2006; 7 (4): 575–581.
50. Birmann BM, Giovannucci E, Rosner B et al. Body mass index, physical activity, and risk of multiple myeloma. Cancer Epidemiol Biomarkers Prev 2007; 16 (7): 1474–1478. doi: 10.1158/1055-9965.EPI-07-0143.
51. Larsson SC, Wolk A. Body mass index and risk of multiple myeloma: a meta-analysis. Int J Cancer 2007; 121 (11): 2512–2516. doi: 10.1002/ijc.22968.
52. Lichtman MA. Obesity and the risk for a hematological malignancy: leukemia, lymphoma, or myeloma. Oncologist 2010; 15 (10): 1083–1101. doi: 10.1634/theoncologist.2010-0206.
53. Wallin A, Larsson SC. Body mass index and risk of multiple myeloma: a meta-analysis of prospective studies. Eur J Cancer 2011; 47 (11): 1606–1615. doi: 10.1016/j.ejca. 2011.01.020.
54. Hofmann JN, Moore SC, Lim U et al. Body mass index and physical activity at different ages and risk of multiple myeloma in the NIH-AARP diet and health study. Am J Epidemiol 2013; 177 (8): 776–786. doi: 10.1093/aje/kws295.
55. Buda G, Ricci D, Huang CC et al. Polymorphisms in the multiple drug resistance protein 1 and in P-glycoprotein 1 are associated with time to event outcomes in patients with advanced multiple myeloma treated with bortezomib and pegylated liposomal doxorubicin. Ann Hematol 2010; 89 (11): 1133–1140. doi: 10.1007/s00277-010-0992-3.
56. Buda G, Maggini V, Galimberti S et al. MDR1 polymorphism influences the outcome of multiple myeloma patients. Br J Haematol 2007; 137 (5): 454–456. 10.1111/j.1365-2141.2007.06605.x.
57. Maggini V, Buda G, Martino A et al. MDR1 diplotypes as prognostic markers in multiple myeloma. Pharmacogenet Genomics 2008; 18 (5): 383–389. doi: 10.1097/FPC.0b013e3282f82297.
58. Jamroziak K, Balcerczak E, Calka K et al. Polymorphisms and haplotypes in the multidrug resistance 1 gene (MDR1/ABCB1) and risk of multiple myeloma. Leuk Res 2009; 33 (2): 332–335. doi: 10.1016/j.leukres.2008.06. 008.
59. Drain S, Catherwood MA, Orr N et al. ABCB1 (MDR1) rs1045642 is associated with increased overall survival in plasma cell myeloma. Leuk Lymphoma 2009; 50 (4): 566–570. doi: 10.1080/10428190902853144.
60. Drain S, Flannely L, Drake MB et al. Multidrug resistance gene expression and ABCB1 SNPs in plasma cell myeloma. Leuk Res 2011; 35 (11): 1457–1463. doi: 10.1016/j.leukres.2011.05.033.
61. Drain S, Catherwood MA, Bjourson AJ et al. Neither P-gp SNP variants, P-gp expression nor functional P-gp activity predicts MDR in a preliminary study of plasma cell myeloma. Cytometry B Clin Cytom 2012; 82 (4): 229–237. doi: 10.1002/cyto.b.21018.
Štítky
Dětská onkologie Chirurgie všeobecná Onkologie
Článek vyšel v časopiseKlinická onkologie
Nejčtenější tento týden
2018 Číslo 3- Metamizol jako analgetikum první volby: kdy, pro koho, jak a proč?
- Nejasný stín na plicích – kazuistika
- Nejlepší kůže je zdravá kůže: 3 úrovně ochrany v moderní péči o stomii
- Hojení análních fisur urychlí čípky a gel
-
Všechny články tohoto čísla
- Monoclonal gammopathy of undetermined significance
- Histopathology of Neuroendocrine Neoplasms of the Gastrointestinal System
- A Possible Role of Human Herpes Viruses Belonging to the Subfamily Alphaherpesvirinae in the Development of Some Cancers
- Potential of the Flavonoid Quercetin to Prevent and Treat Cancer – Current Status of Research
- Use of Trastuzumab for Neoadjuvant Therapy of HER2+ Breast Cancer – 5-Years of Experience in a Single Clinic
- Detection of FLT3 Mutations in Patients from Eastern Slovakia
- Effects of Treatment with Crizotinib on Non-small Cell Lung Carcinoma with ALK Translocation in the Czech Republic
- Selected Genetic Polymorphisms Associated with Hypoxia and Multidrug Resistance in Monoclonal Gammopathies Patients
- Resection of Abdominal, Pelvic and Retroperitoneal Tumors
- Aktuality z odborného tisku
- Klinická onkologie
- Archiv čísel
- Aktuální číslo
- Informace o časopisu
Nejčtenější v tomto čísle- Potential of the Flavonoid Quercetin to Prevent and Treat Cancer – Current Status of Research
- Histopathology of Neuroendocrine Neoplasms of the Gastrointestinal System
- Resection of Abdominal, Pelvic and Retroperitoneal Tumors
- Detection of FLT3 Mutations in Patients from Eastern Slovakia
Kurzy
Zvyšte si kvalifikaci online z pohodlí domova
Autoři: prof. MUDr. Vladimír Palička, CSc., Dr.h.c., doc. MUDr. Václav Vyskočil, Ph.D., MUDr. Petr Kasalický, CSc., MUDr. Jan Rosa, Ing. Pavel Havlík, Ing. Jan Adam, Hana Hejnová, DiS., Jana Křenková
Autoři: MUDr. Irena Krčmová, CSc.
Autoři: MDDr. Eleonóra Ivančová, PhD., MHA
Autoři: prof. MUDr. Eva Kubala Havrdová, DrSc.
Všechny kurzyPřihlášení#ADS_BOTTOM_SCRIPTS#Zapomenuté hesloZadejte e-mailovou adresu, se kterou jste vytvářel(a) účet, budou Vám na ni zaslány informace k nastavení nového hesla.
- Vzdělávání


