
CHANGES OF THE FOVEAL AVASCULAR ZONE AND MACULAR MICROVASCULATURE WITHIN THE FRAMEWORK OF OCT ANGIOGRAPHY EXAMINATION IN YOUNG PATIENTS WITH TYPE 1 DIABETES (PILOT STUDY)
Authors:
L. Magera; J. Krásný; P. Pluhovský; L. Holubová
Authors place of work:
Oční klinika FN Královské Vinohrady, Praha
Published in the journal:
Čes. a slov. Oftal., 76, 2020, No. 3, p. 111-117
Category:
Původní práce
doi:
https://doi.org/10.31348/2020/19
Summary
Aim: Learn about the development and changes in foveal avascular zone (FAZ) and vascularity of retina in the surrounding zone, depending on the duration in young diabetic patients type 1 (T1DM).
Methods: As part of regular one-year examinations of young T1DM patients at the Eye Clinic of the University Hospital Královské Vinohrady in Prague (Czech Republic, EU) from January to December 2019, OCT angiography using the device Spectralis (Heidelberg Engineering) was included. Forty patients aged 18 to 30 years were examined, median 21 years. T1DM was diagnosed in childhood and lasted for more than 10 years. At the same time, a control group of forty individuals of similar age, without metabolic and other general disease was examined, normal visual acuity and physiological fundoscopic finding were obligatory. The FAZ size was evaluated in both groups (using built-in function "Draw Region"), also its shape, density decrease and change in character of vascularity of the retina was assessed.
Results: In the control group, the FAZ area ranged from 0.06 to 0.4 mm², with an average of 0.253 ± 0.092 mm² and a median of 0.27 mm². It was not affected by a fundamental change in its round shape and the surrounding capillary netting was regular and reasonably dense. In T1DM patients, the FAZ area was in a wider range, from 0.05 to 0.64 mm², an average of 0.300 ± 0.132 mm², and a median of 0.31 mm². The difference in FAZ across-the-board evaluation was statistically significant (p = 0, 009). Diabetic preretinopathy (DpR) was defined by the irregularity of the capillary density up to the manifestation of non-perfusion, in 61% of cases the size of the FAZ was changed. In diabetic retinopathy (DR) there was always an irregularity of the FAZ shape with its enlargement, manifestation of non-perfusion, capillary dilatation and rare microaneurysms.
Conclusion: Changes in FAZ size corresponded to the stage of T1DM on the fundoscopic finding of the eye depending on its duration. The initial increased amount of foveal capillaries, which resulted in decreased FAZ area, was followed by a gradual decrease in capillaries and increased FAZ area, consistent with the manifestations of DpR. It was accompanied by a change in capillary density in macula to eventual non-perfusion. On the contrary, the increase in the FAZ area and its irregularity accompanied by non-perfusion of the capillary net and microaneurysms corresponded to the development of DR already.
Keywords:
Diabetic retinopathy – diabetic preretinopathy – FAZ – OCT angiography – T1DM
INTRODUCTION
Optical coherence tomography angiography (OCT-A) represents a non-invasive method, serving for imaging of the vascular system of the retina and choroid. OCT-A is based on the principle of recording kinetic differences in the otherwise static terrain of the retina. The principle of examination is repeated recording of the selected region of the retina and choroid, and mutual comparison of the obtained images. The only differences are conditioned by variable reflectivity on the membranes of the flowing blood elements – red blood cells. These differences are processed by software into an image of the vascular structure. The advantage of the method is that the individual layers of the retina and choroid illustrate larger and medium-sized arterial and venous vascular branches, as well as capillaries in the layer of the ganglion cells. The deep vascular segment of the retina displays the capillary structure on the level of the internal nuclear layer. Artefacts of vascular branches are projected here from the superficial layers. Otherwise the capillary network, in the character of its structure and tortuosity, differs markedly from the surface network. Assessment of the foveal avascular zone (FAZ) is of fundamental significance, and in physiological conditions it is sharply bordered from the foveal arcade of the capillaries. No reflectivity corresponding to movement of blood elements is detected in the avascular segment of a healthy eye. The segment of the choroicapillaris is displayed on OCT-A as a dense network of alternating hyper and hyporeflexive points, without revealing the linear flow of the blood vessels. The segment of the choroid is manifested by a rough diffuse structure of the vascular branches [1]. OCT-A can be used in the evaluation of certain diagnoses, including above all ARMD (age-related macular degeneration), both dry and wet form, also RVO (retinal vein occlusion) and also diabetic retinopathy and maculopathy [1]. We decided to use the OCT-A method to evaluate the progressive development of pathophysiological changes in diabetic eyes. This concerns a further diagnostic procedure following on from already used functional examination with the aid of contrast sensitivity (CS) together with evaluation of structural changes of the retina with the aid of spectral domain optical coherence tomography (SD-OCT).
METHOD
From young patients with T1DM observed regularly and long-term (i.e. more than ten years) at the Department of Ophthalmology at the Královské Vinohrady University Hospital in Prague, who underwent examination in the period from January to December 2019, we created a cohort of 40 patients, of whom 20 were women and 20 men, aged between 18 and 30 years (mean 22 ± 3.5 years, median 21 years). T1DM was diagnosed in childhood, predominantly in pre-school age (on average from 5 years), with a period of duration of T1DM of up to 25 years (mean 16.6 ± 3,7 years, median 15.5 years). Metabolic parameters and compensation for diabetes were not assessed in the study. A control group was composed of 20 men and 20 women aged between 18 and 29 years (mean 23.8 ± 3.2 years, median 24 years). This comprised 40 healthy individuals, thus without any metabolic or other general pathology. Of ocular diagnoses, refractive errors or strabismus could be present, on the condition of visual acuity (VA) of 4/4 or better on ETDRS optotypes, either naturally or with correction. An entirely physiological finding was always detected on the ocular fundus. A comprehensive ophthalmological examination of both eyes was always conducted within the framework of observation of the T1DM patients. Visual acuity was measured on ETDRS optotypes from 4 metres, followed by an examination of the anterior segment of the eye on a slit lamp and examination of the posterior segment of the eye by indirect ophthalmoscopy in cyloplegia for assessment of any relevant diabetic changes on the ocular fundus (specifically the presence of hard exudates, microaneurysms or other vascular abnormalities or haemorrhages). At the same time SD-OCT and CS were conducted on all patients. Both of these methods were included with regard to long-term observation and did not constitute the content of the overall evaluation. The fundamental and main examination method of the study represented imaging of the microvascular retina with the aid of OCT-A on a Spectralis instrument from the Heidelberg Engineering company. For measurement we used our own specific configuration, in which the instrument recorded 7 images in the same cross-section of the retina in a high-resolution regime. Using this method we displayed a surface of 15 x 15 degrees, which corresponds to a cross-section of approximately 4.4 x 4.4 mm of the retina and choroid. Segmentation of the retinal layers was conducted automatically. In order to achieve the most accurate and most contrasting imaging of the FAZ, we selected a combined image of all the vascular complexes of the retina, thus the superficial vascular complex (SVC), intermediate capillary plexus (ICP) and deep capillary plexus (DCP). With the use of the inbuilt “Draw Region” function it was possible to manually demarcate the area of the FAZ and calculate its surface area. Measurement of the surface of the FAZ was always performed by one specialist. Statistical processing of the measurement was conducted with the aid of a T-test. For evaluation of further vascular changes, separate imaging of the superficial (SVC) or deep (DVC) vascular complex was used. The study did not include assessment of the choriocapillaris and choroid.
RESULTS
In all patients from the group with T1DM, the values of VA were on the level of 4/4 ETDRS or better, either naturally or with correction. On the ocular fundus we always detected changes of the structure of the macular region in the sense of fragmentation to disappearance of the foveal reflex and irregularity of the course and calibre of capillaries, with an increase in their tortuosity. We indicated this finding as diabetic preretinopathy (DpR). In addition, in a total of 16 eyes (20 %) we identified isolated microaneurysms (MA) or haemorrhages, and occasionally also presence of hard exudates (HE). In these cases this concerned incipient non-proliferative diabetic retinopathy (NPDR). Changes of DpR predominated over NPDR in 80 % of cases.
The main comparative parameter was the surface of the FAZ. In the control group the mean value of the FAZ was 0.253 ± 0.092 mm2 (median 0.27 mm2, range 0.06 to 0.4 mm2). The mean value of diabetic eyes was higher, specifically 0.300 ± 0.132 mm2 (median 0.31 mm2, range 0.05 to 0.64 mm2). The size of the difference in the surface of the FAZ between diabetics and the control group, which is expressed in the box graph (Graph 1), was statistically significant (p = 0.009).

In the control group we observed a small, insignificant increase in the size of the FAZ together with age (Graph 2). In comparison with the control group, in diabetics the measured values were more dispersed around the mean, and the surface of the FAZ increased proportionate to the duration of diabetes (Graph 3).


The examination of the control group confirmed that the OCT-A image was distinguished in the SVC by the delineated arterial and venous branches and capillary structure, with a high degree of reflectivity. The actual FAZ was regularly rounded (Fig. 1a). The DVC was distinguished by a denser capillary network, without linkage to the vascular stems, the FAZ was also rounded, bordered by the foveal arcade of capillaries (Fig. 1b). On the combined image of three vascular segments (SVC, ICP, DCP) it is possible to see a sharply bordered and rounded FAZ (Fig. 1c).
A. Superficial vascular complex (SVC) with regular capillary network
B. Deep vascular complex (DVC) with dense capillary network
and regular foveal avascular zone (FAZ)
C. Regular, bordered and rounded FAZ (highlighted in blue)
with size of 0.28 mm2

The result of OCT-A in DpR was of a dual form. Initially the FAZ was narrower (within the range of 0.05 to 0.26 mm2), accompanied by irregularity of the capillary network in the parafoveal zone in the SVC, with an otherwise regular broader capillary network, but the possibility of non-perfusion was not always excluded (Fig. 2c). In the dense capillary network in the DVC, local irregularity of the structure was evident (Fig. 2b).
A. Superficial vascular complex with irregularity of parafoveal capillaries with zones of non-perfusion (arrow)
B. The capillary network is more or less
regular in the deep vascular complex, but
in place the finding is distinguished by
thinning (arrow), surface of foveal avascular zone is narrower – 0.16 mm2

The second OCT-A image in DpR with a wider FAZ (from 0.19 mm2 to 0.47 mm2) in the SVC presented multiple smaller zones of non-perfusion and isolated overlap of the capillary vascular branches into the FAZ (Fig. 3a). The DVC still had an altogether regular capillary network, but it was thin throughout the entire parafoveal region (Fig. 3b). In total we recorded deposits of non-perfusion in 38 eyes (59 %) with DpR in SVC.
A. Evident multiple smaller zones of
non-perfusion in superficial vascular
complex (arrows), indication of overlap
of vascular capillary nodes into foveal
avascular zone (FAZ)
B. Capillary network is regular in deep
vascular complex, but slightly thinner
around FAZ (arrows), FAZ surface is wider – 0.37 mm2

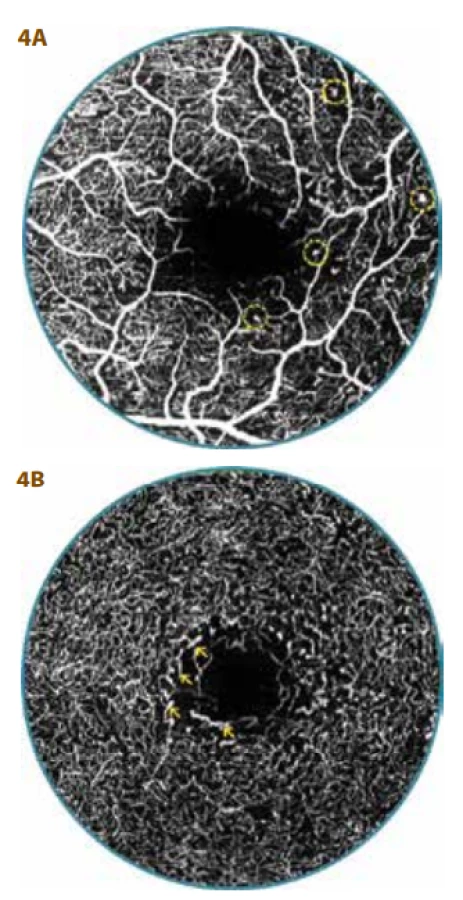
In all the patients with NPDR, serious changes were already present, the FAZ was extended (from 0.34 mm2 to 0.64 mm2) and of irregular shape. There were always multiple zones of non-perfusion in the SVC and DVC. In the SVC the vascular capillary branches penetrated deeper into the FAZ, furthermore microaneurysms were present (Fig. 4a), and in addition to pronounced thinning in the DVC there were also deposits of a dilated capillary network (Fig. 4b).
A. Foveal avascular zone (FAZ) is markedly extended and irregular, superficial vascular complex with multiple zones of non-perfusion, microaneurysms
(in circle) and pronounced overlap of
vascular capillary nodes into FAZ
B. Surface of FAZ – 0.58 mm2, deep vascular complex with numerous zones of
non-perfusion and thinning of capillary
network, with deposits of dilation (arrow)
The increase in the surface of the FAZ, which was caused by the period of duration of T1DM together with progressive changes in the sense of non-perfusion, was in accordance with the transition of DpR to NPDR. Due to the different number of patients in both groups of ocular manifestations of T1DM, it was not possible to conduct a statistical comparison of the duration. Nevertheless, there was an evident difference here, in the case of DpR the period of duration of T1DM was within the range of 11 to 21 years, with a mean of 15.3 years, whereas in the case of NPDR this was between 16 and 25 years with a mean of 21.3 years. Whereas in DpR there was a predominance rather of lower age, in DR there was a predominance of higher age within the relevant range.
DISCUSSION
The group of patients examined in this pilot study was compiled on the basis of the same model as in our two previous studies on the theme of CS [2] and SD-OCT examination [3] in the case of incipient ocular changes in T1DM. The borderline for examination in this study was 30 years of age in the cohort, which was also the content of the study on CS of the research project IGA NR/7952-3 [2]. We included the inception of T1DM on average up to 5 years of age for the observation, as in the previous pilot study of the relationship of SD-OCT and CS [3] due to the future possibility of comparison of the development of ocular changes in T1DM. The observation period of over 10 years duration of T1DM was also stipulated in the previous two studies [2,3], since they detected incipient functional structural changes in the ocular finding before the onset of actual NPDR. This is already clearly defined in its symptoms, which include microaneurysms, haemorrhages, phlebopathy, intraretinal abnormalities and cotton wool spots, and is divided into a number of levels [4,5]. Nevertheless, a certain intermediate degree exists between this stage and a physiological finding.
Clarification of the pathogenesis and pathophysiology of DR is linked with Cunha-Vaz’s discovery of fluorophotometry at the end of the 1970s [6,7]. The method enabled a description of the collapse of the blood-ocular barrier, and led to the introduction of the term “preretinopathy” [5]. Czechoslovak authors also describe preretinopathy in connection with fluorescence-highlighted vascular changes: dilation and segmental occlusion of capillaries [8], and in direct chromato-ophthalmoscopy with green light it was possible to determine atypical vascular phenomena: irregularity of capillaries and their dilation, which the authors indicated as a suspect finding of DR [9]. Other symptoms such as microangiopathic abnormalities [10] and functional microangiopathy and capillaropathy are classified among the changes of preretinopathy [11]. We also recorded an analogy of these findings in the image of macular changes upon a decrease of CS, with physiological values of VA [2]. The EURODIAB study does not engage with the issue of DpR, and a detailed analysis of the diagnostic-therapeutic solution of complications of diabetes also does not deal with the condition [4].
The recommended procedures for DR in 2016 covered four basic diagnostic procedures: examination on slit lamp, stereoscopic photography or digital stereophotography, FAG and OCT on the principle of low-coherence interferometry. At the time the inclusion of OCT-A was not considered [4]. It is now known that this method, due to its non-invasive approach, in a certain manner and in certain indications is able to replace FAG, since it enables an unlimited number of repeated examinations, which is not possible to indicate so often in the case of FAG [1]. The size of the FAZ measured by FAG and OCT-A is comparable [12]. The repeatability and precision of individual OCT-A measurements is also comparable, and does not depend on the used instrument [13] or the selected protocol (6 x 6 or 3 x 3 mm) [14,15], or on whether the measurement is conducted manually or automatically [16,17].
In our study we analysed the results of OCT-A upon an examination of 40 patients with T1DM, with a specific age composition (18 to 30 years) and a minimum duration of diabetes of 10 years.
In our cohort, findings of DpR predominated over mild form of NPDR. In comparison with the control group, the surface of the FAZ in T1DM was larger on average, its measured values were more dispersed and increased proportionate to the duration of diabetes. Some studies demonstrate that in healthy young individuals also the FAZ is significantly diverse with regard to race [18], age and sex [19], or the presence of a myopic defect in children [20]. The anatomical depth of the foveola, which is variable in patients with duration of T1DM of more than 10 years, may also have an influence [3]. Due to the diversity of the physiological values of the surface of the FAZ, it is not possible to use this value as a screening value [21,22]. By contrast, a Polish study on 130 children and adolescents demonstrated that the size of the FAZ was independent of age [23], which was confirmed by the evaluation of our control group from the same region of Europe in the age group of 18 to 29 years accompanied with a slight, insignificant increase. The enlargement of the FAZ in DR was demonstrated 15 years ago with the aid of FAG [24]. Later a series of authors published findings that it is possible to demonstrate this without the use of a contrast substance with the aid of non-invasive OCT-A. In patients with DR, the surface of the FAZ was larger in comparison with a healthy control group, and its size was directly proportionate to the stage of progression of the finding [16,25-29], the results of which are influenced by the stage of DR. Further studies have confirmed a correlation between a decrease of VA and an enlarging surface of the FAZ in DR [27,30-32], which we did not record due to the minimal findings of pathological affliction of the macular region in incipient NPDR. In other studies, upon comparison of diabetic patients without clinical symptoms of DR with a control group, the difference in the surface of the FAZ was not significant [21,23,33-35]. At the same time, in these studies a large variation in the size of FAZ was observed in the control group [21], or the duration of T1DM was shorter than 10 years [23]. In our group, with a duration of T1DM of more than 10 years, the difference was due to the classification of 1/5 of patients with NPDR, which corresponded with a Japanese study describing a larger surface of the FAZ in diabetic patients without DR, and an even larger surface in diabetics with DR in comparison with a control group [26]. In patients with a normal size of the FAZ and an average length of duration of T1DM of over ten years, there was a certain decrease in the density of the capillary network [33,35], which was in accordance with our own observation. An increase in the density of the capillary network was observed upon unchanged FAZ in diabetic patients without signs of DR [34]. We observed a contraction of the FAZ, which probably represents an auto-regulatory response to increased metabolic demand [34].
The abnormalities of the capillary network were what was identified first of all by direct ophthalmoscopy [9,11], and also demonstrated by fluoroangioscopy [8,10], which led to the coining of the term preretinopathy. OCT-A examination confirmed this fact, since it detects early microvascular changes in the eyes, both without and with symptoms of DR [37,38]. Decisive for the OCT - -A image with the use of Doppler technique is the assessment of the quantitative through-flow of blood in the retina [39]. In the healthy population the speed of through-flow in the arteries is approximately 4.5 mms-1 and in veins 3.2 mms-1, and similar values are recorded in diabetic patients without demonstrated DR. By contrast, in mild forms of NPDR through-flow in arteries is slightly slower, but is significantly reduced in veins [25]. The slowing of through-flow in capillaries may be contributed to also by angiographically demonstrated occlusion [8]. The slowing of through-flow in the MA is only 40 % demonstrable on OCT-A examination, by contrast with FAG [40]. OCT-A demonstrates a reduction of overall capillary density in patients with DR [41], as well as early microvascular changes [38], regardless of the used instrument [42], above all in the parafoveal region of the DCP [43,44]. We also observed these findings. An analysis of the superficial capillary plexus (SCP) revealed inhibition of the capillary network in comparison with a control group in both parafoveal and perifoveal regions [28], which we recorded in DpR with an already enlarged FAZ. Further thinning and loss of the capillary network continues with progression of ocular changes up to the image of NPDR [34], which we demonstrated in several of our patients with NPDR, where there were already clear signs of non-perfusion [33,35], despite the fact that we do not have a program available for measurement of this parameter, where the number of bifurcations of capillaries is evaluated for example [42]. Progression of changes in the DCP accompanies worsening of DR [29], an example of which was dilation of capillaries observed in our study.
The development of changes of the FAZ and its surrounding area may be a very important screening before the onset of DR in children with T1DM [45], but the shorter observation time in diabetic children (around 5 years) did not demonstrate these changes [23]. The presence of microcirculation changes is a fundamental difference from the healthy population and determines the initial manifestations of T1DM before the biomicroscopical finding of DR [28,33].
CONCLUSION
Changes of the size of the FAZ corresponded with the stage of manifestations of T1DM on the ocular fundus. The increase in tortuosity of capillaries within the framework of microcirculation led to a reduction of its surface, which was the first clinical symptom of DpR. By contrast, an enlargement of the surface of the FAZ and its irregularity, with a perfusion decrease in the density of the capillary network in its surrounding area corresponded to the development of NPDR. A more precise evaluation of the pathophysiology of diabetic affliction on the ocular fundus can be based on a combination of an evaluation of microcirculation changes (OCT-A) and structural changes of the retina (SD - -OCT), together with its functional affliction (CS).
Zdroje
1. Němec P. Trendy soudobé oftalmologie. Svazek 10. Praha: Galén; 2017. OCT angiografie; s. 33–50.
2. Krásný J, Anděl M, Brunnerová R, et al. The contrast sensitivity test in early detection of ocular changes in the relation to the type 1 diabetes mellitus compensation in children, teenegers, and young adults. Recent Pat Inflamm Alergy Drug Discov. 1; 2007; 232–236.
3. Krásný J, Vosáhlo J, Čeledová J, et al. Preretinopatie u mladistvých s diabetem I. typu z pohledu citlivosti na kontrast a koherentní tomografie (Pilotní studie). Ces Slov Oftal. 2014;70 : 123–130.
4. Kalvodová B, Sosna T, Ernest J, et al. Doporučené postupy pro diagnostiku a léčbu diabetické retinopatie. Ces Slov Oftal. 2016;72 : 226–233.
5. Sosna T, Bouček T, Fišer I. Diabetická retinopatie. Praha: Jiří Cendelín; 2001. 255.
6. Cunha-Vaz JG. Pathophysiology of diabetic retinopathy. British Journal of Ophthalmology. 1978;62(6):351–5.
7. Cunha-Vaz JG, Goldberg MF, Vygantas C, Noth J. Early detection of retinal involvement in diabetes by vitreous fluorophotometry. Ophthalmology. 1979;86(2):264–75.
8. Tomčíková D, Gerinec A. Osobitosti diabetické retinopatie u dětí. Ces Slov Oftal. 2001;57 : 266–276.
9. Filouš A, Rychnová J, Vavřinec J. Rozšířená klasifikace diabetické retinopatie u dětí a mladistvých. Cs Pediatr. 1992;47 : 453–455.
10. Verougstraete C, Toussaint D, De Schepper J, Haentjens M, Dorchy H. First microangiographic abnormalities in childhood diabetes - types of lesions. Graefe’s archive for clinical and experimental ophthalmology. 1991;229(1):24–32.
11. Klement UM, Freyler H. Diabetische Präretinopathie. Klin Mbl Augenheilk. 1980;176 : 313–316. German.
12. Enders C, Baeuerle F, Lang GE, Dreyhaupt J, Lang GK, Loidl M, et al. Comparison between Findings in Optical Coherence Tomography Angiography and in Fluorescein Angiography in Patients with Diabetic Retinopathy. Ophthalmologica. 2019 May 28;1–6.
13. Mihailovic N, Eter N, Alnawaiseh M. Foveal avascular zone and OCT angiography. An overview of current knowledge. Ophthalmologe. 2019 Jul;116(7):610–6.
14. Vujosevic S, Toma C, Villani E, Gatti V, Brambilla M, Muraca A, et al. Early Detection of Microvascular Changes in Patients with Diabetes Mellitus without and with Diabetic Retinopathy: Comparison between Different Swept-Source. J Diabetes Res. 2019;2019 : 2547216.
15. Xiao H, Liu X, Liao L, Tan K, Ling Y, Zhong Y. Reproducibility of Foveal Avascular Zone and Superficial Macular Retinal Vasculature Measurements in Healthy Eyes Determined by Two Different Scanning Protocols of Optical Coherence Tomography Angiography. Ophthalmic Res. 2019 Oct 16;1–8.
16. Ashraf M, Nesper PL, Jampol LM, Yu F, Fawzi AA. Statistical Model of Optical Coherence Tomography Angiography Parameters That Correlate With Severity of Diabetic Retinopathy. Invest Ophthalmol Vis Sci. 2018 Aug 1;59(10):4292–8.
17. Ishii H, Shoji T, Yoshikawa Y, Kanno J, Ibuki H, Shinoda K. Automated Measurement of the Foveal Avascular Zone in Swept-Source Optical Coherence Tomography Angiography Images. Transl Vis Sci Technol. 2019 May;8(3):28.
18. Hsu ST, Ngo HT, Stinnett SS, Cheung NL, House RJ, Kelly MP, et al. Assessment of Macular Microvasculature in Healthy Eyes of Infants and Children Using OCT Angiography. Ophthalmology. 2019 Jul 15;
19. Gomez-Ulla F, Cutrin P, Santos P, Fernandez M, Abraldes M, Abalo-Lojo JM, et al. Age and gender influence on foveal avascular zone in healthy eyes. Exp Eye Res. 2019 Oct 22;189 : 107856.
20. Gołębiewska J, Biała-Gosek K, Czeszyk A, Hautz W. Optical coherence tomography angiography of superficial retinal vessel density and foveal avascular zone in myopic children. PLoS ONE. 2019;14(7):e0219785.
21. Lynch G, Romo JSA, Linderman R, Krawitz BD, Mo S, Zakik A, et al. Within-subject assessment of foveal avascular zone enlargement in different stages of diabetic retinopathy using en face OCT reflectance and OCT angiography. Biomed Opt Express. 2018 Dec 1;9(12):5982–96.
22. Wang B, Camino A, Pi S, Guo Y, Wang J, Huang D, et al. Three-dimensional structural and angiographic evaluation of foveal ischemia in diabetic retinopathy: method and validation. Biomed Opt Express. 2019 Jul 1;10(7):3522–32.
23. Vujosevic S, Muraca A, Alkabes M, Villani E, Cavarzeran F, Rossetti L, et al. Early microvascular and neural changes in patients with type 1 and type 2 diabetes mellitus without clinical signs of diabetic retinopathy. Retina. 2019 Mar;39(3):435–45.
24. Conrath J, Giorgi R, Raccah D, Ridings B. Foveal avascular zone in diabetic retinopathy: quantitative vs qualitative assessment. Eye (Lond). 2005 Mar;19(3):322–6.
25. Bates NM, Tian J, Smiddy WE, Lee W-H, Somfai GM, Feuer WJ, et al. Relationship between the morphology of the foveal avascular zone, retinal structure, and macular circulation in patients with diabetes mellitus. Sci Rep. 2018 Mar 29;8(1):5355.
26. Lavia C, Feldman-Billard S, Erginay A, Guerin O, Virgili G, Gaudric A, et al. Rapid macular capillary loss in patients with uncontrolled type 1 diabetes. Retina. 2019 May 8;
27. Lu Y, Simonett JM, Wang J, Zhang M, Hwang T, Hagag AM, et al. Evaluation of Automatically Quantified Foveal Avascular Zone Metrics for Diagnosis of Diabetic Retinopathy Using Optical Coherence Tomography Angiography. Invest Ophthalmol Vis Sci. 2018 May 1;59(6):2212–21.
28. Sousa DC, Leal I, Moreira S, do Vale S, Silva-Herdade AR, Dionisio P, et al. Optical coherence tomography angiography study of the retinal vascular plexuses in type 1 diabetes without retinopathy. Eye (Lond). 2019 Jul 4;
29. Sun Z, Tang F, Wong R, Lok J, Szeto SKH, Chan JCK, et al. OCT Angiography Metrics Predict Progression of Diabetic Retinopathy and Development of Diabetic Macular Edema: A Prospective Study. Ophthalmology. 2019 Jun 26;
30. AttaAllah HR, Mohamed AAM, Ali MA. Macular vessels density in diabetic retinopathy: quantitative assessment using optical coherence tomography angiography. Int Ophthalmol. 2019 Aug;39(8):1845–59.
31. Balaratnasingam C, Inoue M, Ahn S, McCann J, Dhrami-Gavazi E, Yannuzzi LA, et al. Visual Acuity Is Correlated with the Area of the Foveal Avascular Zone in Diabetic Retinopathy and Retinal Vein Occlusion. Ophthalmology. 2016 Nov;123(11):2352–67.
32. Moein H-R, Novais EA, Rebhun CB, Cole ED, Louzada RN, Witkin AJ, et al. Optical coherence tomography angiography to detect macular capillary ischemia in patients with inner retinal changes after resolved diabetic macular edema. Retina. 2018 Dec;38(12):2277–84.
33. Kapsala Z, Pallikaris A, Mamoulakis D, Moschandreas J, Bontzos G, Tsilimbaris M. Perifoveal capillary network quantification in young diabetic patients with subclinical or no retinopathy. Can J Ophthalmol. 2018 Jun;53(3):199–206.
34. Rosen RB, Andrade Romo JS, Krawitz BD, Mo S, Fawzi AA, Linderman RE, et al. Earliest Evidence of Preclinical Diabetic Retinopathy Revealed Using Optical Coherence Tomography Angiography Perfused Capillary Density. Am J Ophthalmol. 2019 Jul;203 : 103–15.
35. Sacconi R, Casaluci M, Borrelli E, Mulinacci G, Lamanna F, Gelormini F, et al. Multimodal Imaging Assessment of Vascular and Neurodegenerative Retinal Alterations in Type 1 Diabetic Patients without Fundoscopic Signs of Diabetic Retinopathy. J Clin Med. 2019 Sep 8;8(9).
36. Takase N, Nozaki M, Kato A, Ozeki H, Yoshida M, Ogura Y. Enlargement of foveal avascular zone in diabetic eyes evaluated by en face optical coherence tomography angiography. Retina. 2015 Nov;35(11):2377–83.
37. de Carlo TE, Chin AT, Bonini Filho MA, Adhi M, Branchini L, Salz DA, et al. Detection of microvascular changes in eyes of patients with diabetes but not clinical diabetic retinopathy using optical coherence tomography angiography. Retina. 2015 Nov;35(11):2364–70.
38. Gildea D. The diagnostic value of optical coherence tomography angiography in diabetic retinopathy: a systematic review. Int Ophthalmol. 2019 Oct;39(10):2413–33.
39. Ruminski D, Sikorski BL, Bukowska D, Szkulmowski M, Krawiec K, Malukiewicz G, et al. OCT angiography by absolute intensity difference applied to normal and diseased human retinas. Biomedical optics express. 2015;6(8):2738–54.
40. Miwa Y, Murakami T, Suzuma K, Uji A, Yoshitake S, Fujimoto M, et al. Relationship between functional and structural changes in diabetic vessels in optical coherence tomography angiography. Scientific reports. 2016;6 : 29064.
41. Xu X, Chen C, Ding W, Yang P, Lu H, Xu F, et al. Automated quantification of superficial retinal capillaries and large vessels for diabetic retinopathy on optical coherence tomographic angiography. J Biophotonics. 2019 Nov;12(11):e201900103.
42. Munk MR, Giannakaki-Zimmermann H, Berger L, Huf W, Ebneter A, Wolf S, et al. OCT-angiography: A qualitative and quantitative comparison of 4 OCT-A devices. PloS one. 2017;12(5):e0177059.
43. Inanc M, Tekin K, Kiziltoprak H, Ozalkak S, Doguizi S, Aycan Z. Changes in Retinal Microcirculation Precede the Clinical Onset of Diabetic Retinopathy in Children with Type 1 Diabetes Mellitus. Am J Ophthalmol. 2019 Apr 19;
44. Simonett JM, Scarinci F, Picconi F, Giorno P, De Geronimo D, Di Renzo A, et al. Early microvascular retinal changes in optical coherence tomography angiography in patients with type 1 diabetes mellitus. Acta Ophthalmol. 2017 Dec;95(8):751–5.
45. Niestrata-Ortiz M, Fichna P, Stankiewicz W, Stopa M. Enlargement of the foveal avascular zone detected by optical coherence tomography angiography in diabetic children without diabetic retinopathy. Graefes Arch Clin Exp Ophthalmol. 2019 Apr;257(4):689–97.
Štítky
OftalmologieČlánek vyšel v časopise
Česká a slovenská oftalmologie

2020 Číslo 3
- Selektivní laserová trabekuloplastika nesnižuje nitroční tlak více než argonová laserová trabekuloplastika
- Progresi glaukomu je třeba hodnotit strukturálními i funkčními parametry
- Ztráta centrálního vidění po filtrujících operacích glaukomu
- Od PGF-2 alfa-isopropyl esteru k latanoprostu: přehled vývoje Xalatanu
- Compliance u pacientů s glaukomem
Nejčtenější v tomto čísle
- PRES SYNDRÓM
- ZEVNÍ OFTALMOMYIÁZA ZPŮSOBENÁ LARVOU STŘEČKA OESTRUS OVIS
- TRAUMATOLOGIE V OKULOPLASTICKÉ CHIRURGII PŘEHLEDOVÝ ČLÁNEK
- ZMĚNY FOVEÁLNÍ AVASKULÁRNÍ ZÓNY A MAKULÁRNÍ MIKROVASKULATURY V RÁMCI VYŠETŘENÍ OCT ANGIOGRAFIE U MLADÝCH DIABETIKŮ 1. TYPU (PILOTNÍ STUDIE)
Zvyšte si kvalifikaci online z pohodlí domova
Mazová zátka a její řešení
nový kurzVšechny kurzy