-
Medical journals
- Career
MECHANICAL MODEL OF THE CARDIOVASCULAR SYSTEM: DETERMINATION OF CARDIAC OUTPUT BY DYE DILUTION
Authors: Miroslav Ložek; Markéta Horálková; Jan Havlík
Authors‘ workplace: Department of Circuit Theory, Czech Technical University in Prague, Czech Republic
Published in: Lékař a technika - Clinician and Technology No. 2, 2012, 42, 77-80
Category: Conference YBERC 2012
Overview
This paper deals with the experimental implementation of one of the methods for the determination of cardiac output – the dye dilution. Measurement is performed on a mechanical model of the cardiovascular system. It is a specific and experimental measurement intended mainly for educational purposes. It was created a real model of bloodstream at author’s workplace. The model enables to set a pulsatile flow of the fluid with defined pressure and flow rate. This experiment is to demonstrate the principle of determination of cardiac output using the dilution methods. This paper is focused only on measuring by dye dilution method. The measurement results are verified by using a Doppler sonography and volumetric containers.
Keywords:
cardiovascular system, cardiac output, dye dilutionIntroduction
The cardiac output is a very important parameter that helps to diagnose cardiac insufficiency. The determination of cardiac output can be performed using low precision and limited non-invasive methods or high precision but costly and painful invasive methods. [5]
Basic non-invasive methods are Doppler sonography, bio-impedance cardiography and mathematical analysis. Educational demonstration of non-invasive measurement methods is very easy.
Invasive methods of measurement cannot be demonstrated on human being for educational purposes. Based on this fact a mechanical model of the cardiovascular system was developed. The model allows demonstrating the invasive measuring of bloodstream heamodynamic parameters.
This paper focuses primary on the determination of the cardiac output, detailed description of the mechanical model has been published. [1,2]
Principle of dilution methods
The fundament of dilution methods for determination of cardiac output is dilution of the injected substance in the blood. A substance can be special dye or saline with a defined concentration and temperature. There are two types of dilution measurements: the dye dilution method and the thermodilution method. [4,7]
Thermodilution method
This method involves the continuous measurement of the temperature of the pre-cooled blood. The clinical measurement is performed by the Swanz-Ganz catheter. This instrument provides cold saline (4 °C) injected into the blood and then distanced blood temperature measuring.
The result of this process is the thermodilution curve whose mathematic analysis gives value of the Cardiac output. [4,7]
Dye dilution method
The Dye dilution method is based on the measuring of the light absorbance of the dye injected into the blood. The dye (Indo-Cyanine Green) is injected by special pulmonary catheter. Dyed blood is continuously sucked into the absorption photometer.
The result is the dilution curve of the relative concentration of the dye diluted with the blood. Analysis according to equation (1) gives value of the Cardiac Output. [4,7]
Mechanical model of the cardiovascular system
The mechanical model of the cardiovascular system was developed for educational purposes at author’s workplace. It consists of tubes, valves and a mechanical pump (see Fig. 1). [1,2,5,6]
Fig. 1: Overview diagram of the model CVS. 
Various types of the tubes are used for the construction of the arterial, venous and capillary bloodstream. The parameter compliance of the tubes is very important for correct function of the model. Venous vessels are rigid and arterial vessels are elastic. [2]
Hydraulic resistance of the bloodstream is controlled by regulated valve. Aortic valve and minor venous valves are demonstrated by the check valves.
The heart is constructed using a mechanical gear pump. The pump is driven by the pulse mode using special control unit consists of the microprocessor and switching devices. It is possible to choose optional heart rate and heart ratio (power of the pump). [1-3,5]
Experimental measurement of the cardiac output
Selection of the type of the dye and its spectral band
First of all, it was necessary to choose the right type of the dye and to tune a suitable spectral wavelength of the photometer. The photometer was constructed of a pair of the IR diode and IR photodiode (λ = 900 nm). It is given by wide availability of these components. Spectral analysis of different types of the dye proved a suitability of the use the Copper sulfate (see Fig. 2).
Fig. 2: Spectral analysis of the dyes. 
Design of the measuring apparatus
The light source is an infrared light emitting diode with maximum intensity at 900 nm wavelength. For the first experiment it was fully sufficient to supply the light source by constant current. The light passes through arterial vessel and excites the light detector.
The detector is light-sensitive diode with maximum sensitivity at 900 nm wavelength. The photodiode operates at the photovoltaic mode. The output voltage is dependent on light intensity on the detector. The output voltage is amplified by an op-amp and then is sampled into the digital form.
Clean fluid flow does not affect to passage of the infrared beam. The fluid flow with injected dye causes attenuation of the IR beam. It is dependent on concentration of the dye with the fluid.
Signal processing and data analysis
The data processing is performed by the Matlab script. Firstly, the data was loaded and the useful components were separated. For very credible demonstration it is measured also blood pressure curve. The data must be converted to the pressure scale.
The calculation of the cardiac output according to the equation (1) is valid only with relative values of the concentration. Reference values are used to relative scale conversion. The reference minimum is the attenuation of the clean fluid flow. The reference maximum is the attenuation of the dye liquid only.
The relative concentration curve is integrated using the cumulative sum. The proportion of the injected dye volume and cumulative sum of the relative concentration values is equal to the cardiac output.
Results of the measuring
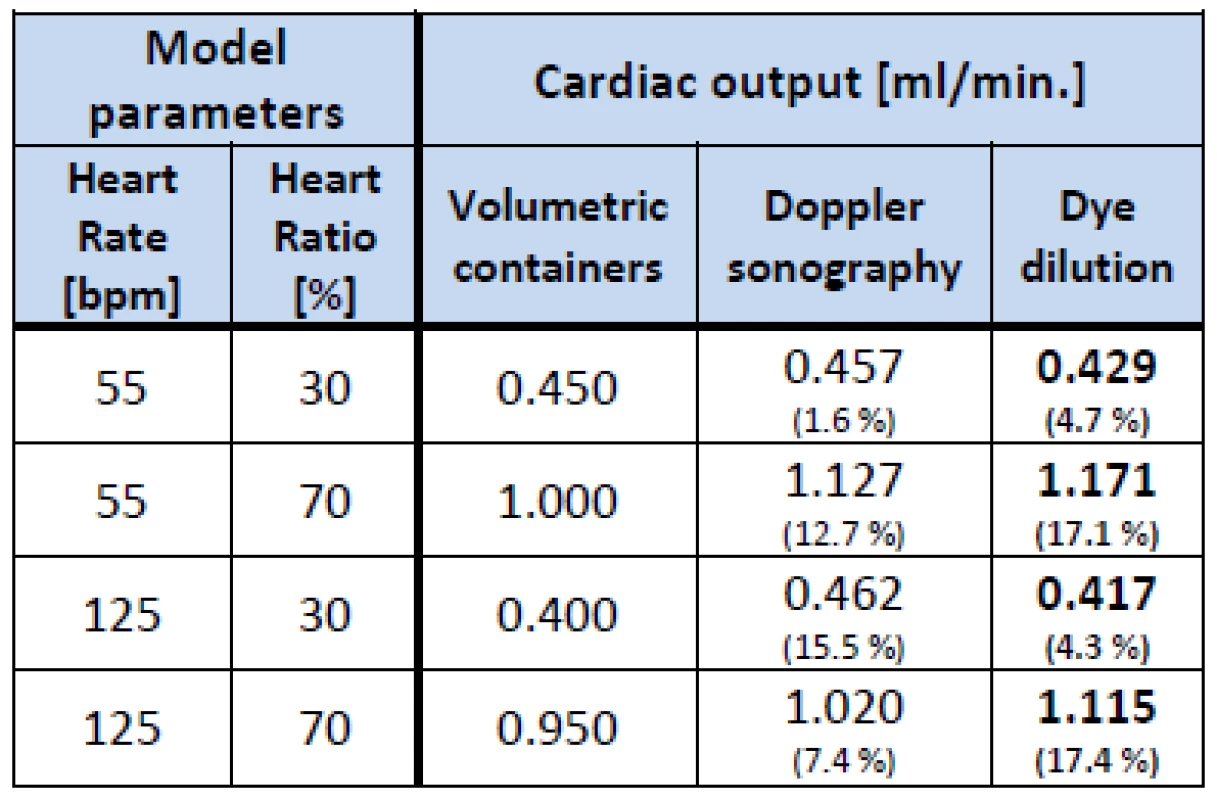
Measuring is usually carried out with various settings of the Heart rate and the Heart Ratio parameters. The validation of the results is ensured by the measuring using the Doppler sonography and the volumetric containers. [1,2] The verification is carried out at the same Heart Rate and Heart Ration parameters. Test measurement was performed tree times for each parameter of the model. The results are shown in Tab. 1.
1. Result of the measuring with verification. 
The Matlab script plots dye dilution curve and pulsatile blood pressure curve to the educational compared (see Fig. 4). On the figure is clearly noticeable time point of the dye injection.Verification methods This paper is not targeted at the detailed description of the model CVS or Doppler sonography measurement. The next section deals only brief description of the verification methods using Doppler sonography and volumetric containers.
Fig. 4: Dye dilution curve vs. blood pressure curve 
Validation using volumetric containers is very simple and indisputable. It is monitored the quantity of the liquid, which passed through the pump per minute. The accuracy of the validation depends on the correct calibration of the measuring scale of the container.
Validation using Doppler sonography is very similar to clinical determination of the cardiac output. The probe is attached on the tube within fluid flow. This leads to record a velocity profile of the fluid flow (see Fig. 5). The integration of this profile and cross section area multiply give a value of the cardiac output. The data processing performs Doppler sonography device itself.
Fig. 5: Example of the measurement of velocity profile on the model CVS by the Doppler sonography device. 
Conclusion
The simple model of the cardiovascular system was developed for educational purposes. The model is able to simulate pulsatile fluid flow. Students can measure invasive pulse pressure curve, cardiac output by invasive and non-invasive methods (the doppler sonography and the dye dilution).
The presented method helps the better and the practical understanding of the invasive measurement of the cardiac output, because it is very similar to the clinical determination of the cardiac output. This exercise learns to apply the theoretical equations into the practical measurement.
Relative accuracy of the measurement of the cardiac output is about 15 %. Moreover, it is possible to watch the difference of laminar and turbulent flow by the sonography method on the model.
Acknowledgement
This work has been supported by the grant No. F3a 2177/2012 presented by University Development Foundation and also by the research program No. MSM 6840770012 of the Czech Technical University in Prague (sponsored by the Ministry of Education, Youth and Sports of the Czech Republic).
Miroslav Ložek
Department of Circuit
Theory Faculty of Electrical Engineering
Czech Technical University in Prague
Technická 2, CZ-166 27 Prague
E-mail: lozekmir@fel.cvut.cz
Phone: +420 224 355 869
Sources
[1] LOŽEK, M.: Model of the Cardiovascular System: Pump Control. In Proceedings of the 16th International Student Conference on Electrical Engineering Prague. 2012. ISBN 978-80-01-05043-9.
[2] LOŽEK, M. - HAVLÍK, J. - HORČÍK, Z.: Návrh mechanického modelu kardiovaskulárního systému : Sborník příspěvků, Letní doktorandské dny. Praha. 2012. ISBN: 978-80 - 01-05050-7.
[3] HAVRÁNEK, A.: Klasická mechanika II. Kontiuum. Karolinum, 2003. ISBN 80-246-0627-5.
[4] BATZEL, J. J. - KAPPEL, F. - SCHNEDITZ, D. - TRAN, H. T.: Cardiovascular and Respiratory Systems: Modeling, Analysis, and Control. 2006. ISBN 978-0898716177.
[5] WESTERHOF, N. - STERGIOPULOS, N. - NOBLE, M. I. M.: Snapshots of Hemodynamics. Basic Science for the Cardiologist, 2005.
[6] COBELLI, C. - CARSIN, E.: Introduction to modeling in physiology and medicine. Academic Press.2008. ISBN:978-0 - 12-160240-6.
[7] LE ROLLE, V. - HERNANDEZ, A. I. - RICHARD, P.Y. - BUISSON, J. - CARRAULT, G.: A Bond Graph Model of the Cardiovascular System. Acta Biotheorica, 2005.
Labels
Biomedicine
Article was published inThe Clinician and Technology Journal

2012 Issue 2-
All articles in this issue
- REAL-TIME PROCESSING OF MULTICHANNEL ECG SIGNALS USING GRAPHIC PROCESSING UNITS
- EYE TRACKING PRINCIPLES AND I4TRACKING® DEVICE
- MODELING OF CIRCULATION DYNAMICS WITH ACAUSAL MODELING TOOLS
- Methodology of thermographic atlas of the human body
- INDUCTION SENSORS FOR MEASUREMENT OF VIBRATION PARAMETERS OF ULTRASONIC SURGICAL WAVEGUIDES
- Linear Modelling of Cardiovascular Parameter Dynamics during Stress-Test in Horses
- MONITORING OF BREATHING BY BIOACOUSTIC METHOD
- APPLICATION OF TIME DOMAIN REFLECTOMETRY FOR CHARACTERIZATION OF HUMAN SKIN
- MATLAB AND ITS USE FOR PROCESSING OF THERMOGRAMS
- IDENTIFICATION OF MAGNETIC NANOPARTICLES BY SQUID BIOSUSCEPTOMETRIC SYSTEM
- EXPORT OF INFORMATION FROM MEDICAL RECORDS INTO DATABASE
- WIRELLES PROBE FOR HUMAN BODY BIOSIGNALS
- Written test on biophysics and medical biophysics at medical faculty, comenius university in Bratislava - a continuous check during two academic years
- VALUATION METHODOLOGY FOR MEDICAL DEVICES
- SETTING EMG STIMULATION PARAMETERS BY MICROCONTROLLER MSP430
- SOFTWARE PACKAGE FOR ELECTROPHYSIOLOGICAL MODELING OF NEURONAL AND CARDIAC EXCITABLE CELLS
- VENTILATOR CIRCUIT MODEL FOR OPTIMIZATION OF HIGH-FREQUENCY OSCILLATORY VENTILATION
- REHABILITATION OF PATIENTS USING ACCELEROMETERS: FIRST EXPERIMENTS
- CHANGES IN BIOIMPEDANCE DEPENDING ON CONDITIONS
- NONINVASIVE SYSTEM FOR LOCALIZATION OF SMALL REPOLARIZATION CHANGES IN THE HEART
- THE STRUCTURAL DESIGN AND USE OF HIGHER FORMS OF CONTROL IN REHABILITATION DEVICES
- MECHANICAL MODEL OF THE CARDIOVASCULAR SYSTEM: DETERMINATION OF CARDIAC OUTPUT BY DYE DILUTION
- AUTOMATIC SEGMENTATION OF PHONEMES DURING THE FAST REPETITION OF (/PA/-/TA/-/KA/) SYLLABLES IN A SPEECH AFFECTED BY HYPOKINETIC DYSARTHRIA
- A PHONEME CLASSIFICATION USING PCA AND SSOM METHODS FOR A CHILDREN DISORDER SPEECH ANALYSIS
- THE REAL-TIME VIZUALIZATION OF PNEUMOGRAM SIGNALS
- USE OF CORRELATION ANALYSIS FOR ONSET EPILEPTIC SEIZURE DETECTION
- FEEDBACK VISUALIZATION INFLUENCE ON A BRAIN-COMPUTER INTERFACE PERFORMANCE
- The Clinician and Technology Journal
- Journal archive
- Current issue
- Online only
- About the journal
Most read in this issue- MECHANICAL MODEL OF THE CARDIOVASCULAR SYSTEM: DETERMINATION OF CARDIAC OUTPUT BY DYE DILUTION
- MATLAB AND ITS USE FOR PROCESSING OF THERMOGRAMS
- VALUATION METHODOLOGY FOR MEDICAL DEVICES
- VENTILATOR CIRCUIT MODEL FOR OPTIMIZATION OF HIGH-FREQUENCY OSCILLATORY VENTILATION
Login#ADS_BOTTOM_SCRIPTS#Forgotten passwordEnter the email address that you registered with. We will send you instructions on how to set a new password.
- Career


