
Relationship between familial combined hyperlipidemia and insulin resistance
Authors:
D. Jackuliaková; H. Vaverková; D. Karásek
Authors‘ workplace:
III. interní klinika Lékařské fakulty UP a FN Olomouc, přednosta prof. MUDr. Vlastimil Ščudla, CSc.
Published in:
Vnitř Lék 2008; 54(11): 1045-1053
Category:
Original Contributions
The paper was presented in part at the “Šobras Day” Conference, Prague, Czech Republic, June 2008
Overview
Background and aims:
Familial combined hyperlipidemia is the most frequent hereditary dyslipidemia, usually associated with insulin resistance. Recently, the diagnostic criteria of familial combined hyperlipidemia were redefined: There should be at least two 1st degree hyperlipidemic relatives with both triglycerides ≥ 1.5 mmol.L–1 and apolipoprotein B ≥ 1.20 g L–1. The aim of this study was to evaluate the relationship between this lipoprotein phenotype and the presence of insulin resistance and to assess the presence of metabolic syndrome.
Methods:
Lipid parameters and parameters associated with insulin resistance were determined in 90 subjects of families with familial combined hyperlipidemia and 38 controls. The members of affected families were further divided into the hyperlipidemic and normolipidemic group.
Results:
The hyperlipidemic group showed only significantly higher fasting proinsulin levels [HL 17,4 ± 1.5 vs NL 12.8 ± 1.4 (p = 0.030); and vs CO 11.1 ± 1.4 (p = 0.003)] in comparison with the normolipidemic and control groups. Differences in fasting insulin [HL 9.40 ± 0.78 vs NL 7.78 ± 0.71 (p = NS); and vs CO 7.30 ± 0.76 (p = NS)], C-peptide [HL 2.56 ± 0.19 vs NL 2.27 ± 0.17 (p = NS); and vs CO 2.07 ± 0.18 (p = NS)], and HOMA [HL 2.16 ± 0.21 vs NL 1.84 ± 0.20 (p = NS); and vs CO 1.69 ± 0.21 (p = NS)] did not reach statistical significance. On the contrary, the members of families with familial combined hyperlipidemia with the presence of metabolic syndrome (NCEP-ATP III) had significantly higher fasting insulin [FCH with MS 12.74 ± 1.42 vs HL without MS 9.21 ± 0.92 (p = 0.030); and vs NL without MS 6.75 ± 0.80 (p = 0.001)], and proinsulin levels [FCH with MS 25.28 vs HL without MS 15.69 ± 1.75 (p = 0.002); and vs NL without MS 11.20 ± 1.51 (p = 0.0001)], and HOMA index [FCH with MS 3.03 ± 0.39 vs HL without MS 2.13 ± 0.25 (p = 0.042); and vs. NL without MS 1.56 ± 0.22 (p = 0.003)] in comparison with their relatives without metabolic syndrome and controls.
Conclusion:
The presence of the metabolic syndrome could detect the most insulin resistant subjects in families with familial combined hyperlipidemia who are at increased risk of cardiovascular disease.
Key words:
familial combined hyperlipidemia – insulin resistance – metabolic syndrome
Introduction
Familial combined hyperlipidemia (FCH) is the most frequent genetically conditioned dyslipidemia affecting 1–2% of the population, increasing the risk of premature cardiovasculardisease and predisposing to early coro-nary death [1–4]. FCH is found in 10–20% of patients surviving premature myocardial infarction [1,2,5]. FCH is supposed to be caused by hepatic apolipoprotein B (apoB) overproduction and relatively impaired clearance of triglyceride-rich lipoproteins (TGRLP). It is associated with an increased concentration of particles containing apoB – i.e. very low-density lipoproteins (VLDL), intermediate density lipoproteins (IDL) and low-density lipoproteins (LDL) [4,6–14]. A decreased concentration of protective high‑density lipoproteins (HDL) is often found [11,15]. Simultaneously, the qualitative changes of lipoproteins include predominance of highly athe-rogenic small, dense LDL particles (LDL III, sdLDL) [4,6,13,16,17]. The affected family members show increased levels of total cholesterol (TC), triglyce-rides (TG) or both parameters. The lipid phenotype can vary substantially within any individual but also among family members (defined according to Frede-rickson classification, types IIa, IIb, IV, rarely also type V) [2,4,7,8]. According to recent studies [8,18,19], the change in insulin resistance (IR) can modify lipid phenotype expression. Prevalence of IR is higher in FCH and more severe in subjects with hypertriglyceridemia (phenotypes IIb and IV) [20–24]. These patients display a typical lipid profile known as the atherogenic lipid trias (low levels of protective HDL, elevated TG, and predominance of sdLDL‑particles) [6,7,25]. The predominance of sdLDL and concomitant elevation of other potentially atherogenic particles (VLDL, IDL) result in increased apoB concentration [13,26,27].
FCH is traditionally diagnosed by TC and/or TG levels above the 90th percentile adjusted for age and gender. Recently it was shown that the diagnosis of FCH on the basis of these diagnostic criteria was inconsistent in 26% of subjects over a 5-year period and thus a new definition of FCH was suggested based on concomitant hypertriglyceridemia ≥ 1.5 mmol.L–1 and apoB ≥ 1.20 g.L–1 [4,13,28,29].
The aim of our study was to evaluate the IR in FCH affected members diagnosed according to this new definition and to evaluate, if the presence of MS can represent a simple tool for detection of the most insulin resistant subjects of FCH families, who are at greatly increased risk of cardiovascular disease. Such evaluation of FCH families has not been previously done.
Subjects and methods
To establish the diagnosis of FCH, following criteria were used: The proband and at least one of his hyperlipidemicrelatives exhibit TG ≥ 1.5 mmol.L–1 and apoB ≥ 1.20 g.L–1 [4,13,28]. Simultaneously, one of them must be affected by early manifestation of atherosclerosis before his 60th birthday. In total, 128 subjects (men: n = 59, mean age 40.2 ± 13.9 years; women: n = 69, meanage 38.1 ± 14.0 years) were examined in the Lipid Center of the Department of Internal Medicine III, University Hospital Olomouc. The study population comprised 90 members of 29 FCH families, and 38 control subjects.
An exclusion criterion was hypoli-pi-de-mic treatment during the last 6 weeks.Therefore, some probands could not be included in the study because hypolipidemic therapy cannot be discontinued due to the presence of clinical manifestations of atherosclerosis. In those cases, the family identification was derived from lipid values prior to the therapy and these subjects were not included. In the examined subjects,possible secondary causes of hyperli-pidemia were excluded (diabetes mellitus, hypothyroidism, liver and kidney diseases). None of the examined subjects was homozygous for the apoE2 allele and none of them had tendon xanthomas. The design of the study was approved by the Ethics Committee of the University Hospital Olomouc and the Faculty of Me-dicine and Dentistry, Palacky University Olomouc; an informed consent was obtained from all participants. The population under study was divided into three groups: The hyperlipidemic (HL) group (n = 41, mean age 46.8 ± 12.1 years, men/women = 23/18) comprised FCH probands and their hyperlipidemic first-degree relatives (i.e. re-latives with TG ≥ 1.5 mmol.L–1 and apoB ≥ 1.20 g.L–1). The normolipi-demic members of FCH families (NL) did not display any above-mentioned criteria for FCH hyperlipidemic subjects – they had either TG < 1.5 mmol.L–1or at least apoB < 1.2 g.L–1 (n = 49, mean age 31.7 ± 10.7 years, men/wo-men = 20/29). The group of controls (CO) comprised spouses of the affected subjects and also healthy individuals with negative family history of hyperlipidemia and early atherosclerosis (n = 38, mean age 40.2 ± 14.8 years, men/women = 16/22).
All participants were examined by a physician with emphasis on the following: gender, age, smoking habits, history of arterial hypertension (HN), premature clinical manifestation of atherosclerosis, and other clinically important data. Body mass index (BMI), waist circumference, systolic and diastolic blood pressure (SBP, DBP) were determined in all subjects. SBP and DBP were measured three times under resting conditions using a mercury tonometer; the final value was calculated as the mean of the last two BP values. Venous blood samples were drawn in the morning after 12-hour fasting. Plasma concentrations of total cholesterol, HDL‑cholesterol and triglycerides were determined by the enzymatic method (Hitachi 917 analyzer, Roche, Basel, Switzerland). Concentrations of apoB and lipoprotein (a) [Lp(a)] were determined by the immunoturbidimetric method using specific antibodies [Tina-Quant apoB-kit – version 2; Lipoprotein (a) TQ SYS 917, Roche, Basel, Switzerland]. We measured and calculated markers of IR (fasting glycemia, insulin, HOMA), and associated parameters (C-peptide, proinsulin) which represent secretion of insulin and were interpreted to reflect a compensatory response to an underlying insulin‑resistant state. To simplify this text, the term “markers of IR” is used for both, parameters of IR, and parameters of insulin secretion. Glucose concentrations (Glc) were measured enzymatically (Glucose GOD-PAP SYS 917 kit, Roche, Basel, Switzerland).Plasma concentrations of insulin (ins) and C-peptide (Cp) were determined by the IRMA method (Insulin and C-peptide kits, Immunotech, Marseille, France). Concentrations of proinsulin (pins) were assessed by the RIA method (Proinsulin kit, DRG Instruments GmbH, Marburg, Germany). Levels of tissue activator plasminogen (tPA) and plasminogen activator inhibitor I (PAI‑1) were determined by the ELISA method (Technoclon). The following values were calculated: LDLc concentrations for subjects with TG < 4.5 mmol.L–1 (n = 119) according to the Friedewald formula, LDLc = TC – (HDLc + TG/2.2) [30]; nonHDL‑cholesterol concentrations (nonHDLc), nonHDLc = TC – HDLc [31,32]; atherogenic index of plasma (AIP), AIP = log (TG/HDLc) [33,34]; homeo-stasis model assessment (HOMA), HOMA = fasting glucose × fasting insulin level/22.5 [35]; and body mass index (BMI), BMI = weight/height2. Metabolic syndrome (MS) presence was assessed using the NCEP-ATP III definition [36] as for this definition we have the data from the Czech population (Cifkova et al, unpublished data).
Statistical evaluation
Comparison of individual groups was made by the ANOVA method after age and gender adjustment; and age, gender, BMI and waist circumference adjustment, using the SPSS software for Windows, version 12.0 (Chicago, Illinois USA). The parameters with shifted distribution were log-transformed before the statistical analysis (TG, insulin, proinsulin, C-peptide, HOMA). Multivariate regression analysis with HOMA as dependent variable was used to assess independent association of HOMA with other confounding factors. Relation between markers of IR and with further parameters was assessed using the simple linear regression. Probabi-lity values of p < 0.05 were considered as statistically significant.
Results
The mean values and standard deviations of the studied parameters after age and gender adjustment are given in tab. 1. By definition, the HL group had significantly higher levels of lipid parameters defining FCH (TC, TG, apoB) as compared to the NL and CO groups. Moreover, the HL group also exhibited more atherogenic values of other lipoproteins and derived parameters [significantly higher concentrations of LDLc, nonHDLc, Lp(a), higher level of AIP, and lower concentrations of HDLc]. We anticipated finding of higher parameters linking to IR in the HL group compared to the CO group. Nevertheless, significant elevation was found only in proinsulin (fig. 1). There were some differences in concentration of fasting insulinemia, C-peptide and HOMA index among the three groups, but they did not reach statistical significance. The fasting glucose concentrations were similar for all three groups.
![Fig. 1. Comparison of the mean proinsulin levels in FCH subjects and controls [mIU.L<sup>–1</sup>].](https://pl-master.mdcdn.cz/media/image/103a2082e7d297835f89ec5abbbb01a2.png?version=1537792389)

The tab. 1 shows significantly higher BMI and waist circumference in HL compared to NL and CO group. After age, gender, BMI, and waist circumference adjustment, we expected some change in significance levels. Nevertheless, the referred adjustment did not induce any important impact on the statistical significance (tab. 2). Association of IR markers with other followed up parameters for members of FCH families is summarized in tab. 3. Evaluation of independent association of HOMA index with other parameters under study for members of FCH families is presented in tab. 4.


The level of SBP was higher in the HL subgroup then in the CO and NL subjects although this was insignificant difference. But significant differences in DBP were recorded between the HL and CO subjects, and also between NL and CO subjects.
Impaired fibrinolysis, as determined by significantly increased levels of PAI‑1 and tPA, was detected in HL when compared to CO. Interestingly, NL subjects from FCH families also differed from CO group in PAI‑1 levels.
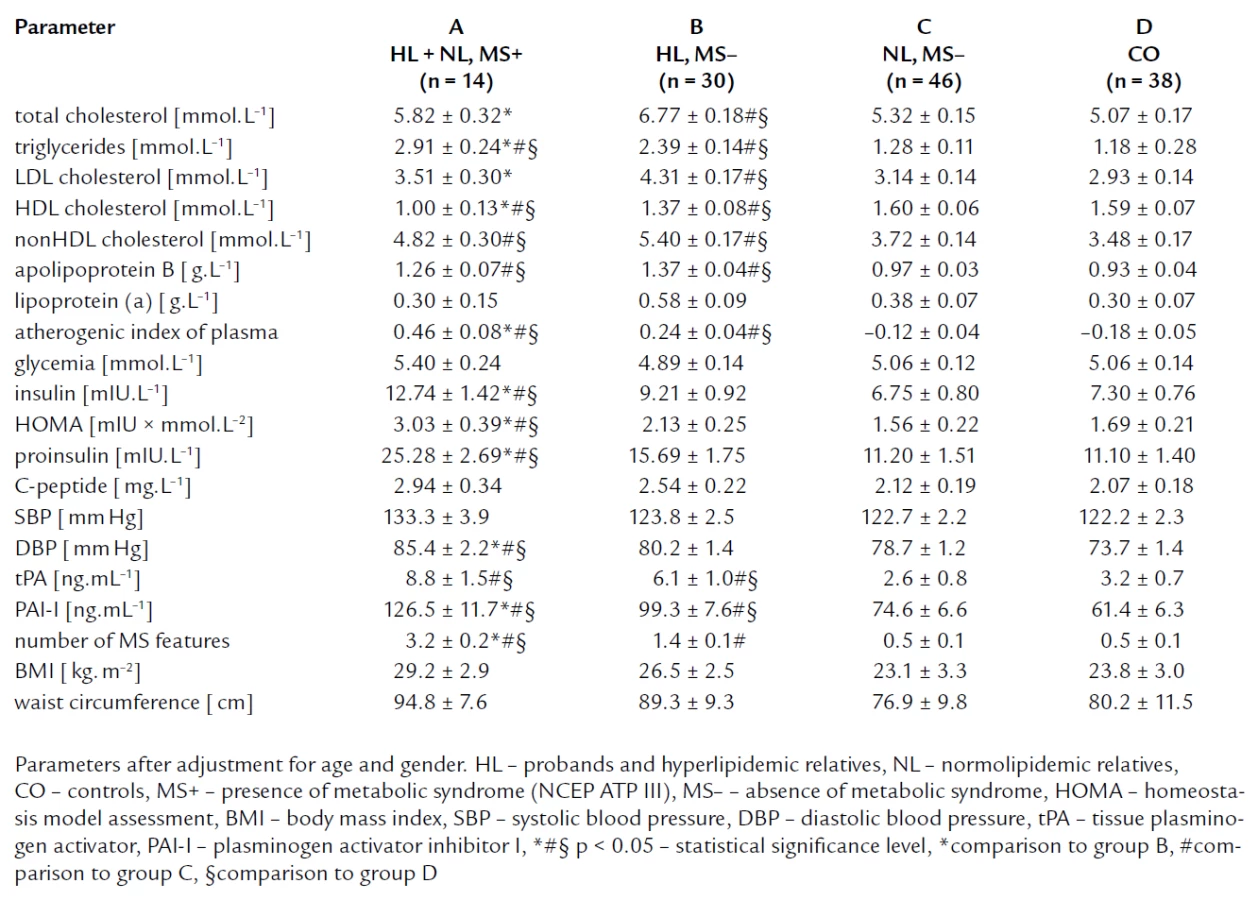
To estimate the impact of metabolic syndrome on markers of IR, we divided members subjects to these groups: The group A composed of FCH members with metabolic syndrome (11 HL and 3 NL subjects, n = 14), the group B comprised HL subjects without metabolic syndrome (n = 30), the group C formed by normolipidemic relatives without metabolic syndrome (n = 46), and the group D formed by controls (n = 38) (tab. 5). Compared to group B, C and controls, group A showed the significantly higher levels of insulin, proinsulin and HOMA index, and C-peptide concentration was insignificantly higher in group A. Fasting glycemia concentrations were similar in all four groups. We found no significant differences in IR parameters between FCH members without MS and controls. Further, group A had the highest concentration of triglycerides, the lowest concentration of HDL cholesterol, and the highest blood pressure compared to group B and C. It was in accordance with the definition of MS. Moreover, we have found that group B showed higher total cholesterol and LDL cholesterol level than group A.
Discussion
FCH is the most important hereditary familial dyslipidemia resulting in premature atherosclerosis with negative impact on life quality and survival of the affected subject. Concentrations of lipids and lipoproteins in FCH usually do not reach extreme values as in familial hypercholesterolemia and are often just over 90th percentile of a given population [37]. Thus, it is probable that other factors beyond hyperlipidemia play a role in the premature development of atherosclerosis in affected FCH subjects.
Hyperlipidemia in FCH is fully expressed in adulthood [2], usually at about 30 years of age. As mentioned above, the mean age of subjects included in the HL group (46.8 ± 12.1 years) was higher than those of the NL group (31.7 ± 10.7 years). Therefore, it is expected that with increasing age, the lipid phenotype may continue to develop in some NL individuals.
It is well known that FCH displays also intraindividual differences in lipid profile related to ageing and weight gain. Increased BMI and waist circumference, the well‑established features of metabolic syndrome and IR, representing mass of visceral adipose tissue (VAT), result in elevation of triglycerides and in the typical conversion of lipid profile into the atherogenic lipid triad [13,20,21]. This was first described by Brunzell et al [7] and Vaverkova et al [38]. Similar to other authors, we also found significant interindividual differences in phenotype expression of lipid profile (defined according to Frederickson) among FCH family members [2,4,6] – not shown in this paper.
HL subjects from FCH families showed decreased concentration of HDL cholesterol, higher triglycerides (TG ≥ 1.5 mmol.L–1), and high values of apoB, which indicates the presence of sdLDL subfraction. The AIP was higher in HL group compared to NL and CO group. AIP is an important marker of the LDL and HDL particles quality and it represents an important risk factor of atherosclerosis [33]. Elevated levels of AIP in HL group reflect predominance of small dense LDL, and less atheroprotective HDL. Significantly higher AIP level in NL compared to CO group implies that the lipoprotein phenotype of some NL subjects is going to develop in future.
Increased IR in FCH families has been described several times using a spectrum of methods – more or less sophisticated [hyperinsulinemic euglycemic clamp with indirect calorimetry, glucose tolerance test, fasting and post‑load insulin and glucose levels, free fatty acid (FFA) levels, HOMA] [8,9,19,21,22,39,40].
Pihlajamaki et al measured insulin sensitivity by the hyperinsulinemic euglycemic clamp with indirect calorimetry in nondiabetic FCH family members with various lipoprotein phenotypes. They found lower rates of insulin‑stimulated glucose oxidation in members of FCH families with normolipidemic and hypertriglyceridemic phenotype, and in members with combined hyperlipididemic phenotype compared to subjects with hypercholesterolemic phenotype and controls. Also the rates of nonoxidative glucose disposal were lower in hypertriglyceridemic and in those with combined hyperlipidemic phenotype. FCH family members had higher free fatty acid levels compared to controls [19].
Karjalainen et al investigated insulin action by applying the hyperinsulinemic euglycemic clamp technique with indirect calorimetry in FCH families. They showed higher IR and impaired insulin’s suppressive effect on FFA levels in patients with FCH – both in their hyperlipidemic and normolipidemic relatives [9].
Ascaso et al assessed IR in FCH measuring baseline and post glucose tolerance test concentrations of glucose and plasma insulin, the area under the curve (AUC) of insulin secretion [18], and the area under curve of glucose and free fatty acids [39,40]. They found the relationship of IR with the lipoprotein phenotype (IIa, IIb, IV) in FCH, and recorded significantly lower Si values (the peripheral sensitivity to insulin index) in the three FCH lipoprotein phenotypes, being more severe in subjects with hypertriglyceridemia [18]. In their previous study, they concluded that obesity (BMI ≥ 27 kg. m–2) exacerbates the hyperglycemia, hyperinsulinemia and blood pressure values in FCH patients [39]. But on the other hand, FCH subjects showed a higher prevalence of hyperinsulinemia, even in the absence of obesity [41].
Cabezas et al divided FCH children into three tertiles on the basis of fasting plasma TG. Individuals in the highest tertile (TG > 2.5 mmol.L–1) had increased fasting plasma insulin concentrations and prolonged and exaggerated postprandial plasma concentrations of free fatty acids (FFA) compared to individuals in the lowest tertile and controls. Metabolism of FFA depends on insulin and therefore plasma levels of NEFA reflect IR. Moreover, the authors published that FCH children in the highest triglyceridemic tertile showed significantly higher BMI, systolic blood pressure, total cholesterol and apoB concentrations, and lower HDL‑cholesterol levels [22].
Assessing HOMA index, Veerkamp found that FCH subjects were significantly more insulin resistant compared to controls and also to normolipidemic relatives, even after correction for sex, age, and BMI. IR as a characteristic feature of FCH could not be fully explained by increased BMI and was associated with (change in) lipid phenotype expression [21].
Delawi et al found higher fasting insulin and HOMA index in FCH patients compared to healthy controls [8].
Van der Kallen et al found that increments of BMI, waist circumference, and waisthip ratio (WHR) increased the frequency of hyperlipidemia in FCH relatives and their spouses. Predominant expression of hypertriglyce-ridemia was observed with higher categories of WHR in FCHL relatives but not in their spouses [20]. All these studies were done in FCH families diagnosed according to the old definition (based on TC and TG 90th percentile values).
In the Spanish study, Martinez-Hervás et al found no differences between groups in systolic, but also diastolic blood pressure. They found significantly higher baseline and postload insulin levels in glucose tolerance test in FCH patients with acute myocardial infarction (AMI) compared to FCH patients without AMI and controls [42].
In the Greek study, the prevalence of metabolic syndrome was also higher in the subjects with FCH than in the control group [43].
Van der Vleutten et al studied adiponectin and other parameters in FCHfamilies. Hyperlipidemic patients from FCH families were older and had significantly higher BMI, waist circumference, total and LDL‑cholesterol concentrations, significnatly lower HDL‑cholesterol levels, and significantlyhigher insulin resistance that was reflected by higher HOMA index and K value [44].
In comparison with above mentioned studies, we found only significantly higher fasting proinsulin in HL members of FCH families. Other IR parameters did not differ significantly from control subjects. Elevated concentration of plasma proinsulin is the marker of compensatory escalated insulin secretion and therefore is indirect marker of presence of IR which could be probably confirmed by more sophisticated methods than HOMA index. Furthermore, exclusion of subjects with hypolipidemic therapy due to the clinical manifestation of atherosclerosis could also influence our results as these patients are usually the most insulin resistant.
In agreement with other authors, werecorded the highest BMI and waist circumference in HL subjects [4,11,12, 20,21,45]. We presumed to confirm the impact of BMI and waist circumference on parameters of IR as well as already mentioned Karjalainen, Pihlajamaki and Ascaso [9,19,39]. In multivariate analysis, we did not found the independent association of HOMA with BMI and waist circumference. This finding suggests that increased IR and proatherogenic potential in FCH could not be elucidated just by larger mass of visceral adipose tissue (VAT) which is a well‑recognized factor associated with IR. In multiple regression analysis with HOMA as dependent variable, HOMA was independently associated only with TG (tab. 5).
Further, in accordance with previous studies [46–51], we found significantly elevated levels of PAI‑1 and tPA in HL subjects. Impaired fibrinolysis, assessed by levels of tPA and PAI‑1, is supposed to predict coronary artery disease (CAD) events and stroke [48,49,52] and is associated with IR [46,50,53]. This indicates presumed IR in HL subgroup although in our study, this hypothesis was not confirmed by measuring IR parameters except fasting proinsulin as already mentioned above.
We found higher TC and LDL cholesterol levels in hyperlipidemic subjects without metabolic syndrome (group B) compared to their hyperlipidemic relatives with metabolic syndrom (group A). This fact could indicate that in group B, atherosclerosis risk could be attributed to LDL cholesterol meanwhile in group A, IR and probably sdLDL, IDL and VLDL particles could participate more in atherosclerosis.
The prevalence of metabolic syndrome in women of our FCH families was similar as in the Czech population [37] of this age, in FCH men was even less frequent. We confirmed that me-tabolic syndrome in FCH families aggravated IR (fig. 2) and could explain nearly completely the presence of IR in FCH family members. Thus the pre-sence of metabolic syndrome appears to be a simple tool for detection of the most insulin resistant subjects of FCH families, who are at greatly increased risk of cardiovascular disease. This is important appreciating that current trends in occurrence in Czech Republic are alarming [54].

Conclusions
Patients with familial combined hyperlipidemia display various dyslipidemic phenotypes that can vary substantially within any subject but also among relatives. Increased body weight and waist circumference, essential features of MS, aggravate hypertriglyceridemia and IR, and convert the lipid phenotype to classical atherogenic triad (increased TG, decreased HDLc, together with elevated apoB concentration). Nevertheless, IR in FCH could not be explained only by increased BMI or visceral adipose tissue. In our study, FCH subjects with MS showed higher IR. Therefore, like in general population, the assessment of metabolic syndrome in FCH subjects could serve as a simple tool for detection of the most insulin resistant subjects with increased risk of premature manifestation of atherosclerosis.
Acknowledgements
We thank Mgr. Jana Zapletalova, Dr., RNDr. Milena Krskova, Palacky University, Olomouc, Czech Republic, for assessing the statistical significance of the results.
Supported by the IGA Ministry of Health CR grant number NR/9068-3.
MUDr. Dagmar Jackuliaková
www.fnol.cz
e‑mail: dagjack@centrum.cz
Doručeno do redakce: 23. 6. 2008
Přijato po recenzi: 4. 8. 2008
Sources
1. Goldstein JL, Hazzard WR, Schrott HG. Hyperlipidemia in coronary heart disease. I. Lipid levels in 500 survivors of myocardial infarction. J Clin Invest 1973; 52 : 1533–1543.
2. Goldstein JL, Schrott HG, Hazzard WR. Hyperlipidemia in coronary heart disease. II: Genetic analysis of lipid levels in 176 families and delineation of a new inherited disorder, combined hyperlipidemia. J Clin Invest 1973; 52 : 1544–1568.
3. Goldstein JL, Schrott HG, Hazzard WR. Hyperlipidemia in coronary heart disease. III: Evaluation of lipoprotein phenotypes of 156 genetically defined survivors of myocardial infarction. J Clin Invest 1973; 52 : 1569–1577.
4. Veerkamp MJ, de Graaf J, Hendriks JCM et al. Nomogram to diagnose familial combined hyperlipidemia on the basis of results of a 5-year follow‑up study. Circulation 2004; 109 : 2980–2985.
5. Hopkins PN, Heis G, Ellison RC et al. Coronary artery disease risk in familial combined hyperlipidemia and familial hypertriglyceridemia. Circulation 2003; 108 : 519–523.
6. Ayyobi AF, McGladdery SH, McNeely MJ et al. Small, dense LDL and elevated apolipoprotein B are the common characteristics for the three major lipid phenotypes of familial combined hyperlipidemia. Arterioscler Thromb Vasc Biol 2003; 23 : 1289–1294.
7. Brunzel JD, Albers JJ, Chait A et al. Plasma lipoproteins in familial combined hyperlipidemia and monogenic familial hypertriglyceridemia. J Lipid Res 1983; 24 : 147–155.
8. Delawi D, Meijssen S, Cabezas S. Intra-individual variations of fasting plasma lipids, apolipoproteins and postprandial lipemia in familial combined hyperlipidemia controls. Clinica Chimica Acta 2003; 328 : 139–145.
9. Karjalainen L, Pihlajamäki J, Karhapää P et al. Impaired insulin‑stimulated glucose oxidation and free fatty acid suppression in patients with familial combined hyperlipidemia: A precursor defect for dyslipidemia? Arterioscler Thromb Vasc Biol 1998; 18 : 1548–1553.
10. Keulen ETP, Kruijshoop M, Schaper NC et al. Increased intima-media thickness in familial combined hyperlipidemia associa-ted with apolipoprotein B. Arterioscler Thromb Vasc Biol 2002; 22 : 283–288.
11. Pischon T, Girman CJ, Sacks FM et al. Non-high‑density lipoprotein cholesterol and apolipoprotein B in the prediction of coronary heart disease in men. Circulation 2005; 112 : 3375–3383.
12. Porkka KVK, Nuotio I, Pajukanta P et al. Phenotype expression in familial combined hyperlipidemia. Atherosclerosis 1997; 133 : 245–253.
13. Veerkamp MJ, de Graaf J, Bredie SJH et al. Diagnosis of familial combined hyperlipidemia based on lipid phenotype expression in 32 families. Arterioscler Thromb Vasc Biol 2002; 22 : 274–282.
14. Venkatesan S, Cullen P, Pacy P et al. Stable isotopes show a direct relation between VLDL apoB overproduction and serum triglyceride levels and indicate a metabolically and biochemically coherent basis for familial combined hyperlipidemia. Arterioscler Thromb Vasc Biol 1993; 13 : 1110–1118.
15. Soro A, Jauhianinen M, Ehnholm C et al. Determinants of low HDL levels in familial combined hyperlipidemia. J Lipid Res 2003; 44 : 1536–1544.
16. Georgieva AM, van Greevenbroek MMJ, Krauss RM et al. Subclasses of low-density lipoprotein and very low-density lipoprotein in familial combined hyperlipidemia: Relationship to multiple lipoprotein phenotype. Arterioscler Thromb Vasc Biol 2004; 24 : 744–749.
17. Vakkilainen J, Jauhiainen M, Ylitalo K et al. LDL particle size in familial combined hyperlipidemia: Effects of serum lipids, lipoproetin‑modifying enzymes, and lipid transfer proteins. J Lipid Res 2002; 43 : 598–603.
18. Ascaso JF, Real JT, Merchante A et al. Lipoprotein phenotype and insulin resistance in familial combined hyperlipidemia. Metabolism 2000; 49 : 1627–1631.
19. Pihlajamaki J, Karjalainen L, Karhapaa L et al. Impaired free fatty acid suppression during hyperinsulinemia is a characteristic finding in familial combined hyperlipidemia, but insulin resistance is observed only in hypertriglyceridemic patients. Arterioscler Thromb Vasc Biol 2000; 20 : 164–170.
20. van der Kallen CJ, Voors-Pette C, de Bruin TWA. Abdominal obesity and expression of familial combined hyperlipidemia. Obes Res 2004; 12 : 2054–2061.
21. Veerkamp MJ, de Graaf MJ, Stalenhoef AFH. Role of insulin resistance in familial combined hyperlipidemia. Arterioscler Thromb Vasc Biol 2005; 25 : 1026–1031.
22. Cabezas MC, de Bruin TWA, de Valk HW et al. Impaired fatty acid metabolism in familial combined hyperlipidemia. A mechanism associating hepatic apolipoprotein B overproduction and insulin resistance. J Clin Invest 1993; 92 : 160–168.
23. van der Kallen CJH, Voors-Pette C, Bouwman CG et al. Evidence of insulin resistant lipid metabolism in adipose tissue in familial combined hyperlipidemia, but not type 2 diabetes mellitus. Atherosclerosis 2002; 164 : 337–346.
24. Purnell JQ, Kahn SE, Schwartz RS et al. Relationship of Insulin Sensitivity and ApoB Levels to Intra-abdominal Fat in Subjects With Familial Combined Hyperlipidemia. Arterioscler Thromb Vasc Biol 2001; 24 : 744–749.
25. Walldius G, Jungner I. Apolipoprotein B and apolipoprotein A-I: risk indicators of coronary heart disease and targets for lipid-modifying therapy. J Intern Med 2004; 255 : 188–205.
26. Janus ED, Nicoll AM, Turner PR et al. Kinetic bases of the primary hyperlipidaemias: studies of apolipoprotein B turnover in genetically defined subjects. Eur J Clin Invest 1980; 10 : 161–172.
27. Demacker PN, Veerkamp MJ, Bredie SJ et al. Comparison of the measurement of lipids and lipoproteins versus assay of apolipoprotein B for estimation of coronary heart disease risk: a study in familial combined hyperlipidemia. Atherosclerosis 2000; 153 : 483–490.
28. Sniderman AD, Cabezas MC, Ribalta J et al. A proposal to redifine familial combined hyperlipidaemia – Third workshop on FCHL held in Barcelona from 2 to 5 may 2001, during the Scientific Sessions of the European Society for Clinical Investigation. Eur J C Invest 2002; 32 : 71–73.
29. de Graaf J, van der Vleuten G, Stalenhoef AF. Diagnostic criteria in relation to the pathogenesis of familial combined hyperlipidemia. Semin Vasc Med 2004; 4 : 229–240.
30. Friedewald WT, Levy RI, Fredrickson DS. Estimation of the concentration of low-density lipoprotein cholesterol in plasma, without use of the preparative ultracentrifuge. Clin Chem 1972; 6 : 499–502.
31. Pischon T, Girman CJ, Sacks FM et al. Non-high‑density lipoprotein cholesterol and apolipoprotein B in the prediction of coronary heart disease in men. Circulation, 2005; 112 : 3375–3383.
32. Jiang R, Schulze MB, Li T et al. Non-HDL cholesterol and apolipoprotein B predict cardiovascular disease events among men with type 2 diabetes. Diabetes Care 2004; 27 : 1991–1997.
33. Dobiášová M, Frohlich J. The plasma parameter log (TG/HDL‑C) as an atherogenic index: correlation with lipoprotein particle size and esterification rate in apoB‑lipoprotein‑depleted plasma (FER/HDL). Clin Biochem 2001; 34 : 583–588.
34. Dobiášová M. Ahterogenic index of plasma (log (triglycerides/HDL‑cholesterol): theoretical and practical implications. Clin Chem 2004; 50 : 1113–1115.
35. Matthews DR, Hosker JP, Rudenski AS et al. Homeostasis model assessment: insulin resistance and beta‑cell function from fasting plasma glucose and insulin concentrations in man. Diabetologia 1985; 28 : 412–419.
36. Executive summary of the third report of the National Cholesterol Education Program (NCEP) expert panel on detection, evaluation, and treatment of high blood cholesterol in adults (Adult Treatment Panel III). JAMA 2001; 285 : 19.
37. Cífková R, Škodová Z, Lánská V et al. Longitudinal trends of total and HDL cholesterol in a representative population sample in the Czech Republic. Vnitř Lék 2000; 46 : 501–505.
38. Vaverková H, Weinbergová O, Horčička V et al. Familial combined hyperlipidemia. Part I. Lipid values and the lipoprotein pattern. Acta Univ Palacki Olomuc, Fac Med 1986; 113 : 193–216.
39. Ascaso JF, Sales J, Merchante A et al. Influence of obesity on plasma lipoproteins, glycaemia and insulinaemia in patients with familial combined hyperlipidaemia. Int J Obes 1997; 21 : 360–366.
40. Ascaso JF, Merchante A, Lorente RI et al. A study of insulin resistance using the minimal model in nondiabetic familial combined hyperlipidemic patients. Metabolism 1998; 47 : 508–513.
41. Ascaso JF, de Graaf J, Stalenhoef AFH. Role of insulin resistance in familial combined hyperlipidemia. Arterioscler Thromb Vasc Biol 2005; 25 : 1026–1031.
42. Martinez-Hervás S, Real JT, Priego A et al. Familial combined hyperlipidemia, metabolic syndrome and cardiovascular disease. Rev Esp Cardiol 2006; 59 : 1195–1198.
43. Skoumas J, Papadimitriou L, Pitsavos C et al. Metabolic syndrome prevalence and characteristics in Greek adults with familial combined hyperlipidemia. Metabolism 2007; 56 : 135–141.
44. Van der Vleuten GM, van Tits LJH, den Heijer M et al. Decreased adiponectin levels in familial combined hyperlipidemia patients contribute to the atherogenic lipid profile. Journal of Lipid Research 2005; 46 : 2398–2404.
45. Mills JD, Mansfield MW, Grant PJ. Tissue plasminogen activator, fibrin D‑dimer, and insulin resistance in the relatives of patients with premature coronary artery disease. Arterioscler Thromb Vasc Biol 2002; 22 : 704–709.
46. Jeng JR, Sheu WH, Jeng CY et al. Impaired fibrinolysis and insulin resistance in patients with hypertension. Am J Hypertens 1996; 9 : 484–490.
47. Georgieva AM, Cate HT, Keulen ET et al. Prothrombotic markers in familial combined hyperlipidemia: evidence of endothelial cell activation and relation to metabolic syndrome. Atherosclerosis 2004; 175 : 345–351.
48. Andersen P. Hypercoagulability and reduced fibrinolysis in hyperlipidemia: relationship to the metabolic cardiovascular syndromee. J Cardiovasc Pharmacol 1992; 20 (Suppl 8): 29–31.
49. Hamsten A, Wiman B, de Faire U et al. Increased plasma levels of a rapid inhibitor of tissue plasminogen activator in young survivors of myocardial infarction. N Engl J Med 1985; 313 : 1557–1563.
50. Kaba NK, Francis CW, Moss AJ et al. Effects of lipids and lipid-lowering therapy on hemostatic factors in patients with myocardial infarction. Thromb Haemost 2004; 2 : 718–725.
51. Karásek D, Vaverková H, Halenka M et al. Endothelial haemostatic markers in members of families with familial combined hyperlipidemia. Thromb Res 2008 [Epub ahead of print].
52. Jansson JH, Olofsson BO, Nilsson TK. Predictive value of tissue plasminogen activator mass concentration on long‑term mortality in patients with coronary artery disease. A 7-year follow‑up. Circulation 1993; 88 : 2030–2034.
53. Lindahl B, Asplund K, Eliasson M et al. Insulin resistance syndrome and fibrinolytic activity: the Northern Sweden MONICA study. Int J Epidemiol 1996; 25 : 291–299.
54. Souček M. Úvod do problematiky metabolického syndromu. Vnitř Lék 2005; 51 : 48–52.
Labels
Diabetology Endocrinology Internal medicineArticle was published in
Internal Medicine

2008 Issue 11
Most read in this issue
- Hypoglycaemic periodic paralysis in hyperthyroidism patients
-
Langerhans cell histiocytosis in adult patients – a disease with many faces
Experience of a centre and an overview of the disease symptoms - The safety of long-term administration of losartan in current clinical practice: a non-intervention NCT-CZ 14/04/LOZ study
- Place of inhibin B investigation in clinical andrological praxis