
Machine learning using speech utterances for parkinson disease detection
Authors:
Ondřej Klempíř; Radim Krupička
Authors‘ workplace:
Department of Biomedical Informatics, Faculty of Biomedical Engineering, Czech Technical University in Prague, Kladno, Czech Republic
Published in:
Lékař a technika - Clinician and Technology No. 2, 2018, 48, 66-71
Category:
Overview
Pathophysiological recordings of patients measured from various testing methods are frequently used in the medical field for determining symptoms as well as for probability prediction for selected diseases. There are numerous symptoms among the Parkinson’s disease (PD) population, however changes in speech and articulation are potentially the most significant biomarker. This article is focused on PD diagnosis classification based on their speech signals using pattern recognition methods (AdaBoost, Bagged trees, Quadratic SVM and k-NN). The dataset investigated in the article consists of 30 PD and 30 healthy controls (HC) individuals voice measurements, with each individual being represented with 2 recordings within the dataset. Training signals for PD and HC underwent an extraction of relatively well-discriminating features relating to energy and spectral speech properties. Model implementations included a 5-fold cross validation. The accuracy of values obtained by employing the models was calculated using a confusion matrix. The average value of the overall accuracy = 82.3% and averaged AUC = 0.88 (min. AUC = 0.86) on the available data.
Keywords:
Parkinson's disease, speech, machine learning, digital biomarker, classification
Introduction
Neuroinformatics is a rapidly developing inter-disciplinary field which provides an enormous amount of data to be classified, evaluated and interpreted. Utilizing exploratory data analysis methods and machine learning methods is essential in evaluating clinical data in medicine. This analysis remains a major challenge because each new system has specific requirements [1–4]. A separate chapter in this regard is Parkinson's disease (PD).
PD is a commonly occurring neurodegenerative disease in 2 out of 100 people over 60 years of age. Its cause is directly related to the loss of dopamine-forming nerve cells in a part of the brain called substantia nigra, which is a part of the complex of basal ganglia [5]. Speech is an important indicator of motor functions and movement coordination, while being extremely sensi-tive to the central nervous system’s involvement [6].
Major movement symptoms of PD, such as tremor, stiffness, slowing, posture and gait disturbances, are only manifested when a significant portion of the brain cells are affected, while speech changes can be prevented in the pre-long term, up to ten years before diagnosis [7]. Early diagnosis by accurately identifying speech impairment can be critical to determining an early PD prognosis and deployment of adequate treatment.
One of the tasks used to assess motor skills of articulation is rhythmic and periodical repetition of syllable /pa/ by the subject (like a metronome). Previous studies have shown that patients with PD have a reduced ability to maintain a steady pace when repeating syllables, and in addition they tend to accelerate the rhythm over time [8–11]. However, during syllable repetitions, other PD-related deficits may occur, such as impaired respiration leading to more frequent breaths, increased hoarseness resulting in the deterioration of the acoustic signal quality or poor articulation of consonants and vowels leading to changes in the time and frequency characteristics of the acoustic signal.
It is essential to develop treatment by determining the exact PD diagnosis and prognosis and to have appropriate objective measurements, so called bio-markers, that are closely related to the presence or progression of the symptoms of the disease. According to the official definition of the US National Institute of Health, a biomarker is a characteristic that is objectively measurable and recognized as an indicator of normal biological or pathological processes or responses to therapeutic intervention [12]. Automation of speech assessment can help yield these objective biomarkers and present opportunities for future improvements in clinical practice and improve the quality of life for PD patients.
The topic of machine learning application for discovery of the biomarkers in PD is the subject of many studies. Most current studies apply advanced signal processing techniques that achieve at least statistical significance or even accuracy greater than 90% [13, 14]. The speech of patients with PD was examined under various experimental protocols, but usually measuring is more complicated than the simple periodical repetition of syllable /pa/. Specifically, using the nonlinear characteristics [13], or the extraction of fundamental frequency, pitch, jitter, shimmer and noise to harmonics ratio, which are the main factors in voice signal [14]. The promising direction of this research area is revealed by a deep learning, e.g. in a combination with PD telediagnosis method for smartphone [15].
The aim of this work is to propose a classification model and associated digital features for rapid and automatic evaluation of speech disorders in PD during rhythmic repetition of syllables. We focused on PD diagnostics using transformed data from audio recordings into speech-expressing features. Then we used the algorithm to decide whether it is an acoustic signal from a healthy individual or a patient with PD.
Methods
This study includes data from the Department of Neurology, 1st Faculty of Medicine and General University Hospital in Prague. Data was provided in 2018 to investigate PD detection using speech utterances. Training data was collected by having patients rhythmically repeat syllables /pa/. The data is composed of audio signals in the WAV format with a sampling frequency of fs = 48 kHz (Fig. 1). A set of data from 30 male PD patients and 30 male healthy age-matched controls (HC), was available for training. Two measurements are available for each individual (120 signals in total, mean length = 30.3 ± 5.6 (std) seconds).

Offline scripts for data loading, data managing, and all experiments have been implemented in the Matlab R2015a (Mathworks, USA). The study was conducted in accordance with the Cross-Industry Process for Data Mining (CRISP-DM) methodology [16].
Feature Extraction
Feature extraction is the most important step in audio classification tasks, as in most pattern recognition problems. We computed some of the basic audio features for groups of sounds stored in WAV files [17]. The features were calculated in a two-step process:
- The audio signal was broken into short-term non-overlapping windows (frames) of 50 ms. For each frame, 6 features were calculated (A–F): Energy Entropy (A), Energy (B), Zero Crossing Rate (C), Spectral Rolloff (D), Spectral Centroid (E) and Spectral Flux (F). This step led to 6 feature sequences for the whole audio signal.
- In the sequel of each of the 6 feature sequences, a descriptive statistic was calculated (Tab. 1). This step led to 6 single statistic values (one for each feature sequence). Those 6 values are the final feature values that characterize the input speech signal.
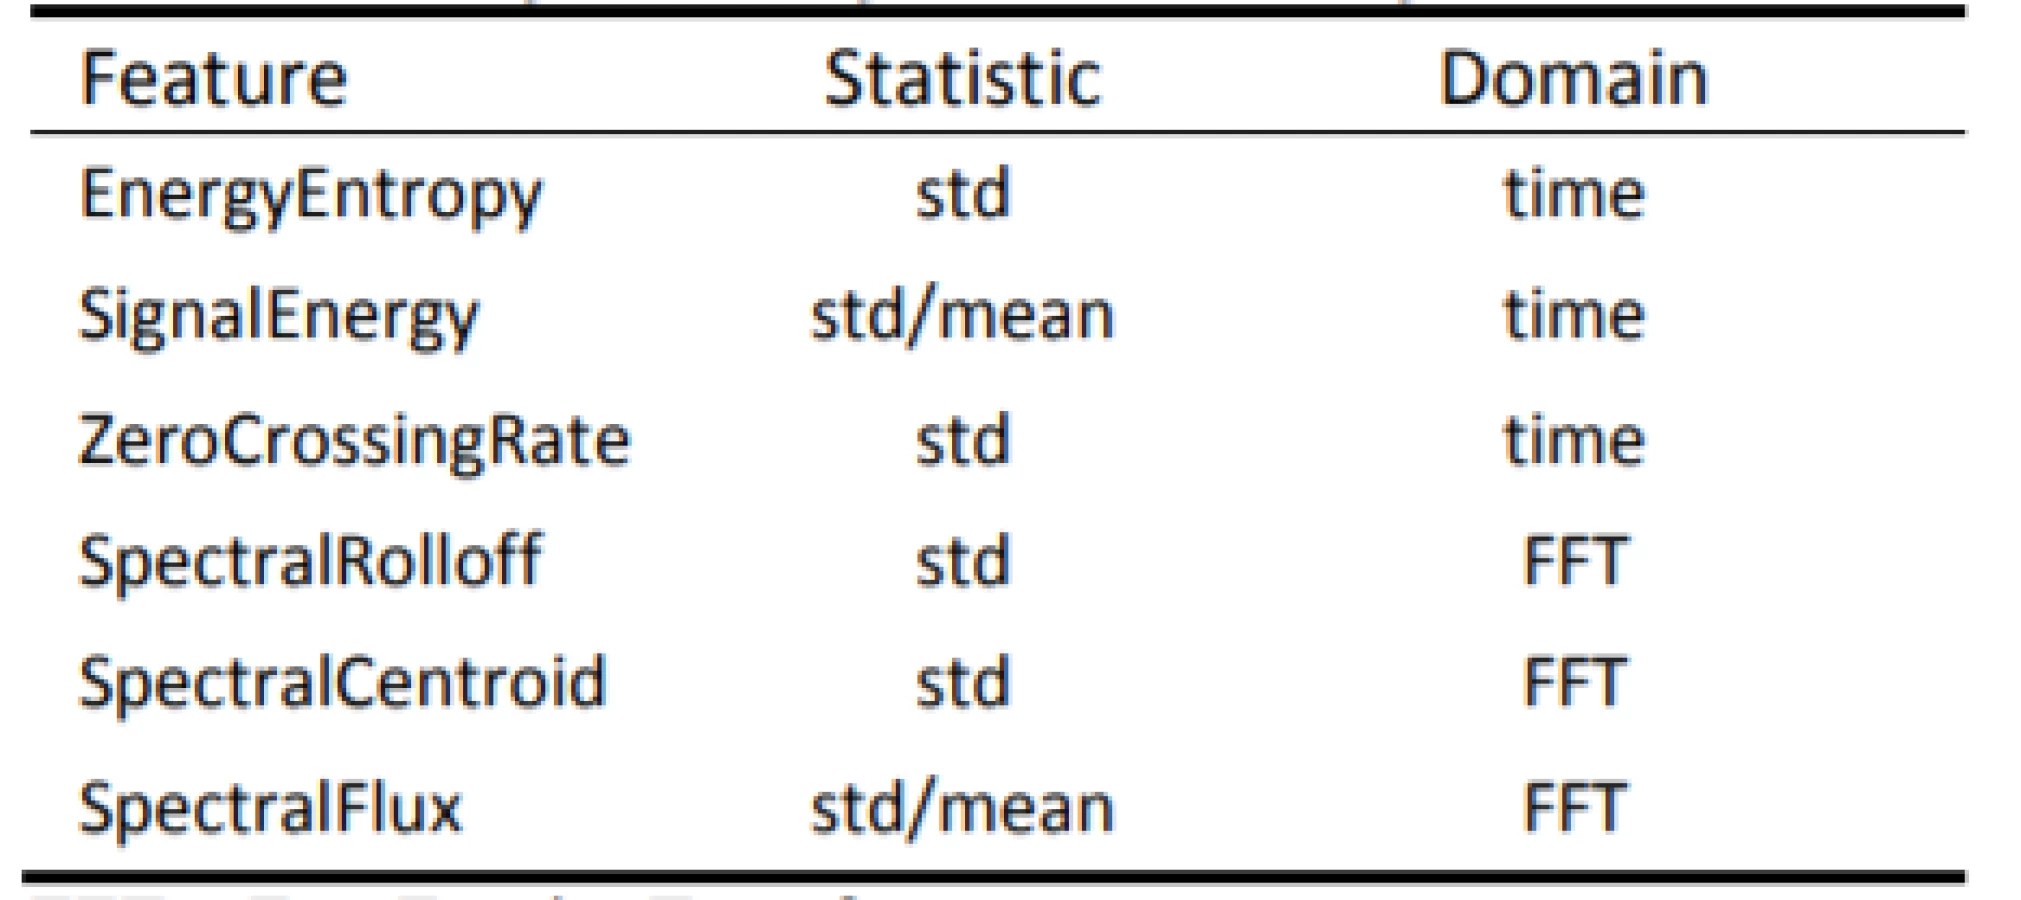
The following audio frame features (A–F) and respective statistics in Table 1 are extracted for each audio signal.
- Energy Entropy

Time domain signal for frame t![]() is split into 10 short blocks. S
is split into 10 short blocks. S![]() is the number of short blocks, s
is the number of short blocks, s ![]() corresponds to the energy of a short block.
corresponds to the energy of a short block.
- Energy

The root-mean-square (RMS) level of a signal reflects the signal energy.
- Zero Crossing Rate

A measure of the noisiness of the signal. xn ![]() is the time domain signal for frame t
is the time domain signal for frame t![]() .
.
- Spectral Rolloff

The frequency Rt ![]() such that,
such that,
A measure of the skewness of the spectral shape. Mt[n]![]() is the magnitude of the Fourier transform at frame t
is the magnitude of the Fourier transform at frame t![]() and frequency bin n
and frequency bin n![]() .
.
- Spectral Centroid

The center of gravity of the magnitude spectrum of short-time Fourier transform.
- Spectral Flux

A measure of the amount of local spectral change. Ntn![]() and Nt-1n
and Nt-1n![]() are the normalized magnitude of the Fourier transform at frames t
are the normalized magnitude of the Fourier transform at frames t![]() and t-1
and t-1![]() .
.
The target attribute was called labels and contained binary values with 1 being the diagnosis of Parkinson's disease.
Statistical methods
The dataset was examined through exploratory data analysis, including visualization and normality assessment. The Jarque-Bera test was used to evaluate normality (JB). JB tests for the null hypothesis that the data comes from a normal distribution. Then we used the two-sided Wilcoxon rank sum test for the null hypothesis that the data are samples from continuous distributions with equal medians. Further Principal Component Analysis (PCA) with Pareto Scree plot and Bartlett test were carried out.
When the variables are in different units or the difference in the variance of different columns is substantial, scaling of the data or use of weights is preferable. We performed the PCA by using inverse variances of the ratings as weights.
Bartlett's test of sphericity checks if there is a certain redundancy between variables that can be summarized with fewer components. The number of dimensions returned is a positive integer value. The dimension is determined by a series of hypothesis tests. The test for ndim = 1 tests the hypothesis that the variances of the data values along each principal component are equal, the test for ndim = 2 tests the hypothesis that the variances along the second through the last component are equal, and so on. The null hypothesis is that the number of dimensions is equal to the number of the largest unequal eigenvalues of the covariance matrix of dataset.
Machine learning methods
Machine learning is a means of discovering underline hidden patterns from data. There are many techniques for HC vs. PD decision making, e.g. classification techniques such as K-means or linear discriminative analysis. Some advanced signal processing techniques (e.g. the Bayesian detector or cepstral coefficients) and classification (e.g. SVM, EM algorithm or neural network) are often applied [18].
For PD prediction, we focused on implementing the following models based on supervised learning:
- AdaBoost – the model creates an ensemble of simple decision trees using the AdaBoost algorithm. Compared to bagging, boosting algorithms use relatively little time or memory, but might need more ensemble members.
- Bagged trees – a bootstrap aggregated ensemble of complex decision trees. Often very accurate but can be slow and memory intensive for large datasets.
- Quadratic SVM – Support Vector Machines that uses quadratic kernel.
- Weighted k-NN – a nearest neighbor classifier that uses distance weighting.
Models were trained using cross validation. Cross validation trains a model for each fold using all the data outside the fold. The method tests each model performance using the data inside the fold, then calculates the average test error over all folds. This approach gives a good estimate of the predictive accuracy of the final model trained with all the data. It requires multiple steps but enables efficient use of all the data, thus making it suitable for small data sets. We used 5-fold cross-validation to train classifiers.
Receiver operating characteristic (ROC) curve analysis was performed to assess the diagnostic accuracy. The area under the ROC curve (AUC) results were considered as excellent for all AUC values between 0.9–1, AUC values between 0.8–0.9 were considered as good, AUC values between 0.7–0.8 were fair, AUC values between 0.6–0.7 were poor and AUC values between 0.5–0.6 failed the accuracy test [19].
The overall accuracy of the models was determined from the confusion matrix using the following formula (7):

Results
This formula represents the ratio of correctly classified recordings to all the recordings in the dataset.
Exploratory data analysis
Exploratory data analysis of the selected pairs of parameters has demonstrated the discriminatory ability of distinguishing PD patients from HC (Fig. 2). Normality was refuted in half of all available parameters, with significant differences in HC vs. PD (Tab. 2). In the unsupervised method K-means clustering case (Zero Crossing Rate, Spectral Flux) we achieved an accuracy of 75% (Fig. 3) on two discriminating parameters.


Principal Component Analysis
The Bartlett's test of sphericity detected 6 necessary components. We performed the principal component analysis by using the inverse variances of the ratings as weights. Given data points in 6-dimensional space were projected into 3-dimensional space (Fig. 4).

Based on the PCA (Fig. 5), we decided to employ all the features for classification. The Pareto scree plot only shows the first five components (instead of the six total) that explain 95% of the total variance. There is no clear rapid decline in the captured amount of variance accounted for by each component. The first component by itself explains approximately 40% of the raw variance. The first three principal components explain roughly two thirds of the total variability.

Supervised classification based on all features
The best results were achieved by the Weighted k-NN algorithm with a success rate of 84.2% (Tab. 3). The quadratic SVM had the worst quantitative results. Four ROC curves representing excellent and good models are displayed in Fig. 6.


Discussion
The proposition of creating advanced machine learning models for objectification of speech pathology diagnostics in which new individuals can be classified was presented. According to the results in Table 1 it is evident that the Weighted k-NN method has achieved satisfactory results (accuracy > 84%; AUC > 0.9), with all the classifiers having accuracy over 80%. Notably, all available data was included in this analysis. Thus, we have justified classifying patients according to transformed attributes in their speech. The outlier detection may yield more accurate results in the future.
In a similar publication [20], the highest level of accuracy was achieved using speech data at 76% using the Support Vector Machine, which corresponds to the results of our unsupervised simplified K-means classification. Using the clustering method, we only achieved a 75% success rate, which was the lowest of the five. This method natively divided the data according to the similarity of attributes of values into two clusters (classes), where these classes were compared with patient status (1: patients suffering from PD, 0: HC).
If we wanted to use classification algorithms to predict that chances of having PD based on the 6 characteristics, it may be reasonable to use PCA to reduce the data to a lower-dimensions to speed up the algorithm. We used the PCA to examine the possibilities of reducing a 6‑dimensional data set into lower dimensions. Although 3D PCA can discriminate well, we have chosen to build the models with all the features (Bartlett’s test; ndim = 6). Pareto-Scree plot confirmed the result of the Bartlett's test. In addition to the PCA, it is possible to apply some feature selection algorithm and to reduce the feature’s space, because of Spectral Rolloff and Zero Crossing Rate showing a linear dependence on the scatter plot. However, reduction should not have a substantial impact on classification considering the result from PCA.
Unlike statistical learning, machine learning does not focus on the accurate interpretation of model parameters. We are aiming for the highest classification accuracy. The current limitation in this research was that of a small sample size available for testing and validation. Determining more robust performance characteristics for classifiers would require more data which classifiers have not seen yet. Another limitation comes directly from the nature of the experiment. The experiment builds on the assumption that there exist differences in the rhythmic repetition of the syllable, but a person may not be able to hold the rhythm naturally.
We assume that this research will contribute to a better description of the type of objectification predictors in PD diagnostics. Rapid automatic patient diagnostics methods are important and can help experts in detecting Parkinson's disease before the onset of typical symptoms. Recording is effortless from the technical point of view.
Conclusion
In this article we have described the machine learning models for predicting Parkinson's disease on data obtained from patients' speech records and healthy controls. Proposed machine learning models (AdaBoost, Bagged trees, Quadratic SVM and k-NN) have confirmed the hypothesis that speech parameters differentiate patients from HC (AUCs > 0.86). The methodology for processing speech pathology signals has been implemented and several instrumental speech features have been identified: Energy Entropy, Signal Energy, Zero Crossing Rate, Spectral Rolloff, Spectral Centroid and Spectral Flux. These features are important for the patient's final classification and are related to the subject class membership (p < 0.05).
Acknowledgement
This study was supported by the Grant no. SGS18/102/OHK4/1T/17 "The Application of Data Mining Techniques to Heterogeneous Biomedical Sources", Grant Agency of the Czech Technical University in Prague. Further thanks to the Department of Neurology, 1st Faculty of Medicine, Charles University and Faculty of Electrical Engineering, CTU in Prague, namely Jan Rusz, Ph.D., for providing the research dataset.
Ing. Ondřej Klempíř
Department of Biomedical Informatics
Faculty of Biomedical Engineering
Czech Technical University in Prague
Nám. Sítná 3105, CZ-272 01 Kladno
E-mail: klempond@gmail.com
Phone: +420 605 536 419
Sources
- Topol, E.: The patient will see you now. The future of medicine is in your hands. Basic Books, New York, 2015. ISBN 978-0-465-04002-5.
- Ali-Eldin, A. M. R., Hafez, E. A.: Towards a universal architecture for disease data models sharing and evaluation. In: 2017 International Symposium on Networks, Computers and Communications (ISNCC), IEEE, (2017), p. 1–6.
- Yavuz, E., Kasapbaşı, M. C, Eyüpoğlu, C., Yazıcı, R.: An epileptic seizure detection system based on cepstral analysis and generalized regression neural network. Biocybernetics and Biomedical Engineering, 2018; vol. 38, no. 2, p. 201–216.
- Zhang, T., Chen, W., Li, M.: Fuzzy distribution entropy and its application in automated seizure detection technique. Biomedical Signal Processing and Control, 2018; vol. 39, p. 360–367.
- Poewe, W., Seppi, K., Tanner, C. M., Halliday, G. M., Brundin, P., Volkmann, J., Schrag, A. E., Lang, A. E.: Parkinson disease. Nat Rev Dis Primers, 2017; 23 : 17013.
- Duffy, J. R.: Motor Speech Disorders: Substrates, Differential Diagnosis and Management, 3 Edn. Mosby, St. Louis, 2013.
- Postuma, R. B., Lang, A. E., Gagnon, J. F., Pelletier, A., Montplaisir, J. Y.: How does parkinsonism start? Prodromal parkinsonism motor changes in idiopathic REM sleep behaviour disorder, Brain, 2012; vol. 135, p. 1860–1870.
- Hlavnicka, J., Cmejla, R., Tykalova, T., Sonka, K., Ruzicka, E., Rusz, J.: Automated analysis of connected speech reveals early biomarkers of Parkinson’s disease in patients with rapid eye movement sleep behaviour disorder, Sci Rep, 2017; vol. 7, no. 12.
- Rusz, J., Hlavnicka, J., Cmejla, R., Ruzicka, E.: Automatic evaluation of speech rhythm instability and acceleration in dysarthrias associated with basal ganglia dysfunction, Front Bioeng Biotechnol, 2015; vol. 3, no. 104.
- Skodda, S., Schlegel, U.: Speech rate and rhythm in Parkinson’s Disease, Mov Disord, 2008; vol. 23, p. 985–992.
- Skodda, S., Flasskamp, A., Schlegel, U.: Instability of syllable repetition as a model for impaired motor processing: is Parkinson's disease a "rhythm disorder?", J Neural Transm, 2010; vol. 117, p. 605–612.
- Strimbu, K., Tavel, J. A.: What are biomarkers?, Current Opinion in HIV and AIDS, 2010; vol. 5, no. 6, p. 463–466.
- Tsanas, A., Little, M. A., McSharry, P. E., Spielman, J., Ramig, L. O.: Novel Speech Signal Processing Algorithms for High-Accuracy Classification of Parkinson’s Disease, IEEE Transactions on Biomedical Engineering, 2012; vol. 59, no. 5, p. 1264–1271.
- Shahbakhi, M., Far, D. T., Tahami, E.: Speech Analysis for Diagnosis of Parkinson’s Disease Using Genetic Algorithm and Support Vector Machine, Journal of Biomedical Science and Engineering, 2014; vol. 7, no. 4, p. 147–156.
- Zhang, Y. N.: Can a Smartphone Diagnose Parkinson Disease? A Deep Neural Network Method and Telediagnosis System Implementation. Parkinson’s Disease, 2017, p. 1–11.
- Wirth, R.: CRISP-DM: Towards a standard process model for data mining. In: Proceedings of the 4th international conference on the practical applications of knowledge discovery and data mining, Citeseer, (2000), p. 29–39.
- https://www.mathworks.com/matlabcentral/fileexchange/19236-some-basic-audio-features [cit. 15. 3. 2017].
- https://www.mathworks.com/matlabcentral/fileexchange/45831-matlab-audio-analysis-library?focused=3812573&tab=function [cit. 15. 3. 2017].
- Khouli, R. H. E., Katarzyna, K. J., Barker, P. B., Habba, M. R. Jacobs, M. A., Bluemke, D. A.: The Relationship of Temporal Resolution to Diagnostic Performance for Dynamic Contrast Enhanced (DCE) MRI of the Breast, J Magn Reson Imaging, 2009; vol. 30, no. 5, p. 999–1004.
- Geeta, Y.: Prediction of Parkinson's disease using data mining methods: A comparative analysis of tree, statistical and support vector machine classifiers. In: Computing and Communication Systems (NCCCS), 2012 National Conference on Computing and Communication Systems, IEEE, (2012), p. 1–8.
Labels
BiomedicineArticle was published in
The Clinician and Technology Journal

2018 Issue 2
Most read in this issue
- Application of sibgle wireless holter to simultaneous EMG, MMG and eim measurement of human muscles activity
- Response by an automated inspired oxygen control system to hypoxemic episodes: assessment of damping
- Workflow for bioprinting of cell-ladem bioink
- Machine learning using speech utterances for parkinson disease detection